
|
|
|
Advances in brain imaging facilitate the understanding of cognitive phenomena and neurological diseases. However, high-resolution brain imaging through intact animal skulls remains challenging for pure optical modalities because the optical scattering and absorption of the skull degrade the imaging resolution and signal-to-noise ratio (SNR). Photoacoustic imaging, combining light and ultrasound in a single hybrid technology, suggests a potential solution. Using acoustic-resolution photoacoustic microscopy (AR-PAM), Stein recently demonstrated mouse brain imaging through both intact scalp and skull.1 This noninvasive feature is highly desirable for functional or chronic studies; however, with its current spatial resolution (lateral resolution: ; axial resolution: ), capillaries are not resolvable. To fill the gap, Maslov developed optical-resolution photoacoustic microscopy (OR-PAM) capable of imaging single capillaries in vivo.2 The lateral resolution of OR-PAM matches the size of a single red blood cell (RBC), and its sensitivity enables single RBC detection.3 Here, we report on the first demonstration of OR-PAM for functional brain microvascular imaging down to single capillaries through intact mouse skulls. The minimally invasive feature is favorable for chronic study of cortical plasticity. Moreover, because neuronal activity is widely assumed to spatially correlate most closely to the capillary bed response,4 improving localization of signals down to the capillary level will enable functional brain mapping at micrometer resolution. Before functional brain imaging, a Swiss Webster mouse (Hsd:ND4, Harlan Co., ) was anesthetized by intraperitoneally administering a dose of ketamine and xylazine and transferred to a stereotaxic imaging stage. The scalp of the mouse was surgically removed, and the exposed skull was cleaned with 0.9% sodium chloride irrigation solution right before imaging. Ultrasonic gel was used for ultrasound coupling and maintaining skull hydration. Throughout the experiment, the animal was supplied with breathing-grade air and maintained under anesthesia using vaporized isoflurane (1.0–1.5% isoflurane with an airflow rate of ). The body temperature of the animal was maintained at by a temperature-controlled heating pad. At the end of the experiment protocol, the animal was euthanatized by an intraperitoneal administration of pentobarbital at a dosage of . The detailed system description can be found in our published papers.2, 3 In photoacoustic measurements of hemoglobin concentration and oxygenation, we assume that, in the visible spectral range, oxyhemoglobin and deoxyhemoglobin (HbR) are the dominant absorbing compounds in blood.5 Thus, a dual-wavelength measurement is adequate to image , though using more wavelengths is expected to yield more accurate results.6 The two wavelengths chosen here are 570 and , where the absorption contrast between blood and background brain tissues are high enough to enable satisfactory imaging quality.5 According to the published absorption spectra of rat hemoglobin,7 is an isosbestic point, at which and HbR have the same molar extinction coefficients. Thus, the photoacoustic signal acquired at this wavelength reflects the total hemoglobin concentration (HbT), and is an -absorption-dominant wavelength, which helps differentiate the two types of hemoglobin. Because blood oxygenation is highly correlated with local metabolism, the value is generally time variant. To minimize measurement error due to the possible temporal fluctuation in blood oxygenation, we implemented a wavelength autotuning program to control the dye laser, and imaged the same cross-sectional scan (B-scan) for each of the wavelengths before moving to the next B-scan. The region of interest (ROI) was scanned with a step size of . The dual-wavelength measurement took , which was mostly limited by the wavelength tuning speed of the dye laser. Figures 1a and 1b are maximum amplitude projection (MAP) images of the mouse brain microvasculature under systemic normoxia at the optical wavelengths of 570 and , respectively. Because is an isosbestic point, Fig. 1a maps the HbT, regardless of the blood oxygenation. Microvessels labeled with CL in Fig. 1a appear to be single capillaries with diameters of . A corresponding volumetric rendering is shown in Videos 1 . At the conclusion of the dual-wavelength measurement, the concentrations of HbR and , as well as the values, were calculated based on the model described in previously published work.5, 6 As shown in Fig. 1c, different levels are visualized with pseudocolors ranging from blue to red, while the HbT measured at the isosbestic point is represented by pixel brightness. According to known physiology, the red vessels ( values of ) are believed to be arterioles, whereas the green ones ( values as low as 60–70%) are most likely to be venules. However, in the microcirculation, there is no clear cutoff in value between arterioles and venules.8 The blood oxygenation is closely associated with the microvascular branching order8 and the local metabolic activity of the tissue.9 To demonstrate the oxygen gradients in the brain microcirculation, we selectively analyzed a postcapillary venular tree [Fig. 1d] and a precapillary arteriolar tree [Fig. 1e] highlighted in Fig. 1c by the blue and red dashed boxes, respectively. The vessel diameters and the corresponding values in different branching orders are listed in Tables 1, 2 . A negative correlation between the branching order and its mean value is observed in both the arteriolar and venular trees with a linear regression analysis (arteriolar tree: , venular tree: , , as shown in Fig. 2 . Our results suggest that: (i) the blood oxygenation level is higher in the arteriolar tree than in the venular tree; (ii) capillaries are not the only oxygen exchange site in the microcirculation because the decreases significantly with vascular branching in the precapillary arteriolar tree ( from order 1 to 4); and (iii) a diffusional shunt is present between arterioles and venules to elevate the oxygen level in “large” venules because the increases noticeably with blood confluence in the postcapillary venular tree ( from order 1 to 4). Our observation is in agreement with the published work.8, 9, 10 Fig. 1In vivo functional OR-PAM imaging of mouse brain microvasculature through an intact skull. (a) MAP image acquired at ; (b) MAP image acquired at ; (c) vessel-by-vessel mapping; (d) a venular tree with branching orders [boxed by blue dashed lines in (c)]; (e) an arteriolar tree with branching orders [boxed by red dashed lines in (c)]. The calculated values are shown in the color bar. PA: photoacoustic signal amplitude. The scale bar applies to (a), (b), and (c). (Color online only.) 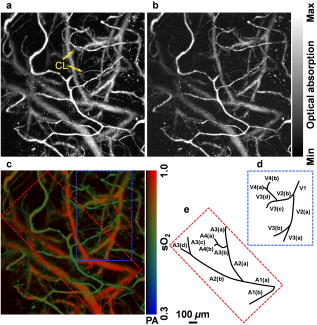 Fig. 2The value versus the vascular branching order in a precapillary arteriolar tree and a postcapillary venular tree. The square and round markers represent the mean values in each branching order, and the error bars stand for the standard deviations of the mean values.  Table 1The vessel diameters and the sO2 values in different branching orders in a venular tree. Values are in mean±standard deviation format.
Table 2The vessel diameters and the sO2 values in different branching orders in an arteriolar tree. Values are in mean±standard deviation format.
Video 1In vivo volumetric visualization of the mouse brain microvasculature through an intact skull by OR-PAM (QuickTime 4 MB) .  According to a previous study,11 the wavelength-dependent optical attenuation due to the intact skull affects the measurement accuracy. Here, this wavelength dependence was estimated by measuring the photoacoustic signals of a black polyethylene film attached beneath the skull of a freshly sacrificed mouse of the same type at the two operating wavelengths, respectively. The mouse skull was submerged in 0.9% sodium chloride irrigation solution to keep hydration. Because the black polyethylene film can be considered as a neutral absorber in the visible spectral range, the wavelength dependence in the photoacoustic signals is expected to be predominantly from the mouse skull. If we consider the skull to be homogeneous within the ROI,5 then such dependence can be simply compensated for by applying different calibration factors to the measured photoacoustic signals at different optical wavelengths. However, the wavelength-dependent optical scattering and absorption of brain tissues are difficult to compensate for due to heterogeneous tissue structure and composition. In summary, OR-PAM has been applied to mouse brain imaging through intact skulls with capillary-level spatial resolution. Functional information of HbT and within single microvessels was imaged simultaneously using a dual-wavelength measurement. The ability to extract brain oxygen saturation information on a single-capillary basis with minimal invasiveness makes OR-PAM a potential tool for high-resolution functional brain mapping, quantitative analysis of brain energy metabolism, and chronic studies of cortical plasticity and neurological diseases. It is worth noting that the maximum imaging depth of OR-PAM, estimated from the surface of the intact skull, is when the system is operated at the Q-band of the hemoglobin absorption spectrum (optical wavelength: ). This penetration is slightly less than the typical imaging depth of two-photon microscopy (TPM) through a skull window with near-infrared (NIR) excitation,12 where no bone is in the optical path. NIR light sustains less brain tissue absorption and scattering than visible light. However, owing to the quadratic intensity dependence in two-photon generation and linear dependence in OR-PAM, the light scattering and absorption within the intact skull as well as the surface scattering at the skull-brain interface decreases the fluorescence signal in TPM much faster than the photoacoustic signal in OR-PAM. As a result, TPM has not demonstrated transcranial imaging. By utilizing NIR operation and compromising the lateral resolution, doppler optical coherence tomography can extend the imaging depth to .13 To enhance the penetration of OR-PAM, system SNR or imaging contrast needs to be further improved. AcknowledgmentsThe authors appreciate Prof. James Ballard’s close reading of the paper. This work was sponsored by National Institutes of Health Grants No. R01 EB000712, No. R01 NS46214, No. R01 EB008085, and No. U54 CA136398. L.W. has a financial interest in Endra, Inc., which, however, did not support this work. ReferencesE. W. Stein, K. Maslov, and L. V. Wang,
“Noninvasive, in vivo imaging of blood-oxygenation dynamics within the mouse brain using photoacoustic microscopy,”
J. Biomed. Opt., 14
(2), 020502
(2009). https://doi.org/10.1117/1.3095799 1083-3668 Google Scholar
K. Maslov, H. F. Zhang, S. Hu, and L. V. Wang,
“Optical-resolution photoacoustic microscopy for in vivo imaging of single capillaries,”
Opt. Lett., 33
(9), 929
–931
(2008). https://doi.org/10.1364/OL.33.000929 0146-9592 Google Scholar
K. Maslov, H. F. Zhang, S. Hu, and L. V. Wang,
“Optical-resolution confocal photoacoustic microscopy,”
Proc. SPIE, 6856 68561I
(2008). https://doi.org/10.1117/12.763889 0277-786X Google Scholar
E. M. Hillman, A. Devor, M. B. Bouchard, A. K. Dunn, G. W. Krauss, J. Skoch, B. J. Bacskai, A. M. Dale, and D. A. Boas,
“Depth-resolved optical imaging and microscopy of vascular compartment dynamics during somatosensory stimulation,”
Neuroimage, 35
(1), 89
–104
(2007). https://doi.org/10.1016/j.neuroimage.2006.11.032 1053-8119 Google Scholar
X. Wang, X. Xie, G. Ku, L. V. Wang, and G. Stoica,
“Noninvasive imaging of hemoglobin concentration and oxygenation in the rat brain using high-resolution photoacoustic tomography,”
J. Biomed. Opt., 11
(2), 024015
(2006). https://doi.org/10.1117/1.2192804 1083-3668 Google Scholar
H. F. Zhang, K. Maslov, M. Sivaramakrishnan, G. Stoica, and L. V. Wang,
“Imaging of hemoglobin oxygen saturation variations in single vessels in vivo using photoacoustic microscopy,”
Appl. Phys. Lett., 90
(5), 053901-1-053901-3
(2007). https://doi.org/10.1063/1.2435697 0003-6951 Google Scholar
W. G. Zijlstra, A. Buursma, and O. W. van Assendelft, Visible and Near Infrared Absorption Spectra of Human and Animal Hemoglobin, Determination and Application, VSP, Amsterdam, The Netherlands
(2000). Google Scholar
H. Kobayashi and N. Takizawa,
“Oxygen saturation and pH changes in cremaster microvessels of the rat,”
Am. J. Physiol., 270
(4), H1453
–1461
(1996). 0002-9513 Google Scholar
A. G. Tsai, P. C. Johnson, and M. Intaglietta,
“Oxygen gradients in the microcirculation,”
Physiol. Rev., 83
(3), 933
–963
(2003). 0031-9333 Google Scholar
E. Vovenko,
“Distribution of oxygen tension on the surface of arterioles, capillaries and venules of brain cortex and in tissue in normoxia: an experimental study on rats,”
Pfluegers Arch., 437
(4), 617
–623
(1999). https://doi.org/10.1007/s004240050825 0031-6768 Google Scholar
X. Wang, D. L. Chamberland, and G. Xi,
“Noninvasive reflection mode photoacoustic imaging through infant skull toward imaging of neonatal brains,”
J. Neurosci. Methods, 168
(2), 412
–421
(2008). https://doi.org/10.1016/j.jneumeth.2007.11.007 0165-0270 Google Scholar
F. Helmchen and W. Denk,
“Deep tissue two-photon microscopy,”
Nat. Methods, 2
(12), 932
–940
(2005). https://doi.org/10.1038/nmeth818 1548-7091 Google Scholar
R. K. Wang, S. L. Jacques, Z. Ma, S. Hurst, S. R. Hanson, and A. Gruber,
“Three dimensional optical angiography,”
Opt. Express, 15
(7), 4083
–4097
(2007). https://doi.org/10.1364/OE.15.004083 1094-4087 Google Scholar
|
||||||||||||||||||||||||||||||||||||||||||||||||||||||||||||||||||||||||||||||||||||


