|
|
1.IntroductionStroke is the third most common cause of mortality and of acquired disability worldwide. Patients with stroke can acquire significant neurological impairments and also metabolic changes that contribute to poststroke complications.1 The clinical syndrome resulting from central nervous system (CNS) lesion depends on its location and extent, and the time since it occurred. The clinical and instrumental examinations generally are focused on motor control to check positive symptoms like clonus, increased muscles tone, and released flexor reflexes, and negative symptoms like loss of dexterity, weakness, and the associated muscular changes in terms of atrophy and loss of rheological properties of the muscles. Less attention is oriented to detect peripheral vascular impact on the affected limb, which could play a big part in the motor recovery perspective. These dysfunctions can be linked to microcirculation and/or macrocirculation problems.2 In the first case, the limb can appear decolorated or cold, and there could be edema or dystrophy. Instead, abnormal macrocirculation can lead to the peripheral vascular disease condition, which is characterized by intermittent claudicating. Several hypotheses have been suggested to explain the symptoms and complaints of their pathology as a circulatory problem: after stroke, overactivity (hypertonia, dystonia, spasticity, and spastic dystonia) can arise in muscles, and it might hinder blood circulation. In addition, the paresis may lead to a dysfunction of the muscle pump and then to disturbances in macrocirculation and microcirculation. Finally, loss of voluntary muscle control after stroke may lead to atrophy3 or to abnormal metabolic function.4 Prolonged voluntary disuse might aggravate further changes toward lowered oxidative metabolism and capillary supply. These metabolic abnormalities in the peripheral tissues can decrease muscle strength and endurance, reducing the possibility to perform the program of rehabilitation exercise that is crucial in the recovery of patients with stroke. Functional electrical stimulation (FES) is a well established method in the rehabilitation of hemiplegic patients, because it helps the overall rehabilitation process.5, 6 It was demonstrated that treatment based on FES increased muscular strength, enhanced walking ability, and improved motor control, both increasing agonist electromyographic activity and decreasing electromyographic co-contraction ratios.6, 7, 8, 9, 10 Since FES has become an established rehabilitation method for stroke patients, it is crucial to investigate the muscular metabolism of the artificial contraction. It is important to understand its effect on the muscle, and in particular, whether this effect is different between patients and able-bodied (AB) subjects and between the two limbs of the patients. Among all the noninvasive techniques developed to study tissue hemodynamics of muscles, near-infrared spectroscopy (NIRS) seems to have good potential.11, 12 NIRS provides high temporal resolution and relatively low spatial resolution without having the high costs and poor mobility of magnetic resonance imaging and positron emission tomography. Few studies exist on the application of NIRS to investigate the metabolism of stroke patients, but they mostly involve chronic patients in which there is an important muscle atrophy affecting the muscle properties (a transformation from oxidative to nonoxidative fibers caused by the disuse) and muscular vascularization.13, 14 In particular, Jigjid analyzed the changes in oxygenation during a passive leg movement and during the recovery phase after the movement on chronic stroke patients. They demonstrated that there was a significant difference in the concentration changes of the oxygenated hemoglobin between the muscles of the paretic and nonparetic sides.13 The degree of the changes of the depended on the level of motor recovery after stroke and on the time passed after the stroke event. Indeed, subjects with good motor recovery showed less difference in the level between the paretic and nonparetic sides of the muscle. Our study arises from the hypothesis that stroke produces an altered muscular metabolic environment, not only on chronic but also in postacute patients, and that the use of time-domain NIRS to measure metabolic parameters during a repetitive artificial contraction induced by FES could be very helpful in understanding the muscular consequences of pathology. In particular, the experiments described in this study follow two questions. 1. What is the impact of a cerebral vascular pathology provoking primarily neurological impairments, such as stroke, on the muscular metabolism? To answer this first question, a comparison between the muscular metabolisms measured locally on the paretic and healthy limb of patients and on both the legs of AB subjects of similar age was carried out. In particular, we chose to measure the muscular metabolism during a contraction induced by FES, because FES assured a greater repeatability of the exercise with respect to a good voluntary motor task that sometimes is difficult to obtain mainly on these patients. 2. Are there any correlations between the functional indexes used in clinics to evaluate the patient recovery [e.g., the motricity index (MI)] and the muscular metabolism measured during an artificial contraction? In this case, the metabolic parameters could help in monitoring the rehabilitation and probably in choosing the best treatment able to optimize and speed up the recovery. 2.Methods2.1.Experimental Setup2.1.1.Functional electrical stimulationQuadricep muscles were stimulated by adhesive rectangular surface electrodes. The knee joint angle was measured by an electrogoniometer, which comprised two plastic bars attached to the thigh and shank, and a linear potentiometer fixed on the joint. This device was interfaced with the PC by means of an A/D board with a sample rate of . A current-controlled eight-channel stimulator, RehaStim Pro™ (Hasomed GmbH, Germany), was used during the experiments. The entire setup was connected to a Linux-PC running Matlab/Simulink™ for data acquisition and for control of the stimulation device. 2.1.2.Time-domain near-infrared spectroscopyA dual-wavelength multichannel time-resolved system for NIRS was used. The system was based on picosecond laser sources, fiber optics switches and fused splitters for light delivery, homemade fiber bundles and multianode photomultipliers for light collection, and time-correlated single photon counting electronics for data acquisition.15 TD-NIRS measurements were performed simultaneously on the left and right legs. The optical probe (consisting of a few injection and detection optic fibers at a relative distance of ) was placed over the rectus femoris, in between the FES electrodes, at about from the upper edge of the patella. Custom-made fiber holders were designed to keep fibers normally to the skin by black rubber pads. Holders were kept in place on the muscle of the subject by biadhesive tape (see Fig. 1 ). We avoided Velcro® bands that can cause limb occlusion or compression during exercise. Simultaneous estimate of reduced scattering coefficient and absorption coefficient for each source-detector couple was achieved by best fitting of time-resolved reflectance curves with a standard model of diffusion theory.16 To enhance the contribution from deep layers and to remove possible disturbances caused by superficial adipose layers, a correction method based on the use of late time windows was also applied.17 Taking the assumption that deoxy- and oxyhemoglobin (HHb and , respectively) are the main chromophores contributing to absorption, their concentrations are easily derived by using the knowledge of the extinction coefficient.18 An important issue to notice is that the NIRS technique is unable to distinguish between the amounts of released by hemoglobin or myoglobin, because the optical spectra of the two chromospheres are overlapped. However, within a given volume of muscle, the concentration of hemoglobin is about 1.5 times greater than the concentration of myoglobin, and hemoglobin has four oxygen binding sites compared to one binding site of myoglobin.19 Therefore, it was estimated that the contribution due to myoglobin affects less than 20% of the oxygen response.20 The NIRS signals, electrical stimulation, and knee angle were properly synchronized. 2.2.SubjectsSeven male AB subjects and nine male stroke patients took part in the study. Mean age was (range ) for AB subjects and (range ) for patients. Mean body mass index was (range ) for AB and (range ) for patients. Only two of the healthy subjects performed a frequent physical activity (more than two days a week), while the others led a sedentary life. All the stroke patients were recovered in the clinic and underwent about a day of rehabilitation. The rehabilitation performed with therapists included stretching, muscular conditioning with active or passive motility, and exercises to recover trunk control, standing position, and walking. The sequence and composition of exercises was customized for each patient. The group was very heterogeneous in terms of their level of recovery after the stroke. Conditions for the study were that the patients had to be collaborative, able to understand simple instructions, be without any joint rigidity, and have an Ashworth in all the lower limb muscles.21 No patients had evidence of peripheral vascular disease. Only P5 has diabetes mellitus. All the patients except P7 were postacute, i.e., less than had passed after the stroke. Table 1 reports details on the clinical data of the stroke patients included in the study. In particular, the values of MI obtained by the paretic lower limb of the patients are shown. MI is a clinical index used to evaluate the mobility of the ankle, knee, and hip joint during voluntary movements performed against gravity or against an external resistance.22 Finally, the thickness of the adipose tissue over all the investigated sites was less than for all subjects. Table 1Details on the patients included in the study. The range of MI is comprised between 0 and 100, where 100 means that the functionality is completely recovered. MIin and MIout are the values measured when the patient was admitted and dismissed from the hospital. The MItest is the estimated value of MI computed from the linear interpolation between MIin and MIout .
Written informed consent was obtained from all subjects. The study was approved by the ethical review board of Villa Beretta Rehabilitation Centre (Costamasnaga, Italy). 2.3.ProtocolThe test subject was seated on a bench that allowed the shanks to swing freely. Once attached to the stimulation electrodes, the stimulation current amplitudes for the quadriceps were selected. For all the subjects, the stimulation pulse width used was and the stimulation frequency was , while the current amplitude was selected individually for each leg. Fixing the pulse width at , the current amplitude was increased in steps of up to the level able to yield a tolerated massive contraction of the rectus femoris with a complete extension of the leg when it was possible. Once the optodes were attached on the rectus femoris (see Fig. 1), the test begun. Each subject performed two trials, one per each leg. The single trial lasted : during the initial , the subject was not stimulated at all (baseline period); then the quadriceps was stimulated for a total of , in which 15 flex-extension movements were induced by FES (the stimulation was on for and off for ); in the remaining part , the stimulation was off. TD-NIRS measurements on both legs were carried out during the whole trial with a sampling time of . The FES knee flex-extension exercise was intended as a fatigue-inducing exercise, and the knee angle was the measure of this fatiguing effect. 2.4.Data ProcessingThe trajectories of the concentration of HHb and were analyzed. Then the oxygen saturation and the total hemoglobin concentration were derived. 2.4.1.Initial baseline periodFor each subject, the metabolic behavior of both legs was analyzed. The mean value of HHb, , , and tHb obtained in the first were computed in the first trial to avoid possible effects of the sequence of exercise on the baseline value. 2.4.2.Functional electrical stimulation exercise periodWe computed the angular amplitude of each leg extension movement as the difference between the maximum knee angle reached in the in which the stimulation was on, and the mean knee angle value maintained during the previous to each stimulation onset. Then, for each subject we computed the mean angular amplitude obtained during 1 to 5, 6 to 10, and 11 to 15 flexion-extension movements, called , , and , respectively. In addition, during the FES exercise, the muscle oxygen consumption ( , expressed in units of ml ) was calculated, according to the method previously described in Refs. 23, 24. In particular, we measured in the flex-extensions 8 to 15, when the tHb was fairly constant. was computed from the slope of the decrease in during the last of each flex-extension. 2.4.3.Recovery periodThe metabolic time courses were filtered with a Savitzky-Golay filter with a time window of , and normalized to the corresponding initial values of the recovery period. For all the metabolic parameters, a normality area limited by the quartiles of the recovery trajectories obtained by AB subjects was computed. To evaluate the metabolic recovery of patients, the HHb, , , and tHb trajectories obtained by each patient during the recovery phase were compared to the correspondent normality areas. In particular, correlation coefficients obtained between the recovery trajectories measured on each patient of the group, and the mean trajectories computed averaging the AB subject behavior, were calculated. Thus, was calculated on 1125 samples ( at ). 2.5.StatisticsA statistical analysis was performed using Matlab/Statistical Toolbox, (Mathworks, Natick, Massachusetts) on the following variables:
3.ResultsThe trajectories of the concentration of HHb, , , and tHb were analyzed. Figure 2 shows a comparison of the time courses of , , , and that are the variations with respect to their mean baseline value, in the stimulated and the resting leg of an AB subject and on a subject with stroke (P1). For P1, the stimulated leg is the paretic one. During the whole trial the resting limb maintains a stable condition both in the AB subject and in the patient. In the baseline period (i.e., first of the protocol), , , , and were rather stable for all the AB and patient limbs. During the FES application, a spiking oscillating behavior was observed on the AB stimulated limb in all the time curves [Figs. to ]. This behavior is probably associated with the rapid muscle contraction that induces a sort of occlusion on the tight. This trend is less evident in the paretic leg of the patient. After the end of the FES exercise (after ), in the stimulated legs of the healthy subjects a slow decrease in [Fig. 2a], a gradual increase in the [Fig. 2b], and [Fig. 2c] were noticed; remained quite stable [Fig. 2d]. These trends indicated a recovery of the oxygenated blood substituting the deoxygenated one maintaining an overall equilibrium. In paretic limbs, similar results can be qualitatively observed, but all the variations were less apparent than in AB subjects [Figs. 2a, 2b, 2c, 2d]. The comparison between the functional behavior of one leg of one AB subject and the paretic leg of P1 is reported in Figs. 2e and , where the knee angle produced by the stimulation of the quadriceps is shown. The maximum extension reached by the patient is less than half of the one produced by the AB subject. Observing the time profile of the angle during the exercise, it is clear that the exercise seems to be more fatiguing for the patient paretic limb than for the AB subject. Fig. 2Example of the typical curves of one healthy subject (black line) and the stroke patient P1 (gray line). For P1, the stimulated limb is the paretic one. Panels (a) through (e) report respectively the , , , and knee angle obtained by the stimulated leg. through show a magnified view of panels (a) through (e) during three movements of the FES-induced exercise. (f) through (i) report the metabolic time curves obtained on the limb at rest.  3.1.Initial Baseline PeriodThe metabolic behavior obtained in the baseline period was analyzed. In Table 2 the absolute mean baseline values of HHb, , , and tHb are reported. These baseline values are important to define the initial conditions and to understand if there are significant differences in the basal blood flow of the three groups, ABL, PHL, and PPL (Fig. 3 ). Comparing patients’ initial value ranges and ABL ones, similar variability was observed, confirmed by the Kruskal Wallis test. The initial values of HHb and were widely spread among patients, even if between the two legs of each patient similar values were obtained (Table 2). However, it would be important to notice that the PPL always started from lower hemodynamic values; this means that a slight lower blood volume was available in the paretic leg. Table 2Mean values of the HHb, O2Hb , SO2 , and tHb measured during the first 30s of the protocol [baseline period (BL)]. Concerning AB subjects, only the median value and the quartiles of the parameters obtained by the two limbs of the whole group are shown.
An overall comparison of the two leg values by statistical analysis confirmed that there were not differences between the two lower limbs of the patients. 3.2.Functional Electrical Stimulation Exercise PhaseIn Table 3 the angular amplitudes obtained in the beginning , middle , and end of the FES exercise are reported. The patient P7 was excluded from the analysis because during the exercise he did not produced any angular movement with the paretic limb. Therefore, it was not possible to assert that the FES exercise was really fatiguing or at least that it had a metabolic significant impact on the patient. The amplitude of the knee angle obtained by the three groups is shown in Fig. 4 . The angular amplitude produced by PPL was at least half of the one produced by ABL and PHL, as shown in Fig. 4, in all three phases of the movement ( , , and ). Instead, the PHL group behaved similarly to the ABL: no significant differences were found between PHL and ABL groups. Fig. 4The knee-angle amplitude obtained by the three groups of limbs. The median and quartiles are referred to the first five , second five , and third five movements, respectively. The extremities of the lines over the bars indicate that the Dunn-Sidak posthoc test showed a significant difference between the two groups. means that ; means that .  Table 3A1 , A2 , and A3 , obtained during the FES exercise. The angle obtained by the healthy limb of P3 was not available (NA) because of problems with the electrogoniometer during the test. However, a visual inspection of the experiment showed us that the patient was moving the leg during the FES exercise.
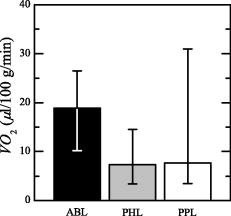
The values obtained by each patient, and the median and quartiles produced by ABL, are reported in Table 4 . For patients P1 and P6, we got inconsistent (negative) values. All the patients except P4 consumed similar amounts of with the paretic and not paretic leg; P4 instead presented a greater for PPL than for PHL. As shown in Fig. 5, the PHL and PPL groups present a greater dispersion of with respect to ABL. The Kruskal Wallis test did not show any significant difference among the three groups. Table 4VO2 obtained during the FES exercise.
3.3.Recovery PhaseThe hemodynamic behavior obtained by each AB subject during the recovery phase is shown in Fig. 6 [ in Fig. 6a, in Fig. 6b, in Fig. 6c, and in Fig. 6d]. It is noticeable that during recovery the right (solid line) and left (dotted line) leg of AB subjects present a similar hemodynamic behavior. The results obtained by the AB subjects at the end of the FES-induced exercise allowed us to define a standard behavior in the four metabolic parameters. An increase of and is associated with a correspondent decrease of , followed by a plateau state for the three parameters. Instead, remained quite stable, especially after the first few seconds of recovery. This behavior is representative of a newly gained metabolic equilibrium. To evaluate the metabolic recovery of patients, the trajectory obtained by each patient during the recovery phase was compared to the normality area (Figs. 7 and 8 ). From a qualitative comparison between the metabolic recovery of patients paretic limbs and the normality areas, it was possible to identify two classes of patients. The first group (called group 1) showed a metabolic trend in the paretic leg similar to the one obtained by the AB subjects [Figs. 7a, 7b, 7c, 7d]. The paretic limb of the second group (called group 2) is completely different from the mean behavior identified on ABL [Figs. 8a, 8b, 8c, 8d]. The , , and measured on the paretic limb of group 2 remained quite stable with the values they have at the end of the FES phase, or they have an opposite trend with respect to the ABL. The end of the exercise is characterized by the absence of blood recruitment in the paretic limb during recovery. It is noteworthy that the behavior of all the healthy legs of the patients in both groups was very similar to the behavior of ABL [Figs. 7e, 7f, 7g, 7h and Figs. 8e, 8f, 8g, 8h]. Fig. 6(a) , (b), , (c), , and (d) obtained by all the AB subjects during the recovery phase are shown. Solid and dotted lines indicate the mean trajectories obtained by the right and left lower limbs, respectively. The bold black line indicates the mean trajectories obtained by AB subjects, and the gray area is the normality area delimited by the quartiles of the AB trajectories. 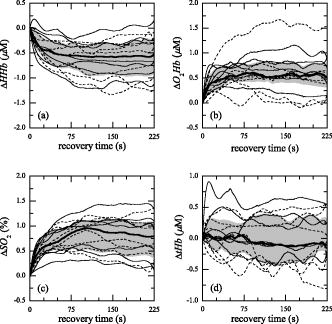 Fig. 7The trajectories of the metabolic indexes [ (a) and (e), (b) and (f), (c) and (g), and (d) and (h)] obtained by group 1 during the recovery phase are compared with the same trajectories obtained by AB subjects. In each panel the gray area is the normality area already defined in Fig. 6.  Fig. 8The trajectories of the metabolic indexes [ (a) and (e), (b) and (f), (c) and (g), and (d) and (h)] obtained by group 2 during the recovery phase are compared with the same trajectories obtained by AB subjects. In each panel the gray area is the normality area already defined in Fig. 6. 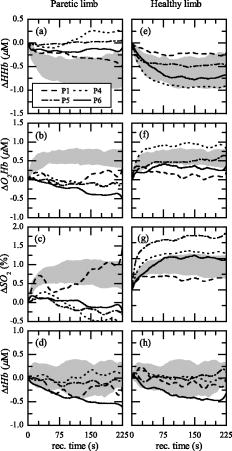 The correlation coefficients obtained between the recovery trajectory measured on each patient and the mean trajectory obtained on AB subjects is reported in Table 5 . Since tHb recovery did not show any significant trend on healthy subjects, we decided that correlation analysis was not significant for tHb. To support the significance of correlation analysis, the median value of the correlation obtained for each healthy subject with respect to the mean trajectory obtained on all the AB subjects was computed. It was 0.91, 0.82, and 0.91 for the deoxygenated, oxygenated hemoglobin, and the oxygen saturation, respectively. Table 5Correlation coefficients (R) computed between the recovery trajectory of ΔHHb , ΔO2Hb , and ΔSO2 obtained by each patient, and the mean recovery trajectories of the ΔHHb , ΔO2Hb , and ΔSO2 obtained by AB subjects. R is reported both for the healthy (PHL) and paretic limb (PPL) and trajectories obtained by the group 1 (high MI) and group 2 (low MI). All the R obtained were significant (p⪡0.01) .
The results confirmed that all the PHL produced a recovery trajectory always similar to the mean curve measured on the AB subjects, because the mean values were always larger than 0.7 except for patient P1. The correlation coefficient obtained for all the PPL of group 1 was always greater than 0.87, implying a behavior similar to the AB group. The correlation coefficient obtained for all the PPL of group 2 was in average 0.08 and often negative (Table 5), implying that PPL of group 2 had the opposite trend of the mean curve obtained on AB subjects. 4.DiscussionAn experimental protocol was developed to analyze the metabolic response measured by TD-NIRS during a knee flex-extension movement induced by FES in age-matched control subjects and postacute stroke patients. The muscular metabolic indexes were analyzed in three different phases of the trials: at rest, i.e., during the initial baseline period, during the FES-induced exercise, and during the final recovery phase. Control subjects showed a very comparable behavior in all the metabolic parameters during the protocol, especially in the recovery phase. In particular, the two limbs did not differ. This is the first outcome of the present work, indicating that the design of the protocol is reliable and repeatable. The existing studies on blood flow and on muscle metabolism at rest on patients with stroke showed conflicting results. Redish 25 observed higher basal blood flow in the paretic limb in comparison to the healthy limb; Goldberg, Skowland, and Katke26 reported no changes between the two sides. A more recent study showed that resting blood flow was significantly reduced in the paretic leg of chronic stroke patients.1 Differences between the results of all these studies can be attributed to the lack of comparability of the patient population analyzed. This is a very common problem when considering patients with stroke. All the patients who participated in our study were in a postacute stage ( after the stroke), and we had no differences among the resting values of HHb, , , and tHb measured on the two legs (Fig. 3). In addition, it could have been expected that muscle temperature is different between the impaired and unimpaired leg, and this could influence the blood flow at rest. It was reported that immediately after ischemic stroke, temperature is frequently elevated in the affecting limb for an undefined period before showing predominant signs of coolness or normothermia.1 However, the baseline conditions are not different in our measures. During the FES-induced exercise, demonstrated to be a parameter unable to differentiate the three groups because of a great dispersion of values. Indeed, the main hypothesis required by the method adopted for the estimation of ,23, 24 i.e., to have a constant tHb, is not completely respected during the induced exercise, because FES does not induce a complete occlusion. The same reason could explain the fact that for P1 and P6, the estimated value of is negative (see Table 4). Indeed, the method used to estimate was not applicable for two patients. The functional performance (knee angle induced by the quadricep stimulation) produced by PPL was always significantly lower than the one produced by PHL and ABL. In addition, a greater fatigue was produced by PPL with respect to both ABL and PHL; indeed, the greatest decrease trend from to was produced by PPL (Fig. 4). This behavior during the exercise implies that though the two groups did not consumed different amounts of to produce the exercise, the PPL showed a less efficient mechanism of muscular excitation/contraction, resulting in a lower knee angle of flex extension and in a greater fatigue effect. This conclusion can be supported by noting that the energy cost can be estimated by , while the produced work is proportional to the knee angle, the anthropometric data being similar for all subjects. The analysis of the , , and during the recovery after the FES exercise showed that the local muscular metabolism of all the healthy limbs of patients was similar to the metabolism of ABL. computed between the mean recovery trajectories of AB subjects and the metabolic trajectory of the healthy limb of each patients was on average greater than 0.58 (Table 5). On the basis of the hemodynamic parameters measured during the recovery phase on the paretic legs, it was possible to identify two classes of patients. Group 1 produced a metabolic trend similar to the one obtained by healthy subjects . The metabolic behavior of group 2 was different from ABL . The behavior of the muscular metabolic parameters measured on the paretic legs seems to be correlated to the patient MI (question 2). Patients of group 1 had a muscular metabolism of the impaired leg similar to the AB one, and all of them are characterized by , which means that they have mostly recovered movement functionality. Instead, the impaired legs of patients in group 2 presented a very low correlation coefficient with AB ones, and in particular, all these patients presented a except for P5. Although he presented a MI equal to 69, he was inserted in group 2 because of his metabolic behavior. This patient has diabetes mellitus, and this could have affected the metabolic results. Therefore, it would be possible to assert that a functional recovery seems to be correspondent to a physiological muscular metabolic regulation. Since we found this difference on the muscular metabolism of the impaired legs of the two groups of patients, we carried out a nonparametric Mann-Whytney-Wilcoxon statistical test between group 1 and group 2 on the following parameters: , , , and , but no significant differences were found. Therefore, it is noteworthy that the two groups of patients moved their knees similarly during the tests; hence the local functionality induced by FES did not vary, though the two groups were functionally different (according to the MI). The fact that only the impaired legs of group 2 have a metabolism different from AB ones suggests that the most functionally impaired patients have no systemic consequences at the muscles, but the problem seems to be local and unilateral (question 1). Before making this deduction a general finding, it has to be confirmed by performing localized measurements of blood flow, which cannot be derived simply by the derivative of the tHb, because this hypothesis is correct only during venous occlusion and this was not the case in our experiments. Localized measurements of blood flow could be crucial to investigate which are the potential mechanisms responsible for the observed unilateral problem. Some previous studies suggest vascular dysfunctions such as enhanced sensitivity to endogenous vasoconstrictor agents,27 changed histochemistry and morphology of the vascular network itself,28, 29 and altered autonomic function.30 However, the relative contribution of each of these factors is still unknown. Furthermore, the unilateral impairment could be due to muscle atrophy,31 but this is typically more frequent in chronic and not in postacute stroke patients. 5.ConclusionsWe develop a noninvasive powerful methodology to monitor hemodynamic response during muscle contraction induced by FES in healthy and stroke subjects. The method proposed in this study seems to be a good tool in the understanding of the muscular metabolic consequences of the stroke. A better investigation is needed, but the use of the NIRS in association with FES can give us a quantitative measure of the local muscle metabolism associated with a fatigue-inducing exercise. For instance, the metabolic indexes during the recovery after an exercise could be used to understand if the functional recovery produced by the rehabilitation and measured by other standard clinical tests such as the MI correspond also to a recovery or reorganization of the metabolic functions. An improved measurement of hemodynamic indexes may lead to better screening, treatment plan, and functional recovery prognosis, as well as to enriched fundamental understanding of muscle function both during voluntary or electrically induced exercises. These preliminary results suggest that it is important to enlarge the study to indude a larger number of stroke patients properly shared according to their muscular functionality to have a more precise metabolic discrimination. Further work is in progress to see if the method could become a tool able to enrich the evaluation criteria of the patient condition before and after rehabilitation, to plan appropriate exercise programs, and to increase the possibility to predict the outcome. ReferencesF. M. Ivey, A. W. Gardner, C. L. Dobrovolny, and R. F. Macko,
“Unilateral impairment of leg blood flow in chronic stroke patients,”
Cerebrovasc Dis., 18 283
–289
(2004). https://doi.org/10.1159/000080353 1015-9770 Google Scholar
F. C. Lem and J. de Vries,
“Transcutaneous oxygen measurement in stroke: circulatory disorder of the affected leg,”
Arch. Phys. Med. Rehabil., 78 998
–1002
(1997). https://doi.org/10.1016/S0003-9993(97)90064-2 0003-9993 Google Scholar
K. Hachisuka, Y. Umezu, and H. Ogata,
“Disuse atrophy of lower limbs in hemiplegic patients,”
Arch. Phys. Med. Rehabil., 78 13
–18
(1997). https://doi.org/10.1016/S0003-9993(97)90003-4 0003-9993 Google Scholar
A. S. Ryan, C. L. Dobrovolny, M. A. Gerald, V. Smith, K. H. Silver, and R. F. Macko,
“Hemiparetic muscle atrophy and increased intramuscular fat in stroke patients,”
Arch. Phys. Med. Rehabil., 83 1703
–1707
(2002). https://doi.org/10.1053/apmr.2002.36399 0003-9993 Google Scholar
M. Popovic, A. Curt, T. Keller, and V. Dietz,
“Functional electrical stimulation for grasping and walking: Indications and limitations,”
Spinal Cord, 39
(8), 403
–412
(2001). https://doi.org/10.1038/sj.sc.3101191 1362-4393 Google Scholar
T. Yan, C. W. Hui-Chan, and L. S. Li,
“FES improves motor recovery of the lower extremity and walking ability of subjects with first acute stroke,”
Stroke, 36
(1), 80
–85
(2005). https://doi.org/10.1161/01.STR.0000149623.24906.63 0039-2499 Google Scholar
M. F. Levin and C. W. Hui-Chan,
“Relief of hemiparetic spasticity by TENS is associated with improvement in reflex and voluntary motor functions,”
Electroencephalogr. Clin. Neurophysiol., 85 131
–142
(1992). https://doi.org/10.1016/0168-5597(92)90079-Q 0013-4649 Google Scholar
R. G. Lee and P. van Donkelaar,
“Mechanisms underlying functional recovery following stroke,”
Can. J. Neurol. Sci., 22 257
–263
(1995). 0317-1671 Google Scholar
L. R. Sheffler and J. Chae,
“Neuromuscular electrical stimulation in neurorehabilitation,”
Muscle Nerve, 35 562
–590
(2007). https://doi.org/10.1002/mus.20758 0148-639X Google Scholar
S. Ferrante, A. Pedrocchi, G. Ferrigno, and F. Molteni,
“Cycling induced by functional electrical stimulation improves the muscular strength and the motor control of individuals with post-acute stroke,”
Muscle Nerve, 44
(2), 159
–67
(2008). 0148-639X Google Scholar
T. Hamaoka, K. K. McCully, V. Quaresima, K. Yamamoto, and B. Chance,
“Near-infrared spectroscopy/imaging for monitoring muscle oxygenation and oxidative metabolism in healthy and diseased humans,”
J. Biomed. Opt., 12
(6), 062105
(2007). https://doi.org/10.1117/1.2805437 1083-3668 Google Scholar
M. Wolf, M. Ferrari, and V. Quaresima,
“Progress of near-infrared spectroscopy and topography for brain and muscle clinical applications,”
J. Biomed. Opt., 12
(6), 062104
(2007). https://doi.org/10.1117/1.2804899 1083-3668 Google Scholar
E. Jigjid, N. Kawashima, H. Ogata, K. Nakazawa, M. Akai, F. Eto, and N. Haga,
“Effects of passive leg movement on the oxygenation level of lower limb muscle in chronic stroke patients,”
Neurorehab. Neural Repair, 22
(1), 40
–49
(2007). https://doi.org/10.1177/1545968307302927 Google Scholar
M. Matteis, F. Vernieri, E. Troisi, P. Pasqualetti, F. Tibuzzi, C. Caltagirone, and M. Silvestrini,
“Early cerebral hemodynamic changes during passive movements and motor recovery after stroke,”
SIAM Rev., 250 810
–817
(2003). 0036-1445 Google Scholar
D. Contini, A. Torricelli, A. Pifferi, L. Spinelli, P. Taroni, V. Quaresima, M. Ferrari, and R. Cubeddu,
“A multi-channel time-resolved system for functional near infrared spectroscopy,”
Opt. Express, 14 5418
–5432
(2006). https://doi.org/10.1364/OE.14.005418 1094-4087 Google Scholar
D. Contini, F. Martelli, and G. Zaccanti,
“Photon migration through a turbid slab described by a model based on diffusion approximation. I. Theory,”
Appl. Opt., 36
(19), 4587
–4599
(1997). https://doi.org/10.1364/AO.36.004587 0003-6935 Google Scholar
D. Contini, A. Torricelli, A. Pifferi, L. Spinelli, and R. Cubeddu,
“Novel method for depth-resolved brain functional imaging by time-domain NIRS,”
Proc. SPIE, 6629 662908
(2007). https://doi.org/10.1117/12.728104 0277-786X Google Scholar
R. S. Richardson, E. A. Noyszewski, B. Saltin, and J. Gonzalez-Alonso,
“Effect of mild carboxy-hemoglobin on exercising skeletal muscle: intravascular and intracellular evidence,”
Am. J. Physiol., 283 R1131
–R1139
(2002). 0002-9513 Google Scholar
V. Quaresima, M. Ferrari, M. A. Franceschini, M. L. Hoimes, and S. Fantini,
“Spatial distribution of vastus lateralis blood flow and oxy-hemoglobin saturation measured at the end of isometric quadriceps contraction by multichannel near-infrared spectroscopy,”
J. Biomed. Opt., 9
(2), 413
–420
(2004). https://doi.org/10.1117/1.1646417 1083-3668 Google Scholar
R. W. Bohannon and M. B. Smith,
“Inter-rater reliability of a modified Ashworth scale of muscle spasticity,”
Phys. Ther., 67 206
–207
(1987). 0031-9023 Google Scholar
F. Franchignoni, L. Tesio, E. Benevolo, and M. Ottonello,
“Psychometric properties of the Rivermead Mobility Index in Italian stroke rehabilitation inpatients,”
Clin. Rehabil., 17
(3), 273
–282
(2003). https://doi.org/10.1191/0269215503cr608oa 0269-2155 Google Scholar
V. Quaresima, W. N. J. M. Colier, M. van der Sluijs, and M. Ferrari,
“Nonuniform quadriceps consumption revealed by near infrared multipoint measurements,”
Biochem. Biophys. Res. Commun., 285 1034
–1039
(2001). https://doi.org/10.1006/bbrc.2001.5292 0006-291X Google Scholar
T. Binzoni, V. Quaresima, G. Barattelli, E. Hiltbrand, L. Gürke, F. Terrier, P. Cerretelli, and M. Ferrari,
“Energy metabolism and interstitial fluid displacement in human gastrocnemius during short ischemic cycles,”
J. Appl. Physiol., 85 1244
–1251
(1998). 8750-7587 Google Scholar
W. Redish, F. T. Tangeo, L. Wertheimer, L. G. Lewis, and J. M. Steele,
“Vasomotor responses in the extremities of subjects with various neurologic lesions,”
Circulation, 15 518
–524
(1957). 0009-7322 Google Scholar
M. J. Goldberg, H. V. Skowland, and F. J. Katke,
“Comparison of circulation in the lower extremities of hemiplegic patients,”
Arch. Phys. Med. Rehabil., 49 467
–470
(1968). 0003-9993 Google Scholar
R. Bevan, A. Clemenson, E. Joyce, and J. Bevan,
“Sympathetic denervation of resistance arteries increases contraction and decreases relaxation to flow,”
Am. J. Physiol., 264 H490
–494
(1993). 0002-9513 Google Scholar
P. Kozak,
“Circulatory changes of the paretic extremities after acute anterior poliomyelitis,”
Arch. Phys. Med. Rehabil., 49 77
–81
(1968). 0003-9993 Google Scholar
R. E. M. Bowden and E. Gutman,
“Thickening of artery walls and obliteration of capillaries by connective tissue proliferation,”
Brain, 67
–273
(1944). 0006-8950 Google Scholar
A. G. Herbaut, J. D. Cole, and E. M. Sedgwick,
“A cerebral hemisphere influence on the cutaneous vasomotor reflexes in humans,”
Semicond. Insul., 53 118
–120
(1990). 0309-5991 Google Scholar
S. Landin, L. Hagenfeldt, B. Saltin, and J. Wahren,
“Muscle metabolism during exercise in hemiparetic patients,”
Clin. Sci. Mol. Med., 53 257
–269
(1977). 0301-0538 Google Scholar
|
|||||||||||||||||||||||||||||||||||||||||||||||||||||||||||||||||||||||||||||||||||||||||||||||||||||||||||||||||||||||||||||||||||||||||||||||||||||||||||||||||||||||||||||||||||||||||||||||||||||||||||||||||||||||||||||||||||||||||||||||||||||||||||||||||||||||||||||||||||||||||||||||||||||||||||||||||||||||||||||||||||||||||||||||||||||||||||||||||||||||||||||||||||||||||||||||||||||||||||||||||||||||||||||||||||||||||||||||||||||||||||||||