
|
|
1.IntroductionLight enters a human eye through four main components: the cornea, aqueous humor, lens, and vitreous humor, and then finally arrives at the retina. Covering the front of the eye, the cornea is a transparent and dome-shaped window. It functions as an optical lens for controlling and focusing the entry of light into the eye, and contributes 65% to 75% of the eye’s focusing power. Morphologically, the cornea can be roughly divided into three layers, including the corneal epithelium, corneal stroma, and corneal endothelium, and each layer has significance for maintaining the transparency of the cornea and healthy vision. Any structural changes of these three layers, for example, keratoconus (thinning of the cornea), lattice dystrophy (structural disorders of the stroma and epithelium), and endothelial dystrophy (Fuch’s dystrophy; loss of the endothelial cells), may result in the cornea becoming opaque and can lead to serious loss of vision. Therefore, the structural information of the cornea plays an important role for both biomedical studies and disease diagnosis of the cornea. Especially early diagnosis and regular examination of corneal pathological changes can help the prevention and treatment of some hereditary and chronic corneal diseases. Since a biopsy cannot be used for corneal diagnosis, the techniques able to investigate the structural changes of the cornea with a high 3-D resolution in vivo are strongly required for clinical applications. For corneal diagnosis, optical microscopies such as an ophthalmoscope,1 slit lamp,2 optical coherence tomography (OCT),3, 4 confocal microscopy,5, 6, 7 two-photon fluorescence (TPF),8, 9 and second harmonic generation (SHG)10, 11 have been developed and applied, but each technique has its advantages and limitations. The ophthalmoscope, slit lamp, and OCT can provide high penetrability (able to approach the retina) under low energy illuminations, but they are limited by poor resolution. With a confocal pinhole inserted, the spatial resolution of the confocal microscopy can be greatly improved to laterally and axially,12 but some information such as collagenous structures in the stroma cannot be provided. In nonlinear optical microscopy, two-photon microscopy makes use of the intrinsic fluorophores NAD(P)H/NAD(P)13 in cells and can give the cellular signals of corneal tissues. SHG microscopy, which is highly sensitive to collagen fibers,14, 15, 16 can provide the ability for investigating the corneal stroma17 composed of mainly type-1 collagen. Due to the nonlinear excitation, most TPF and SHG signals are limited to the focal spot, and optical sectioning with submicron lateral resolution can be achieved with reduced off-focus photodamages. In ophthalmology, nonlinear optical microscopy has many advantages for in-vivo investigation and is worth developing for clinical diagnosis. Since the eye is responsible for vision, the retina is most sensitive to visible light in the wavelength range of . However, even beyond this range, the visual threshold was known to be extended into the near infrared, and the retina is also sensitive to light in the wavelength range of .18 The ocular components in front of the retina (cornea, aqueous humor, lens, and vitreous humor) all have high transmittance within . Therefore, the excitation light sources within may affect or damage the retina, and the issue of retina safety has to be concerned and involved in in-vivo corneal imaging. For example, an incoherent halogen lamp19 and a red wavelength diode laser12 were previously used for confocal reflection and laser scanning confocal microscopy, respectively, while a laser excitation has been popular for TPF and SHG microscopy.13 These excitation light sources are all in the range of retina sensitivity. To improve retina safety and preserve imaging penetrability at the same time, a light source beyond this range and with compromised transmittance in the ocular tissues in front of the retina is more appropriate. We report our study of the nonlinear optical corneal imaging by using a femtosecond light source. Both submicron resolution and reduced off-focus photodamages due to nonlinear excitation could be obtained in our study. Under this long wavelength excitation, only a few weak autofluorescence signals could be found around the anterior corneal surface, while abundant higher harmonic generation signals could be observed in both the cornea and the lens. With epi-third harmonic generation (epi-THG) signals, an imaging depth greater than in an intact mouse eye could be achieved, while high spatial resolution could also be preserved due to high nonlinearity.20, 21 Our study shows that epi-THG has the ability to reveal the lateral cellular morphology and axial structure of the cornea, and could be used for the physiological studies and potential diagnosis of the corneal diseases like keratoconus and endothelial dystrophy. On the other hand, the combination with epi-SHG microscopy also provides the potential for diagnosing the collagenous pathological changes of the corneal stroma such as lattice dystrophy. Since harmonic generation obeys energy conservation, no energy would be deposited on the interacted samples, and no photodamage would be induced during the harmonic generation process.22 This study gives much valuable information on IR-based nonlinear optical imaging on the normal cornea, and also indicates the potential of our system for future corneal diagnosis. 2.MethodsWe applied the internally designed epi-higher harmonic generation microscope23 [Fig. 1a ] to image an intact mouse eye with a total thickness of . A femtosecond laser with a central wavelength of was internally built and pumped by a commercial cw laser (Spectra-Physics, Millennia IR). The laser beam was collimated and guided into a scanning system (FV300, Olympus) connected with an upright microscope (BX51, Olympus). After passing through a pair of galvanometer mirrors in the scanning system, the scanning beam was focused to the mouse eye by a working-distance water-immersion objective with a NA of 0.9. The average power measured right after the objective without immersion media was . An intact excised mouse eye was set with the anterior corneal surface upward to the objective and immerged in a container filled with normal saline, which accounted for both the immersion media of the objective and for keeping the eye moist [Fig. 1b]. The SHG and THG signals were epi-collected by the same objective and reflected by a dichroic beamsplitter (865dcxru, Chroma). Another dichroic beamsplitter (490dcxr, Chroma) was used to separate epi-THG and epi-SHG signals. Epi-THG and epi-SHG were sent to two individual photomultipliers (PMTs) with bandpass filters inserted (HQ615/30X for SHG and D410/30 for THG). With computer processing, both epi-SHG and epi-THG images could be obtained. In the following paragraphs, THG and SHG will be used to represent epi-collected THG and SHG instead of epi-THG and epi-SHG. Fig. 1(a) The scheme of the infrared-based epi-harmonics generation microscope (HGM) system. The system was adapted from a scanning unit (FV 300, Olympus) combined with an inverted microscope (IX71, Olympus). An infrared femtosecond Cr:forsterite laser with a central wavelength of was used for excitation. DBS: dichroic beamsplitter CF: color filter, BF: bandpass filter, PMT: photomultiplier tube. (b) The scheme of epi-collection of the backward SHG and THG signals, and the mounting of the mouse eye. The mouse eye was mounted in a container with the anterior corneal surface upward to the objective. The container was filled with normal saline, accounting for both buffer and immersion media.  In our study, mice were sacrificed and the mouse eyes freshly harvested. This experiment was approved by the Institutional Animal Care and Use Committee of National Taiwan University Hospital. The intact mouse eyes were kept under in 4% paraformaldehyde, and the observation was carried out within one week. Throughout this study, 20 mouse eyes have been observed and similar results have been obtained from these mouse eyes. In this work, only the representative images are shown. During observation, the mouse eye was taken out of the refrigerator and immerged in a container filled with normal saline, which was responsible for both buffer and immersion media. The duration of the observation of one mouse eye was about half an hour, and the temperature of the environment was kept around . After one observation, the same mouse eye was not imaged a second time. 3.Results and Discussion3.1.Selection of the Excitation Laser SourceIn previous studies,24, 25 the transmission spectra of each ocular component of the human eye was measured. Table 1 shows the measured transmission characteristic at three wavelengths: 800, 1030, and . The average thicknesses of the human cornea, aqueous humor, lens, and vitreous humor are 0.5, 3.0, 3.2, and ,24 respectively. At , the transmittance of each component is higher than 95% and the total transmittance through the ocular components in front of the retina runs to about 85%. The total transmittance decreases to 38% at and drops greatly to only 9% at due to the stronger water absorption. According to the previous measurement,26 the water absorption coefficients at 800, 1030, and , are 0.0207, 0.1845, and , respectively. Before arriving at the retina of a human eye, most of the light energy will be absorbed by the -thick vitreous humor, which is mainly composed of water. This indicates that to increase retina safety, an infrared (IR) excitation source with a wavelength around the order of or slightly longer would be a better choice, because the light penetrating the retina will be diminished, while the imaging depth will still be deep enough for imaging of the cornea. Table 1The transmittance of each ocular component, including cornea, aqueous, lens, and vitreous, and the total transmittance through the entire human eye at 800, 1030, and 1230nm .
3.2.Two-Photon Fluorescence, Second Harmonic Generation, and Third Harmonic Generation Signal Intensity Measured in the Mouse CorneaPopularly used confocal and TPF microscopies make use of the intrinsic fluorophores NAD(P)H/NAD(P) in cells to obtain the cellular morphological information of corneal tissues. Under IR excitation, most of the autofluorescence would be suppressed,27 including the autofluorescence from NAD(P)H/NAD(P). Only weak TPF signals could be observed within beneath the anterior corneal surface, but abundant SHG and THG could be found in the cornea and the lens. To investigate the relative intensities of the backward-collected SHG, THG, and TPF signals at different depths underneath the anterior corneal surface, a charge-coupled device (CCD) spectrometer was used to obtain the spectrum with range from [Fig. 2a ]. Within this range, THG , SHG , and TPF (peaked at ) signals could all be measured. The measured peak intensities of the SHG, THG, and 2PF signals were plotted in Fig. 2b versus the depth beneath the anterior corneal surface. In a mouse eye [Fig. 2c], the average thickness of the cornea C and the aqueous humor (AH) is about 160 and , and the anterior surface of the lens is at beneath the corneal surface. The thickness of each component would change in different mouse eyes. As shown in Fig. 2b, strong THG intensity was measured within (cornea) and at (the anterior part of the lens), and was hundreds of times higher than TPF signals. Within the whole depth of imaging, TPF signals were too weak to be used for imaging, and thus only SHG and THG images are shown and discussed in this work. Instead of TPF, THG, which has structural sensitivity,28, 29 could be useful for revealing the cellular structure of both the cornea and the lens with no energy deposition and no photodamage. Fig. 2(a) The -excited spectrum of the cornea of an intact mouse eye was measured by a CCD spectrometer. Within a range from , the epi-collected THG , SHG , and autofluorescence (peaked at ) were all included. (b) The peak intensity of THG, SHG, and TPF at different depths beneath the anterior corneal surface of a mouse eye was measured and plotted versus the depth. The measured regions included the cornea (C, ), aqueous humor (AH, ), and lens (L, ). Within the measured regions except for the AH with no imaging contrast, only weak TPF signals were found around the anterior surface of the cornea, and the intensity of THG signals was measured to be hundreds of times higher than that of TPF signals. SHG signals were also more abundant than TPF signals in the cornea, especial in the corneal stroma. (c) The scheme of the mouse eye was shown as a reference for indicating the thickness of the cornea (C) and aqueous humor (AH), as well as the position of the lens (L). 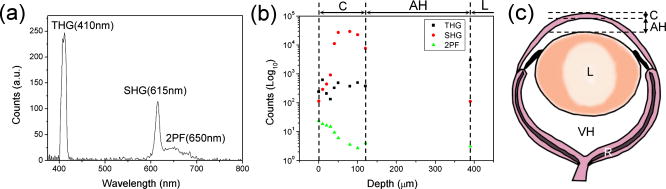 3.3.Third Harmonic Generation Imaging of the Mouse EyeAccording to the histological results of the cornea,30, 31 the scheme of the mouse eye and the structures of the cornea and the lens are shown in Fig. 3a . The cornea can be roughly divided into three main components: the corneal epithelium (EP), corneal stroma (CS), and corneal endothelium (ED). The EP and ED are cellular layers, and the CS between them is composed of connective tissues. The EP covers the anterior surface of the cornea and is only 5 to 6 cell layers thick. The EP cells of the superficial layer (close to the anterior surface of the cornea) are squamous and their nuclei are flattened with a larger diameter. The EP cells of deeper layers are columnar and their nuclei are globular with a smaller diameter. On the other hand, the ED is a monolayer of flattened and polygonal ED cells. They line the posterior surface of the cornea and play an important role for governing the fluid and solute transport across the posterior surface of the cornea. Loss of the ED cells (endothelial dystrophy) can lead to loss of corneal transparency, and an imaging tool with high sectioning power to resolve this thin layer is required for diagnosis. Between these two layers is the CS, consisting of hundreds of layers of regularly arranged collagen fibers along with sparsely populated keratocytes [arrows in Fig. 3a]. For transparency, the collagen fibers run parallel in the same layer but have a lattice arrangement within different layers. Beneath the cornea is the aqueous humor (AH), mainly composed of water and followed by the lens (L). The lens consists of three main parts: the lens capsule (LC), lens epithelium (LE), and lens fibers (LF). The membrane-like LC forms the outermost layer of the lens and completely surrounds the lens. The cellular LE is located in the anterior part of the lens between the LC and the LF, which forms the bulk of the lens, and can generate new lens fibers. Fig. 3(a) The scheme of the mouse eye (middle scheme), the axial structure of the cornea (top enlarged scheme), and the lens (bottom enlarged scheme). As shown in the axial structures of the cornea and lens, the cornea can be roughly divided into the corneal epithelium (EP), corneal stroma (CS), and corneal endothelium (ED), while the lens consists of the lens capsule (LC), lens epithelium (LE), and lens fiber (LF). The imaging plans of (b) through (g) were indicated in (a). (b) through (g) THG images of the ocular tissues of a mouse eye obtained at different depths of (b) 10, (c) 25, (d) 40, (e) 100, (f) 120, and (g) beneath the anterior corneal surface. (b) The squamous and flattened EP cells were revealed with a larger average ND and IND . (c) The transition shape of the EP cells from squamous to columnar shape was shown with a smaller average ND and IND . (d) The columnar EP cells at the bottom of the EP were revealed with a small average IND close to the average ND . (e) shows the THG image of the CS, where both the boundaries of the collagen fibers and the keratocytes in the CS were found. (f) The uniformly sized polygonal ED cells were observed in the monolayer ED. The nuclei of the ED cells are indicated by arrowheads. (g) At a depth of , the lens fibers with a width of (along the arrow) can still be highly resolved through THG signals. THG is represented by a purple pseudocolor. Scale bar: . (Color online only.)  Figures 3b, 3c, 3d, 3e, 3f, 3g show the THG images of the ocular tissues obtained at different depths beneath the anterior corneal surface. The imaging plan of each image is indicated in Fig. 3a. From these THG images, the morphology of the EP cells was successfully revealed at depths of 10, 25, and [Figs. 3b, 3c, 3d], and the results were consistent with the histology results described in the former paragraph.31 Based on the THG contrast arising from the cytoplasmic organelles,32 the cytoplasm of the EP cells appeared bright in contrast to the dark nuclei. At [Fig. 3b], the squamous and flattened shape of the EP cells could be revealed through both the larger average nuclear diameter (ND) and the longer average internuclear distance (IND) , which indicated the larger diameter of the cells. At [Fig. 3c], the nuclei were shown to have a smaller average ND of , and the average IND of indicated the transition shape of the cells from squamous to columnar shape. At [Fig. 3d], the bottom of the epithelium, the columnar shape of the EP cells was revealed through a smaller average IND of , which was quite close to the ND of . Figure 3e shows the THG image of the CS at a depth of . In the CS, much information can be obtained through THG signals. As mentioned before, there are collagen fibers, and the keratocytes exist in the CS. Based on the THG contrast arising from interfaces33, 34 and cytoplasmic organelles,32 not only the boundaries of the collagen fibers but also the keratocytes could be revealed in Fig. 3e. Beneath the CS, Fig. 3f shows the THG image of the ED at , and the uniformly sized polygonal cells in this monolayer could be revealed. The nuclei of the endothelial cells appear dark [arrowheads in Fig. 3f], while the cytoplasm appear bright. Passing through the AH with no THG contrast, at a depth of beneath the anterior corneal surface, the lens fibers [Fig. 3g] with a width of [along the arrow in Fig. 3g] could be highly resolved through THG signals. Moreover, it is important to notice that we did not observe significant SHG signals from the lens fibers. To show the details more clearly, some contrast adjustments have been applied to the original images, which were obtained with the same PMT voltage, and the actual intensity of the THG contrast at different depths could be found in Fig. 2b. Although the attenuation coefficient of the excitation light in the cornea, lens, and the AH is about ,20 ,20 and (water absorption coefficient),22 the THG intensity kept around the same order within the cornea and the THG intensity was ten times stronger in the lens [Fig. 2b]. Even at a depth slightly greater than , the structure of the lens fibers could still be revealed through THG, but the higher PMT voltage and the contrast adjustment were needed. Since the total thickness of the human cornea is about ,35 a penetration depth greater than indicates the ability to investigate even the deepest part of the human cornea. 3.4.Multimodality (Second and Third Harmonic Generation) Imaging of the Mouse EyeThe corneal stroma consists of hundreds of layers of regularly organized collagen fibers, including mainly type-1 collagen, but also types 3, 5, and 6.36 Accounting for the transparency of the cornea, the collagen fibers run parallel to each other but at large angles to the fibers in the next layer.36 Since SHG is highly sensitive to collagen fibers, especially type-1 collagen,13, 14, 15 the arrangement of collagen fibers in the stroma were expected to be revealed by SHG microscopy. As shown in the SHG and THG images of the CS [Figs. 4a and 4b ], in addition to the collagenous structure of the CS shown by SHG as expected, some more information can be given by THG. Combining Figs. 4a and 4b together to form Fig. 4c, it can be found that THG and SHG would overlap in some regions [shown white in Fig. 4c] but not overlap in other regions. As mentioned in the former paragraph and has been confirmed by transmission THG microscopy (not shown), THG contrast in the CS is dominated by the boundary of the collagen fibers and the keratocytes. Since the collagen fibers have SHG contrast, the colocalized THG signals can be easily distinguished while the combined color will appear white, as shown in Fig. 4c. Taking advantage of the combined SHG and THG modality, the keratocytes can thus be easily identified with their pure THG color, together with size and shape characteristics. Figure 4d shows the scheme of the mouse eye as a reference, and an optical axial section, including SHG and THG signals [Fig. 4e], was obtained in the region indicated by square in Fig. 4d. The total depth of Fig. 4e is . No adjustments of the PMT voltage and contrast have been applied within the whole imaging depth. The axial structure of both the cornea (C), including EP, CS, and ED, and the lens (L), including LC, LE, and LF, could both be resolved in this axial section. It indicates a high penetrability of and a high axial sectioning power of our IR-based harmonic generation microscopic imaging of the ocular tissues. Fig. 4(a) SHG, (b) THG, and (c) image of the corneal stroma. (a) SHG revealed the collagenous characteristic of the corneal stroma, which is mainly composed of type-1 collagens fibers. (b) THG arose from both the boundaries of the collagen fibers and the keratocytes, which were difficult to distinguish. (c) THG and SHG would overlap in some regions (shown white) but not in other regions. Since the THG signals from collagen fibers would mostly overlap the SHG signals (shown in white), the THG signals from keratocytes (arrows) could be distinguished. (c) shows the scheme of a mouse eye as a reference and the square indicates the imaging region of (d). (d) shows the axial section of the ocular tissues with a depth of . Without any adjustments of the PMT voltage and contrast, a penetration depth of could be easily achieved. Each layer of the cornea (EP, CS, and ED) and the anterior part of the lens (LC, LE, and LF) were revealed with a high axial resolution. SHG and THG are represented by green and purple pseudocolors, respectively. Scale bar: (a), (b), and (c) ; (e) .  3.5.Axial Structures Revealed with a Lateral ResolutionBased on penetrability, we moved the imaging plane to beneath the anterior corneal surface [dashed arrow in Fig. 5a ]. At this depth, an intact mouse eye is optically sectioned with a total lateral diameter of , as shown in Fig. 5b. As indicated in Fig. 5a, the intact mouse eye is sectioned with the lens in the center, and surrounding the lens is the aqueous humor (AH) and then the cornea (C). Enlarged from the squared area in Fig. 5b, due to the spherical shape of the eye, the axial structure instead of the lateral structure of the cornea is revealed by THG with a submicron lateral resolution [Fig. 5c]. Comparing Fig. 5c with Fig. 4e, both the EP cells and the fibers of the CS in Fig. 5c were shown more distinctly with higher resolution than those in Fig. 4e. In addition, enlarged from the squared area in Fig. 5b, the axial structure of the lens, including the lens capsule (arrow), lens fibers (arrowhead), and the lens epithelium (star), can all be resolved by the THG signals [Fig. 5d]. Fig. 5(a) shows the scheme of a mouse eye to indicate the imaging plan of (b) (dashed arrow), the optical axis of the eye (dashed line), and the different incident angles [ , gray arrow; , black arrow in (a)]. (b) A lateral section of an intact mouse eye obtained at a depth of beneath the anterior corneal surface. The intact mouse eye was optically sectioned with a lateral diameter of . As indicated in (a), the mouse eye would be sectioned with the lens in the center, and surrounding the lens was the aqueous humor (AH) and then the cornea (C). (c) The THG image enlarged from the squared area in (b). Due to the spherical shape of the eye, the axial structure of the cornea would be revealed with a submicron lateral resolution in this lateral section. (d) The THG image enlarged from the squared area in (b). The axial structure of the lens, including the lens capsule (arrow), lens fibers (arrowhead), and the lens epithelium (star), could all be resolved by THG. Scale bar: (b) ; (c) and (d) .  Generally, including our previously discussed studies, the microscopies used for corneal diagnosis have a normal incident excitation [gray arrow in Fig. 5a], which means that the incident angle relative to the optical axis of the eye is , and the excitation light will go straight to the retina. If the incident angle of the excitation light can be increased to around [black arrow in Fig. 5a, an incident angle of ], the percent of the excitation light going to retina will be greatly reduced and retina safety will be improved as well. Due to the dome shape of the cornea, with a larger incident angle, the axial structure instead of the lateral structure of the cornea will be revealed in the lateral sections with a submicron lateral resolution, as shown in Fig. 5c. Using a excitation light would be the first step to increase both eye safety and penetrability in ophthalmological study. To further improve retina safety for future IR diagnosis of the human cornea, not only a larger laser incident angle but a slightly longer illumination wavelength (not longer than ) and a lower excitation power, will be desired. Although THG intensity will decrease with a lower excitation power, the decreased THG contrast may be recovered by shortening the pulse width to increase the peak intensity of a single laser pulse. 4.ConclusionIn conclusion, early diagnosis and regular examination of pathological changes of the cornea are important for the prevention and treatment of some corneal diseases. The structural information of the cornea plays an important role for both the biomedical studies and the diagnosis of the corneal diseases. To investigate in vivo the structural changes of the cornea with a high 3-D resolution and improved retina safety, a nonlinear optical microscope with an excitation light beyond the range of retina sensitivity would be appropriate. In this work, nonlinear optical microscopic imaging of an intact mouse eye with an IR laser source with a central wavelength of is demonstrated. Our study indicated that under femtosecond excitation, most autofluorescences would be suppressed and only a few weak TPF signals can found around the anterior surface of the cornea. Instead of TPF, the abundant THG signals would be useful to reveal the cellular morphology of the cornea and lens. Through THG signals, an imaging depth greater than in an intact mouse eye could be achieved with a preserved high spatial resolution due to high third order nonlinearity. This penetrability is enough to image the human cornea with an average thickness of . The combination with SHG also provides the ability for revealing the collagenous structures in the corneal stroma. In addition to the lateral cellular morphology, this study also demonstrates the ability to show the axial structure of the cornea with a lateral submicron resolution, which indicates the possibility to investigate the cornea with a larger incident angle for increasing retina safety. Due to nonlinear excitation, submicron spatial resolution and reduced off-focus photodamage can both be achieved, and different from TPF, harmonic generation would have no energy deposition or photodamage. The valuable structural information provided by the IR-based SHG and THG imaging of the normal cornea shows the potential of our system for biological studies and corneal diagnosis such as keratoconus, lattice dystrophy, and endothelial dystrophy. To achieve the goal of IR-based corneal diagnosis, more investigations of the abnormal cornea will need to be performed in the future. AcknowledgmentsThis research is sponsored by the National Health Research Institute of Taiwan (NHRI-EX97-9201EI), National Taiwan University Research Center for Medical Excellence, and NTU grant 97R0036-01. ReferencesH. Ridley,
“Recent methods of fundus examination including electronic ophthalmoscopy,”
Trans. Ophthalmol. Soc. U. K., 72 497
–509
(1952). 0078-5334 Google Scholar
G. W. Tate Jr. and A. Safir,
“The slit lamp: history, principles, and practice,”
Duane’s Clinical Ophthalmology,
(1991) Google Scholar
J. G. Fujimoto, C. Pitris, S. A. Boppart, and M. E. Brezinski,
“Optical coherence tomography: an emerging technology for biomedical imaging and optical biopsy,”
Neoplasia, 2 9
–25
(2000). https://doi.org/10.1038/sj.neo.7900071 1522-8002 Google Scholar
A. F. Fercher, W. Drexler, C. K. Hizenberger, and T. Lasser,
“Optical coherence tomography: principles and applications,”
Rep. Prog. Phys., 66 239
–303
(2003). https://doi.org/10.1088/0034-4885/66/2/204 0034-4885 Google Scholar
T. Tervo and J. Moilanen,
“In vivo confocal microscopy for evaluation of wound healing following corneal refractive surgery,”
Prog. Retin Eye Res., 22 339
–358
(2003). https://doi.org/10.1016/S1350-9462(02)00064-2 1350-9462 Google Scholar
S. C. Kaufman and H. E. Kaufman,
“How has confocal microscopy helped us in refractive surgery,”
Curr. Opin. Ophthalmol., 17 380
–388
(2006). https://doi.org/10.1097/01.icu.0000233959.73262.99 Google Scholar
J. S. Dhaliwal, S. C. Kaufman, and A. G. Y. Chiou,
“Current applications of clinical confocal microscopy,”
Curr. Opin. Ophthalmol., 18 300
–307
(2007). https://doi.org/10.1097/ICU.0b013e3281b11665 Google Scholar
Y. Imanishi, K. H. Lodowski, and Y. Koutalos,
“Two-photon microscopy: shedding light on the chemistry of vision,”
Biochemistry, 46 9674
–9684
(2007). https://doi.org/10.1021/bi701055g 0006-2960 Google Scholar
H. Y. Tan, Y. Sun, W. Lo, S. J. Lin, C. H. Hsiao, Y. F. Chen, S. C. M. Huang, W. C. Lin, S. H. Jee, H. S. Yu, and C. Y. Dong,
“Multiphoton fluorescence and second harmonic generation imaging of the structural alterations in keratoconus ex vivo,”
Invest. Ophthalmol. Visual Sci., 47 5251
–5259
(2006). https://doi.org/10.1167/iovs.06-0386 0146-0404 Google Scholar
N. Morishige, A. J. Wahlert, M. C. Kenney, D. J. Brown, K. Kawamoto, T. Chikama, T. Nishida, and J. V. Jester,
“Second-harmonic imaging microscopy of normal human and keratoconus cornea,”
Invest. Ophthalmol. Visual Sci., 48 1087
–1094
(2007). https://doi.org/10.1167/iovs.06-1177 0146-0404 Google Scholar
M. Han, L. Zickler, G. Giese, M. Walter, F. H. Loesel, and J. F. Bille,
“Second-harmonic imaging of cornea after intrastromal femtosecond laser ablation,”
J. Biomed. Opt., 9
(4), 760
–766
(2004). https://doi.org/10.1117/1.1756919 1083-3668 Google Scholar
R. L. Niederer, D. Perumal, T. Sherwin, and C. N. J. McGhee,
“Age-related differences in the normal human cornea: a laser scanning in vivo confocal microscopy study,”
Br. J. Ophthamol., 91 1165
–1169
(2007). https://doi.org/10.1136/bjo.2006.112656 0007-1161 Google Scholar
B. G. Wang, I. Riemann, H. Schubert, D. Schweitzer, K. Konig, and K. J. Halbhuber,
“Multiphoton microscopy for monitoring intratissue femtosecond laser surgery effects,”
Lasers Surg. Med., 39 527
–533
(2007). https://doi.org/10.1002/lsm.20523 0196-8092 Google Scholar
C. K. Sun,
“Higher harmonic generation microscopy,”
Adv. Biochem. Eng./Biotechnol., 95 17
–56
(2005). 0724-6145 Google Scholar
P. J. Campagnola and L. M. Loew,
“Second-harmonic imaging microscopy for visualizing biomolecular arrays in cells, tissues and organisms,”
Nat. Biotechnol., 21 1356
–1360
(2003). https://doi.org/10.1038/nbt894 1087-0156 Google Scholar
G. Cox, F. Manconi and E. Kable,
“Second harmonic imaging of collagen in mammalian tissue,”
Proc. SPIE, 4620 148
–156
(2002). https://doi.org/10.1117/12.470689 0277-786X Google Scholar
R. W. Beuerman and L. Pedroza,
“Ultrastructure of the human cornea,”
Microsc. Res. Tech., 33 320
–335
(1996). https://doi.org/10.1002/(SICI)1097-0029(19960301)33:4<320::AID-JEMT3>3.0.CO;2-T 1059-910X Google Scholar
C. F. Goodeve,
“Relative luminosity in the extreme red,”
Proc. R. Soc. London, Ser. A, A155 664
–683
(1936). 1364-5021 Google Scholar
B. R. Masters and M. Bohnke,
“Confocal microscopy of the human cornea in vivo,”
Int. Ophthalmol., 23 199
–206
(2001). https://doi.org/10.1023/A:1014428514148 0165-5701 Google Scholar
P. J. Campagnola, A. C. Millard, M. Terasaki, P. E. Hoppe, C. J. Malone, and W. A. Mohler,
“Three-dimensional high-resolution second harmonic generation imaging of endogenous structural proteins in biological tissues,”
Biophys. J., 82 493
–508
(2002). https://doi.org/10.1016/S0006-3495(02)75414-3 0006-3495 Google Scholar
T. H. Tsai, S. P. Tai, W. J. Lee, H. Y. Huang, Y. H. Liao, and C. K. Sun,
“Optical signal degradation study in fixed human skin using confocal microscopy and higher-harmonic optical microscopy,”
Opt. Express, 14 749
–758
(2006). https://doi.org/10.1364/OPEX.14.000749 1094-4087 Google Scholar
C. K. Sun, S. W. Chu, S. Y. Chen, T. H. Tsai, T. M. Liu, C. Y. Lin, and H. J. Tsai,
“Higher harmonic generation microscopy for developmental biology,”
J. Struct. Biol., 147 19
–30
(2004). https://doi.org/10.1016/j.jsb.2003.10.017 1047-8477 Google Scholar
S. Y. Chen, C. Y. S. Hsu, and C. K. Sun,
“Epi-third and second harmonic generation microscopic imaging of abnormal enamel,”
Opt. Express, 16 11670
–11679
(2008). 1094-4087 Google Scholar
E. A. Boettner and J. R. Wolter,
“Transmission of the ocular media,”
Invest. Ophthalmol., 1 776
–783
(1962). 0020-9988 Google Scholar
W. J. Geeraets and E. R. Berry,
“Ocular spectral characteristics as related to hazards from lasers and other light sources,”
Am. J. Ophthalmol., 64 15
–20
(1968). 0002-9394 Google Scholar
T. J. T. P. van den Berg and H. Spekreijse,
“Near infrared light absorption in the human eye media,”
Vision Res., 37 249
–253
(1997). https://doi.org/10.1016/S0042-6989(96)00120-4 0042-6989 Google Scholar
S. W. Chu, I. H. Chen, T. M. Liu, P. C. Chen, B. L. Lin, and C. K. Sun,
“Multimodal nonlinear spectral microscopy based on a femtosecond Cr:forsterite laser,”
Opt. Lett., 26 1909
–1911
(2001). https://doi.org/10.1364/OL.26.001909 0146-9592 Google Scholar
S. W. Chu, S. Y. Chen, T. H. Tsai, T. M. Liu, C. Y. Lin, H. J. Tsai, and C. K. Sun,
“In vivo developmental biology study using noninvasive multi-harmonic generation microscopy,”
Opt. Express, 11 3093
–3099
(2003). 1094-4087 Google Scholar
D. Yelin and Y. Silberberg,
“Laser scanning third-harmonic-generation microscopy in biology,”
Opt. Express, 5 169
–175
(1999). 1094-4087 Google Scholar
D. M. Maurice,
“The cornea and sclera,”
The Eye, 3rd ed.Academic Press, San Diego, CA
(1984). Google Scholar
K. Ramaesh, T. Ramaesh, J. D. West, and B. Dhillon,
“Immunolocalisation of leukaemia inhibitory factor in the cornea,”
Eye, 18 1006
–1009
(2004). https://doi.org/10.1038/sj.eye.6701394 0950-222X Google Scholar
C. S. Hsieh, S. U. Chen, Y. W. Lee, Y. S. Yang, and C. K. Sun,
“Higher harmonic generation microscopy of in vitro cultured mammal oocytes and embryos,”
Opt. Express, 16 11574
–11588
(2008). 1094-4087 Google Scholar
R. W. Boyd, Nonlinear Optics, Academic Press, San Diego, CA
(1992). Google Scholar
Y. Barad, H. Eisenberg, M. Horowitz, and Y. Silberberg,
“Nonlinear scanning laser microscopy by third harmonic generation,”
Appl. Phys. Lett., 70 922
–924
(1996). https://doi.org/10.1063/1.118442 0003-6951 Google Scholar
I. Jalbert, F. Stapleton, E. Papas, D. F. Sweeney, and M. Coroneo,
“In vivo confocal microscopy of the human cornea,”
Br. J. Ophthamol., 87 225
–236
(2003). https://doi.org/10.1136/bjo.87.2.225 0007-1161 Google Scholar
R. L. McCally and R. A. Farrell,
“Light scattering from cornea and corneal transparency,”
Noninvasive Diagnostic Techniques in Ophthalmology, Springer-Verlag, Berlin
(1990). Google Scholar
|
|||||||||||||||||||||||||||||


