|
|
1.IntroductionLiver fibrosis is a result of wound healing responses with resultant accumulation of collagen.1 Assessment of liver fibrosis severity is commonly used for staging chronic liver diseases, and for therapeutic efficacy evaluation. All the currently adopted noninvasive methodologies such as blood tests, magnetic resonance imaging (MRI), and ultrasound are effective in qualitatively assessing the presence or absence of the disease, rather than assessing precisely the progression of fibrosis in a step-wise fashion. This limits the clinical usefulness of the tests, as it is important to track the progression of disease to predict the eventual timing of liver function loss and the onset of portal hypertension or other complications which determine proper courses of therapeutic intervention. Liver biopsy still remains the gold standard in tracking fibrosis progression despite the risks of sampling error, provided that the specimens are of at least in length, including at least 11 portal tracts.2, 3 After biopsy, tissue samples are stained and passed to experienced pathologists to yield either a descriptive or semiquantitative score.4, 5, 6, 7, 8, 9 These scoring systems, originally designed for specific liver diseases like hepatitis C, focus on qualitative rather than quantitative properties of fibrosis development, grouping liver fibrosis into categories of severity. It is difficult to obtain highly reproducible results from these scores10, 11, 12, 13 due to the high degree of intra- and interobserver discrepancy (as high as 35%).10, 11, 12, 13, 14 FibroXact, FibroQuant, Bioquant Nova Prime, and other morphometric quantification systems that automate and simplify color segmentation have been reported to achieve a continuum in fibrosis quantification.6, 15, 16, 17, 18 A common difficulty faced by these procedures is the variation in staining resulting from different batches of stains, protocols, time-dependent fading, and photobleaching. Driven by the telecommunication boost in recent years, developments in both mode-locked lasers and highly sensitive optical sensors have made nonlinear optical microscopy—such as the multiphoton excited fluorescence and multiharmonic generation—an affordable option for tissue imaging. Over the past decade, second harmonic generation (SHG) microscopy has been increasingly used in biological science research. In particular, SHG was used to measure neurons and collagen, which have special structural properties.19, 20, 21, 22, 23 SHG exhibits intrinsic advantages over conventional fluorescence imaging, as it is a nonlinear optical process requiring no fluorophore presence in tissue; thus, signals are unaffected by dye concentration and photobleaching. The excitation source can be at infrared range, resulting in less scattering in tissues than that in the visible wavelength range and deeper tissue penetration for imaging purposes.24, 25, 26, 27, 28, 29, 30 SHG can be used for quantitative measurement of collagen in various organs as an indication of fibrosis development.19, 23, 25, 28, 31, 32 In particular, the feasibility of using SHG microscopy in monitoring fibrosis in livers has been demonstrated.33, 34, 35 Our group has recently developed a SHG-based system for highly sensitive collagen quantification and for collagen remodeling study during the early stages of liver fibrosis. The results obtained using SHG are standardized, highly reproducible, and can monitor the structural progression of collagen at all stages of liver fibrosis.32 SHG presents a potential solution for time- and cost-effective, accurate assessment of liver fibrosis in clinics. It will be important to directly compare and validate the SHG-based method against the conventional methods used in clinics to improve the quantification algorithms and detection sensitivity, so that it can be employed effectively for quantitative tracking of liver fibrosis. We validated our SHG quantification system by comparing the SHG-based liver fibrosis scoring with the existing gold standard for liver fibrosis diagnosis: morphological staging performed by pathologists.36, 37 We have established a comprehensive animal model with different stages of liver fibrosis for both the qualitative and quantitative measurements of collagen content in fibrotic livers. Using the SHG system, we recorded 3-D collagen progression patterns in high spatial resolution. We have also developed an adaptive algorithm to include the morphological characteristics and spatial distributions of the collagen in the background tissue and cellular damage to improve the sensitivity of our SHG quantification system. A standardized staging system index, Fibro-C-Index, was derived by combining SHG microscopy and the adaptive quantification algorithm to identify collagen progression patterns specific to different fibrotic animal models. We further verified the feasibility of the Fibro-C-Index in clinical diagnosis by performing a preliminary trial using human tissue. Our results confirm that Fibro-C-Index can significantly reduce the time required for clinical diagnosis by removing the tissue staining process and eliminate inter- and intraobserver discrepancies. 2.Methods2.1.Animal and Tissue Sample PreparationAll procedures were performed on male Wistar rats, with initial weight of . Animals were housed in the Animal Holding Unit (AHU) of the National University of Singapore (NUS) with free access to laboratory chow and water in a light/dark schedule. Experiments were approved by the Institutional Animal Care and Use Committee (IACUC). Human liver samples were obtained from Xiang Ya Hospital in China with approval from the ethics committee of Xiang Ya Hospital. Bile duct ligation (BDL) of rats was performed under general anesthesia with ketamine and xylazine. A midline abdominal incision was performed, exposing the liver and intestines. The lower end of the bile duct is identified at its insertion into the small intestines and traced up toward the porta. The bile duct is then doubly ligated in two areas near the porta with silk sutures and then transacted between the two ligation points. The wound is then closed with a double layered tissue closure with vicryl sutures. A total of 15 rats were ligated and sacrificed at intervals of 2, 4, and ( per week). Five control rats were also sacrificed at week 0. Cardiac perfusion with 4% paraformaldehyde was performed to flush out blood cells and fix the liver tissue before harvesting. Liver specimens from the left lateral lobe were preserved in paraffin and sectioned with a thickness of . Human biopsy samples (three patients) were fixed in buffered formalin, embedded in paraffin, and sectioned with a thickness of . 2.2.Histopathological ScoringBoth animal and human sliced tissue samples were stained with a Masson Trichrome (MT) stain kit (ChromaView advanced testing, 87019, Richard-Allan Scientific, Thermo Fisher Scientific, Wathan, Massachusetts) and imaged (IX51, Olympus). Animal tissue scoring was performed using a modified Ruwart score according to Boigk, as there was extensive bile duct proliferation noted,36, 38 making the modified Ishak score unsuitable.8 Human samples were scored according to the modified Ishak score.8 2.3.Nonlinear MicroscopyThe nonlinear optical microscope was developed based on a confocal imaging system (LSM 510, Carl Zeiss) using an external tunable mode-locked Ti:sapphire laser (Mai-Tai broadband, Spectra-Physics). The system is shown in Fig. 1, where a laser is passed through a pulse compressor (Femtocontrol, APE GmbH, Berlin, Germany) and an acousto-optic modulator (AOM) for group velocity dispersion compensation and power attenuation, respectively. The laser was then routed by a dichroic mirror , through an objective lens, to the tissue sample. TPEF emission generated in tissue was collected by the same objective lens and recorded by a photomultiplier tube (PMT), after passing through the dichroic mirror and a short-pass filter. SHG signal was collected using a high numerical aperture (NA) condenser and filtered by a bandpass filter before entering PMT (Hamamatsu R6357) for detection. With the intrinsic optical sectioning characteristics for a nonlinear optical process, the pinhole function of the confocal microscope was not used. Fig. 1Schematic illustration of the optical configuration: excitation laser was a tunable mode-locked laser with a pulse compressor (PC) and an acousto-optic modulator (AOM) for power control. The laser went through a dichroic mirror (DM, ), an objective lens, and reached tissue specimen. Second harmonic generation (SHG) signal was collected at the opposite side the laser source, in the transmitted mode, by a high numerical aperture (NA) condenser, through a field diaphragm, and a bandpass (BP) filter, before being recorded by a photomultiplier tube (PMT). Two-photon excited fluorescence (TPEF) was collected by the objective lens, filtered by a short-pass (SP) filter, before being recorded by another PMT. 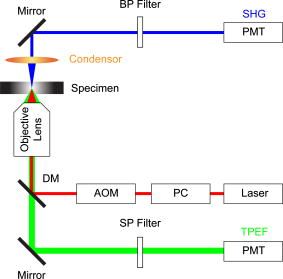 2.4.Image Acquisition and Adaptive Quantification AlgorithmA total of four SHG images ( , ) were scanned for each tissue specimen, and two specimens were extracted from each animal. The SHG image was analyzed using the direct segmentation method and adaptive quantification algorithm for comparison purposes. The direct segmentation algorithm is described as follows: background in the images was removed by subtracting a prerecorded background image, and then images were segmented using the Otsu method.39 Residual grainy noise was removed using erosion and dilation functions.40 The adaptive quantification algorithm developed in this study is illustrated by the flow chart shown in Fig. 2 . The algorithm utilizes images acquired using both TPEF and SHG microscopies. Dark background images preacquired before the experiment were subtracted from raw images, for both TPEF and SHG channels. TPEF images were categorized into three different groups, depending on pixel intensity: completely dark, dim, and bright, which represent areas of vessel or outside tissue space, bile duct, and all other cells, respectively. Threshold levels used here were found by identifying local minima from the pixel intensity profile of the entire TPEF image, given the significant intensity variation among three different groups. Once these areas were identified, a mask was created from segmented TPEF images. Fig. 2Flow chart of the adaptive quantification algorithm. TPEF images were first differentiated into three groups, depending on the pixel intensity level, into dark, dim, and bright regions. Different weights were added to these groups before applying Otsu segmentation. After segmentation, remaining grainy noises were removed using erosion and dilation algorithms, and the final mask was created. This mask was applied on SHG images for adaptive weighting adjustment on collagens in different areas. Finally, collagen content was quantified to generate Fibro-C-Index. 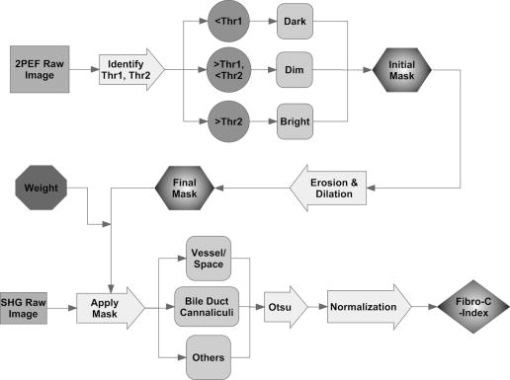 Various weights were subsequently assigned to these areas depending on the likelihood of collagen aggregation in these areas. A constant, , was assigned to areas representing borders of blood vessels as well as inside the bile duct, while the rest of the image was assigned with a unity constant 1. The value of weight constant was then determined systematically by examining the adaptive quantification results between the early and late stages of liver fibrosis, such that the quantification result difference is the greatest. Once the optimal was determined, it was multiplied to the SHG image, followed by Otsu segmentation,39 erosion, and dilation40 to create a final mask. By applying a final mask on the raw SHG image, we obtained an image representing the collagen content in the tissue sample. All image processing and algorithm execution were carried out using MATLAB (The Math Works, Natick, Massachusetts). The image processing algorithm code is available for readers on request. 2.5.Fibro-C-IndexBy combing the SHG microscopy and adaptive quantification algorithm, we proposed a standardized quantification indexing system, Fibro-C-Index, for staging the progression of liver fibrosis. In Fibro-C-Index, a percentage area of collagen was used as a measure of liver fibrosis progression. To make a standardized comparison across all tissue samples, all data were collected using the same parameters (PMT gain and laser power) and normalized against the area quantification. The control group was considered the normalization factor and used across the data collected from all tissue samples. Fibro-C-Index was later used to compare the results obtained using conventional histopathological scoring. 3.Results and DiscussionsFibro-C-Index results were compared with morphological staging performed by pathologists to demonstrate the accuracy of the SHG quantification on the liver fibrosis severity. Our morphology-based algorithm, Fibro-C-Index, improves the sensitivity of the SHG quantification system for fibrosis detection by incorporating morphological features commonly observed in conventional histology settings. The use of this standardized quantification indexing method eliminates the inter- and intraobserver discrepancies and the need for tissue staining. Together with the superior sensitivity and spatial resolution of the SHG microscopy, we have identified collagen progression patterns that are specific to different fibrotic animal models. The ability to recognize these collagen progression patterns can be used for prognostic diagnosis in clinics in the future. 3.1.Qualitative Progression of Liver FibrosisFibro-C-Index proposed in this study is a quantitative approach to assess liver fibrosis progression in continuum. and It is important that this technique has the advantage of observing all qualitative (morphological) features that are commonly seen in conventional histopathology, without any need for tissue staining. SHG and TPEF microscopies were used to simultaneously quantify changes in fibrillar collagen and hepatocyte morphology during liver fibrosis progression. Excited with femto-pulsed lasers, intrinsic molecules in hepatocyte such as NAD(P)H and flavins emitted substantial fluorescence, making TPEF suitable for cell morphology observation.41 Areas containing nucleus, lipid droplets, and vacuoles formed by degenerated hepatocytes appeared dark in the TPEF image due to the lack of fluorescent molecules. SHG and TPEF microscopies were used to detect changes in fibrillar collagen as well as hepatocyte and bile duct morphology, and were compared with the results obtained from the modified Ruwart scoring.36, 38 Figures 3a, 3b, 3c, 3d shows changes in collagen using Masson Trichrome staining, and Figs. 3e, 3f, 3g, 3h show the combination of SHG and TPEF microscopies. Readers can refer to the modified Ruwart scoring system for a detailed definition of the scoring system.36, 38 In normal livers, hepatocytes were healthy and the presence of collagen was minimal. As the liver fibrosis progressed in the animal models, stage 1 fibrosis with an increase in pericellular collagen without the formation of septa was observed [Figs. 3a and 3e]. At about after BDL, proliferation of the bile duct appeared as dim regions in the SHG/TPEF images. Stage 2 collagen aggregations formed incomplete septa from the portal tract to the central vein [Figs. 3b and 3f]. By week 6, profuse proliferation of the bile ducts could be observed all over the tissue sample [Figs. 3c and 3g]. Complete but thin collagen septa interconnected with each other to divide the parenchyma into separate fragments in stage 3 fibrosis. Late fibrosis (stage 4) was observed in some animals after , when thick collagen septa were observed, forming complete cirrhotic nodules [Fig. 3d and 3h]. Unique to the BDL model was the amount of the bile duct proliferation and collagen aggregating around the bile ducts, shown as dim regions. The BDL model exhibited induced liver fibrosis progression over . The pathological development of liver fibrosis, including changes in collagen fibers, bile duct, and hepatocyte morphology, could be clearly recorded by SHG/TPEF imaging without the need for tissue staining. Fig. 3Morphological changes at different stages (1 to 4) of liver fibrosis recorded with (a) to (d) conventional Masson Trichrome staining, as well as (e) to (h) SHG and TPEF microscopies. In stage 1 liver fibrosis, there was presence of pericellular collagen without the septa formation in (a) and (e). In livers with stage 2 fibrosis, (b) collagen aggregations formed incomplete septa from the portal tract to central vein, and (f) the bile duct proliferation was seen as dim regions in the SHG image. For stage 3 liver fibrosis, profuse bile duct proliferation was observed all over the tissue sample, where complete but thin collagen septa interconnected with each other in (c) and (g). In stage 4 fibrosis, thick collagen septa were observed, forming complete cirrhosis in (d) and (h). Note that in (e) through (h), TPEF is shown in red and SHG in green, and all scale bars are . (Color online only.) 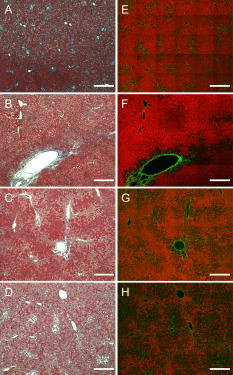 3.2.Quantification Using Adaptive AlgorithmOur group has previously developed a quantification algorithm using the SHG/TPEF system, in which images and quantification were processed without emphasis on the typical morphological features seen in the images.32 When the original algorithm was applied to the BDL model, a small amount of the collagen presence was removed after segmentation, as their signal levels are equivalent to the noise levels. To improve the system’s sensitivity, we have incorporated morphology information for quantitative fibrosis assessment. We developed an adaptive algorithm specifically for the BDL model using insights gained from the collagen progression observed in Fig. 3. Collagen was noted to aggregate around blood vessels and bile ducts in our BDL model. By enhancing SHG signals in these regions before applying Otsu segmentation, we could retain fine collagens with low intensity levels. A comparison between the direct segmentation algorithm and the adaptive quantification algorithm is shown in Fig. 4 . In images processed using a direct segmentation algorithm, the area pointed by the white arrow appeared to be fairly empty [Fig. 4a]. There was much more collagen in the same area when the adaptive quantification algorithm was applied instead [Fig. 4b]. A series of weights were applied in the adaptive quantification algorithm and the results are summarized in Fig. 4c. To determine the optimal weight , a sensitivity analysis was performed based on the quantification results between weeks 2 and 6. The ratio (quantification results of week 6/week 2) was calculated systematically for to 110, and the results are shown in Fig. 4d. In this analysis, it was found that the adaptive algorithm is most sensitive for differentiating between early and late stages of liver fibrosis when . Area of collagen identified is 4 to 6 times higher than that obtained with the direct segmentation algorithm . For the subsequent results presented here, was chosen to be 70. The adaptive algorithm developed here further enhanced the sensitivity of SHG for detecting collagen contents, specifically for the BDL model. Fig. 4Comparison between direct and adaptive quantification algorithms. Typical results of SHG images after direct and adaptive threshold approaches are shown in (a) and (b), respectively. In areas pointed by the white arrow, it is clear that many of the fine collagens (with low signal intensity) lost using the direct threshold approach are well maintained using an adaptive threshold. In (c), the quantification results for animal study were analyzed using various weights. Total collagen areas detected were significantly higher using the adaptive quantification algorithm. (d) Sensitivity analysis of weights added on the ratio between week 2 and 6 quantification results. The ratio is the highest, , with weight 70. 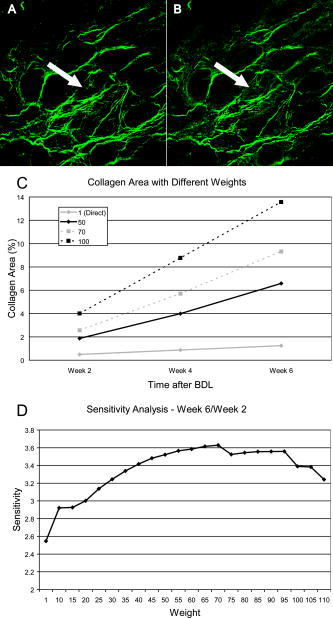 3.3.Effect of Staining on Second Harmonic/Two-Photon Excited Fluorescence ImagingSHG/TPEF imaging is normally performed on nonstained specimens, and it is unclear how the presence of dye affects the image quality. Anticipating that both dye staining and SHG may still be required for the same limited amount of human tissue in clinical histology for a complete diagnosis, we studied the effect of the dye staining on SHG/TPEF imaging. In Fig. 5a, an image of tissue sample stained with MT is shown, in which a vessel, bile duct cannaliculi, and hepatocytes are labeled with , , and , respectively. The same tissue sampled was also imaged using a SHG/TPEF microscope before [Fig. 5b] and after [Fig. 5c] MT staining. After staining, the autofluorescence experienced strong absorption from the dye, as the TPEF signal levels (red channel) in Fig. 5c are much lower than that in Fig. 5b. For SHG (green channel), the absorption effect is less severe and the signal levels are comparable. We have also found that the image [Fig. 5c] is noisy, as stained tissue exhibits a higher scattering property. These findings suggest that SHG/TPEF microscopy is more suitable for tissue samples without staining, and should be performed prior to any staining procedures, if required. Fig. 5Comparison between stained tissue images and SHG/TPEF images. (a) Tissue sample stained with Masson Trichrome (MT). (b) SHG/TPEF image of the same location prior to the MT staining. (c) SHG/TPEF image of the same location after MT staining. In all images, a vessel, bile ducts, and hepatocytes are labeled with , , and , respectively. TPEF (red channel) levels in (c) are much lower than that in (b), as autofluorescence experiences strong absorption from the dye. For SHG (green channel), the absorption effect is less severe and the signal levels are comparable. In (c), the image is noisy, as stained tissue exhibits a higher scattering property. Note that all scale bars are . 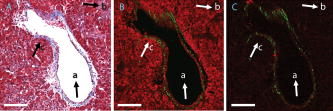 3.4.Fibro-C-Index and ValidationWe have validated Fibro-C-Index by comparing it with the conventional assessment technique using a histopathological scoring system. The conventional histopathological score used here was proposed by Ruwart 36 Boigk 38 Fibrosis was scored in four different stages, 1, 2, 3, and 4. Staging results from the tissue samples acquired at different time points (weeks 0, 2, 4, and 6 after BDL) are shown in Fig. 6a, where histopathological results reflected the severity trend of liver fibrosis induced after BDL. We then compared the histopathological results against the area of collagen detected using SHG microscopy and the optimized quantification algorithm [Fig. 6b]. There is clear overlap of the collagen area between different stages: in the early stages (1 and 2), overlap occurs by as much as 50%; in later stages (3 and 4), this problem was even more significant, with almost no difference in the collagen area in the two groups. Within each stage, the collagen area varies from 11 to 45%. The high degree of overlap between the degree of liver fibrosis between stages and the variability of collagen area within each stage illustrates the problems of inter- and intraobserver discrepancies when a qualitative staging system is used.10, 11, 12, 13, 14 Fig. 6Validation of Fibro-C-Index with conventional histopathology scoring system. (a) Histopathology scoring results of liver tissue at different time points after performing bile duct ligation (BDL). Scoring results are 0, 1, 2, 3, or 4 only. Values shown are averaged over all the tissue samples at the given time point, showing a liver fibrosis severity increase over . (b) Comparison between scoring results from conventional histopathological scoring systems against areas of collagen detected using SHG microscopy. There is clear overlap of collagen areas between different fibrosis stages. In early stages (1 and 2), overlap occurs by as much as 50%. In later stages (3 and 4), there was no significant difference in the collagen area in the two groups. Within each group, the collagen area varies from 11 to 45%. (c) Fibro-C-Index results obtained at different time points after BDL showed that Fibro-C-Index, a purely quantitative measurement of fibrosis progression, agrees with the conventional scoring results shown in (a). 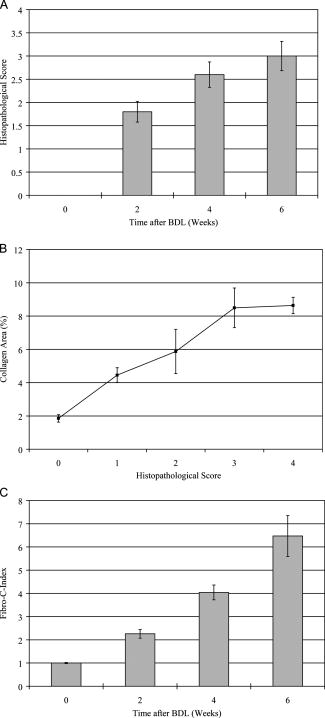 Without varying factors such as staining quality and photobleaching,31, 32 Fibro-C-Index is highly reproducible and can be used as a standardized platform for assessing liver fibrosis progression in a continuum. Fibro-C-Index was calculated at the same set time points [weeks 0, 2, 4, and 6 after BDL, Fig. 6c] and it yielded a more quantitative assessment of liver fibrosis progression than conventional histopathological scores. By including Fibro-C-Index as a part of the scoring criteria, we anticipate that the time required for diagnosis can be significantly reduced by removing the need of tissue staining (which takes at least ), and more importantly, eliminating the intra- and interobserver discrepancies. 3.5.Fibrosis Quantification and Sample Images from Human Liver TissueWe tested the Fibro-C-Index with human tissue by comparing results with that obtained from Ishak scoring.8, 42 Images from SHG/TPEF microscopy and MT staining are shown in Figs. 7a and 7b, respectively. The area of collagen present in this human tissue sample was , which was equivalent to a Fibro-C-Index of value . Ishak staging performed by the pathologist was stage 3. This result was in good agreement with morphometric collagen area quantification results on Ishak scoring reported by Standish,42 confirming that the use of Fibro-C-Index is as accurate, if not better than, the conventional staining methods for collagen content quantification. Additional useful clinical information may now be obtained from the precious and limited human biopsy samples, as liver fibrosis can now be quantified as a continuum. In moderate fibrosis, this will allow tracking of the progression of the disease while in severe fibrosis and cirrhosis, and it may allow for the prediction of portal hypertension and liver failure. Fig. 7Images taken from human samples. Images obtained using SHG are shown in (a) and (c). Images obtained using conventional Masson Trichrome staining are in (b) and (d). (a) and (b) were from the same piece of tissue before (for SHG imaging) and after staining at lower magnification, while the corresponding high-magnification images are shown in (c) and (d). Note that all scale bars are . 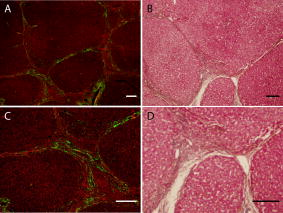 3.6.Further Clinical ApplicationsIn addition to the improved sensitivity of collagen quantification, the morphological information we gained from different fibrosis models such as BDL and suggests another potential diagnostic use of Fibro-C-Index in clinics. The profile of the collagen distribution in liver fibrosis is significantly different between BDL and fibrosis models.32 In the model, collagen aggregated around vessel walls. As liver fibrosis progressed, fine collagen distributed in sinusoidal areas disappeared (see Fig. 8 ). In the BDL model, collagen aggregation took place around vessel walls and in areas where the bile duct proliferated. We may be able to use our SHG imaging system to identify the patterns for different causes of liver fibrosis, and produce a standardized scoring index for different pathologies with specialized algorithms. Fig. 8Images taken from and BDL rat models using SHG microscopy. (a) and (b) are images obtained from and BDL, respectively. (c) and (d) are the corresponding 3-D projections of -thick tissue samples in the SHG channel only. In the model, collagen aggregated around vessel walls as liver fibrosis progressed, whereas fine collagen distributed in sinusoidal areas disappeared. In the BDL model, collagen aggregation took place around vessel walls as well as in areas where bile ducts proliferated. Scale bars are . 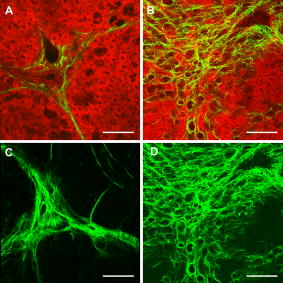 It has become increasingly obvious that the distribution of collagen is more importantly correlated with the development of portal hypertension and complications than purely the amount of collagen. Naqula described a correlation of hepatic venous pressure gradient with nodular size and septal thickness.43 A clearer definition of collagen with SHG signals will allow these factors to be assessed more accurately, and hence more accurate predictions of portal hypertension will be possible in the future. 4.ConclusionsWe develop and validate a standardized quantification system in continuum for liver fibrosis assessment, Fibro-C-Index, using SHG and TPEF microscopes. We demonstrate the feasibility of our SHG/TPEF microscopies in monitoring liver fibrosis progression with the BDL animal model by comparing the conventional histopathological scoring system. We develop an adaptive quantification algorithm based on the morphological characteristics and spatial distributions of the collagen in the background tissue and cellular damage in the BDL animal model. The sensitivity in differentiating between early and late stages of liver fibrosis is improved by more than three times when compared with direct quantification without morphological information. The recognition of different fibrosis progression patterns in different animal models potentially allows application of SHG/TPEF microscopies in diagnosis and prognostication of disease complications. By incorporating Fibro-C-Index, we can minimize the intra- and interobserver discrepancies by providing a standardized indexing system, and significantly reduce the diagnosis time required by eliminating tissue processing and staining. Research assessing the diagnostic utility of noninvasive markers or antifibrotic drug efficacy can also be enhanced with this more accurate method of fibrosis quantification. AcknowledgmentsWe thank other members of the Cell and Tissue Engineering Laboratory. This work is supported in part by the intramural funding from the Institute of Bioengineering and Nanotechnology, of Singapore, and grants R185-001-045-305 (BMRC), R-185-000-135-112 (Ministry of Education), R-185-000-099-213 (National Medical Research Council), R-185-000-182-592 (Janssen Cilag), and Singapore-MIT Alliance Computational and Systems Biology Flagship Project funding to HYU. Nancy Tan is supported by the ExxonMobil-NUS Clinician Fellowship Award. ReferencesR. Bataller and D. A. Brenner,
“Liver fibrosis,”
J. Clin. Invest., 115
(2), 209
–218
(2005). 0021-9738 Google Scholar
P. Bedossa, D. Dargere, and V. Paradis,
“Sampling variability of liver fibrosis in chronic hepatitis C,”
J. Hepatol, 38
(6), 1449
–1457
(2003). 0168-8278 Google Scholar
P. Bedossa, D. Dargere, and V. Paradis,
“Evaluation of sampling variability of liver fibrosis in hepatitis C using virtual biopsies. How long the biopsy,”
J. Hepatol, 38
(4), 368
(2003). 0168-8278 Google Scholar
P. Bedossa and T. Poynard,
“An algorithm for the grading of activity in chronic hepatitis C. The METAVIR Cooperative Study Group,”
J. Hepatol, 24
(2), 289
–293
(1996). https://doi.org/10.1002/hep.510240201 0168-8278 Google Scholar
E. M. Brunt,
“Grading and staging the histopathological lesions of chronic hepatitis: the Knodell histology activity index and beyond,”
J. Hepatol, 31
(1), 241
–246
(2000). https://doi.org/10.1002/hep.510310136 0168-8278 Google Scholar
G. M. Dahab, M. M. Kheriza, H. M. El-Beltagi, A. M. Fouda, and O. A. El-Din,
“Digital quantification of fibrosis in liver biopsy sections: description of a new method by Photoshop software,”
J. Gastroenterol. Hepatol, 19
(1), 78
–85
(2004). https://doi.org/10.1111/j.1440-1746.2004.03183.x 0815-9319 Google Scholar
V. J. Desmet,
“Milestones in liver disease: scoring chronic hepatitis,”
J. Hepatol, 38
(4), 382
–386
(2003). https://doi.org/10.1016/S0168-8278(03)00005-9 0168-8278 Google Scholar
K. Ishak, A. Baptista, L. Bianchi, F. Callea, J. De Groote, F. Gudat, H. Denk, V. Desmet, G. Korb, R. N. MacSween,
“Histological grading and staging of chronic hepatitis,”
J. Hepatol, 22
(6), 696
–699
(1995). https://doi.org/10.1016/0168-8278(95)80226-6 0168-8278 Google Scholar
R. G. Knodell, K. G. Ishak, W. C. Black, T. S. Chen, R. Craig, N. Kaplowitz, T. W. Kiernan, and J. Wollman,
“Formulation and application of a numerical scoring system for assessing histological activity in asymptomatic chronic active hepatitis,”
J. Hepatol, 1
(5), 431
–435
(1981). https://doi.org/10.1002/hep.1840010511 0168-8278 Google Scholar
P. Bedossa, P. Bioulacsage, P. Callard, M. Chevallier, C. Degott, Y. Deugnier, M. Fabre, M. Reynes, J. J. Voigt, E. S. Zafrani, T. Poynard, and G. Babany,
“Intraobserver and interobserver variations in liver biopsy interpretation in patients with chronic hepatitis C. The French METAVIR Cooperative Study Group,”
J. Hepatol, 20
(1), 15
–20
(1994). 0168-8278 Google Scholar
K. Gronbaek, P. B. Christensen, S. Hamilton-Dutoit, B. H. Federspiel, E. Hage, O. J. Jensen, and M. Vyberg,
“Interobserver variation in interpretation of serial liver biopsies from patients with chronic hepatitis C,”
J. Viral Hepat., 9
(6), 443
–449
(2002). https://doi.org/10.1046/j.1365-2893.2002.00389.x 1352-0504 Google Scholar
A. Theodossi, A. M. Skene, B. Portmann, R. P. Knill-Jones, R. S. Patrick, R. A. Tate, W. Kealey, K. J. Jarvis, D. J. O’Brian, and R. Williams,
“Observer variation in assessment of liver biopsies including analysis by kappa statistics,”
Gastroenterology, 79
(2), 232
–241
(1980). 0016-5085 Google Scholar
A. Theodossi, D. J. Spiegelhalter, J. Jass, J. Firth, M. Dixon, M. Leader, D. A. Levison, R. Lindley, I. Filipe, A. Price, N. A. Shepherd, S. Thomas, and H. Thompson,
“Observer variation and discriminatory value of biopsy features in inflammatory bowel-disease,”
Gut, 35
(7), 961
–968
(1994). https://doi.org/10.1136/gut.35.7.961 0017-5749 Google Scholar
J. Westin, L. M. Lagging, R. Wejstal, G. Norkrans, and A. P. Dhillon,
“Interobserver study of liver histopathology using the Ishak score in patients with chronic hepatitis C virus infection,”
Liver (Oxford, U. K.), 19
(3), 183
–187
(1999). 0106-9543 Google Scholar
M. Masseroli, T. Caballero, F. O’Valle, R. M. Del Moral, A. Perez-Milena, and R. G. Del Moral,
“Automatic quantification of liver fibrosis: design and validation of a new image analysis method: comparison with semi-quantitative indexes of fibrosis,”
J. Hepatol, 32
(3), 453
–464
(2000). https://doi.org/10.1016/S0168-8278(00)80397-9 0168-8278 Google Scholar
M. Wright, M. Thursz, R. Pullen, H. Thomas, and R. Goldin,
“Quantitative versus morphological assessment of liver fibrosis: semi-quantitative scores are more robust than digital image fibrosis area estimation,”
Liver Intl., 23
(1), 28
–34
(2003). https://doi.org/10.1034/j.1600-0676.2003.01771.x Google Scholar
M. A. Friedenberg, L. Miller, C. Y. Chung, F. Fleszler, F. L. Banson, R. Thomas, K. P. Swartz, and F. K. Friedenberg,
“Simplified method of hepatic fibrosis quantification: design of a new morphometric analysis application,”
Liver Intl., 25
(6), 1156
–1161
(2005). https://doi.org/10.1111/j.1478-3231.2005.01161.x Google Scholar
I. I. Matalka, O. M. Al-Jarrah, and T. M. Manasrah,
“Quantitative assessment of liver fibrosis: a novel automated image analysis method,”
Liver Intl., 26
(9), 1054
–1064
(2006). https://doi.org/10.1111/j.1478-3231.2006.01341.x Google Scholar
X. Han, R. M. Burke, M. L. Zettel, P. Tang, and E. B. Brown,
“Second harmonic properties of tumor collagen: determining the structural relationship between reactive stroma and healthy stroma,”
Opt. Express, 16 1846
–1859
(2008). https://doi.org/10.1364/OE.16.001846 1094-4087 Google Scholar
M. G. Lin, T. L. Yang, C. T. Chiang, H. C. Kao, J. N. Lee, W. Lo, S. H. Jee, Y. F. Chen, C. Y. Dong, and S. J. Lin,
“Evaluation of dermal thermal damage by multiphoton autofluorescence and second-harmonic-generation microscopy,”
J. Biomed. Opt., 11
(6), 064006
(2006). https://doi.org/10.1117/1.2405347 1083-3668 Google Scholar
S. J. Lin, R. J. Wu, H. Y. Tan, W. Lo, W. C. Lin, T. H. Young, C. J. Hsu, J. S. Chen, S. H. Jee, and C. Y. Dong,
“Evaluating cutaneous photoaging by use of multiphoton fluorescence and second-harmonic generation microscopy,”
Opt. Lett., 30
(17), 2275
–2277
(2005). https://doi.org/10.1364/OL.30.002275 0146-9592 Google Scholar
B. A. Nemet, V. Nikolenko, and R. Yuste,
“Second harmonic imaging of membrane potential of neurons with retinal,”
J. Biomed. Opt., 9
(5), 873
–881
(2004). https://doi.org/10.1117/1.1783353 1083-3668 Google Scholar
T. A. Theodossiou, C. Thrasivoulou, C. Ekwobi, and D. L. Becker,
“Second harmonic generation confocal microscopy of collagen type I from rat tendon cryosections,”
Biophys. J., 91
(12), 4665
–4677
(2006). https://doi.org/10.1529/biophysj.106.093740 0006-3495 Google Scholar
M. H. Chen, W. L. Chen, Y. Sun, P. T. Fwu, and C. Y. Dong,
“Multiphoton autofluorescence and second-harmonic generation imaging of the tooth,”
J. Biomed. Opt., 12 064006
(2007). https://doi.org/10.1117/1.2812704 1083-3668 Google Scholar
B. Gong, J. Sun, G. Vargas, Q. Chang, Y. Xu, D. Srivastava, and P. J. Boor,
“Nonlinear imaging study of extracellular matrix in chemical-induced, developmental dissecting aortic aneurysm: Evidence for defective collagen type III,”
Birth Defects Res. Part A-Clin. Molecular Teratol., 82 16
–24
(2008). https://doi.org/10.1002/bdra.20408 Google Scholar
E. J. Gualda, G. Filippidis, G. Voglis, M. Mari, C. Fotakis, and N. Tavernarakis,
“In vivo imaging of cellular structures in Caenorhabditis elegans by combined TPEF, SHG and THG microscopy,”
J. Microsc., 229 141
–150
(2008). https://doi.org/10.1111/j.1365-2818.2007.01876.x 0022-2720 Google Scholar
J. G. Lyubovitsky, T. B. Krasieva, X. M. Xu, B. Andersen, and B. J. Tromberg,
“In situ multiphoton optical tomography of hair follicles in mice,”
J. Biomed. Opt., 12 044003
(2007). https://doi.org/10.1117/1.2764462 1083-3668 Google Scholar
C. Odin, Y. Le Grand, A. Renault, L. Gailhouste, and G. Baffet,
“Orientation fields of nonlinear biological fibrils by second harmonic generation microscopy,”
J. Microsc., 229 32
–38
(2008). https://doi.org/10.1111/j.1365-2818.2007.01868.x 0022-2720 Google Scholar
T. Z. Teisseyre, A. C. Millard, P. Yan, J. P. Wuskell, M. D. Wei, A. Lewis, and L. M. Loew,
“Nonlinear optical potentiometric dyes optimized for imaging with light,”
J. Biomed. Opt., 12 044001
(2007). https://doi.org/10.1117/1.2772276 1083-3668 Google Scholar
T. Yasui, Y. Tohno, and T. Araki,
“Characterization of collagen orientation in human dermis by two-dimensional second-harmonic-generation polarimetry,”
J. Biomed. Opt., 9
(2), 259
–264
(2004). https://doi.org/10.1117/1.1644116 1083-3668 Google Scholar
M. Strupler, A. M. Pena, M. Hernest, P. L. Tharaux, J. L. Martin, E. Beaurepaire, and M. C. Schanne-Klein,
“Second harmonic imaging and scoring of collagen in fibrotic tissues,”
Opt. Express, 15
(7), 4054
–4065
(2007). https://doi.org/10.1364/OE.15.004054 1094-4087 Google Scholar
W. X. Sun, S. Chang, D. C. S. Tai, N. Tan, G. F. Xiao, H. H. Tang, and H. Yu,
“Non-linear optical microscopy: use of second harmonic generation and two-photon microscopy for automated quantitative liver fibrosis studies,”
J. Biomed. Opt., 13
(6), 064010
(2008). https://doi.org/10.1117/1.3041159 1083-3668 Google Scholar
M. Banavar, E. P. W. Kable, F. Braet, X. M. Wang, M. D. Gorrell, and G. Cox,
“Detection of collagen by second harmonic microscopy as a diagnostic tool for liver fibrosis - art. no. 60891B,”
Proc. SPIE, 6089 B891
–B891
(2006). 0277-786X Google Scholar
G. Cox, E. Kable, A. Jones, I. K. Fraser, F. Manconi, and M. D. Gorrell,
“3-dimensional imaging of collagen using second harmonic generation,”
J. Struct. Biol., 141
(1), 53
–62
(2003). https://doi.org/10.1016/S1047-8477(02)00576-2 1047-8477 Google Scholar
M. D. Gorrell, X. M. Wang, M. T. Levy, E. Kable, G. Marinos, G. Cox, and G. W. McCaughan,
“Intrahepatic expression of collagen and fibroblast activation protein (FAP) in hepatitis C virus infection,”
Dipeptidyl Aminopeptidases Health Disease, 524 235
–243
(2003). https://doi.org/10.1007/0-306-47920-6_28 Google Scholar
M. J. Ruwart, K. F. Wilkinson, B. D. Rush, T. J. Vidmar, K. M. Peters, K. S. Henley, H. D. Appelman, K. Y. Kim, D. Schuppan, and E. G. Hahn,
“The integrated value of serum procollagen-III peptide over time predicts hepatic hydroxyproline content and staniable collagen in a model of dietart cirrhosis in the rat,”
J. Hepatol, 10
(5), 801
–806
(1989). https://doi.org/10.1002/hep.1840100509 0168-8278 Google Scholar
D. Tretheway, A. Jain, R. LaPoint, R. Sharma, M. Orloff, P. Milot, A. Bozorgzadeh, and C. Ryon,
“Should trichrome stain be used on all post-liver transplant biopsies with hepatitis C virus infection to estimate the fibrosis score,”
Liver Transpl Surg., 14
(5), 695
–700
(2008). https://doi.org/10.1002/lt.21422 1074-3022 Google Scholar
G. Boigk, L. Stroedter, H. Herbst, J. Waldschmidt, E. O. Riecken, and D. Schuppan,
“Silymarin retards collagen accumulation in early and advanced biliary fibrosis secondary to complete bile duct obliteration in rats,”
J. Hepatol, 26
(3), 643
–649
(1997). https://doi.org/10.1002/hep.510260316 0168-8278 Google Scholar
N. Otsu,
“A threshold selection method from gray level histograms,”
J. Hepatol, 9 62
–66
(1979). 0168-8278 Google Scholar
J. Serra, Image Analysis and Mathematical Morphology, Academic Press, New York
(1982). Google Scholar
W. R. Zipfel, R. M. Williams, R. Christie, A. Y. Nikitin, B. T. Hyman, and W. W. Webb,
“Live tissue intrinsic emission microscopy using multiphoton-excited native fluorescence and second harmonic generation,”
Proc. Natl. Acad. Sci. U.S.A., 100
(12), 7075
–7080
(2003). https://doi.org/10.1073/pnas.0832308100 0027-8424 Google Scholar
R. A. Standish, E. Cholongitas, A. Dhillon, A. K. Burroughs, and A. P. Dhillon,
“An appraisal of the histopathological assessment of liver fibrosis,”
Gut, 55
(4), 569
–578
(2006). https://doi.org/10.1136/gut.2005.084475 0017-5749 Google Scholar
S. Nagula, D. Jain, R. J. Groszmann, and G. Garcia-Tsao,
“Histological-hemodynamic correlation in cirrhosis - a histological classification of the severity of cirrhosis,”
J. Hepatol, 44
(1), 111
–117
(2006). https://doi.org/10.1016/j.jhep.2005.07.036 0168-8278 Google Scholar
|

