
|
|
1.IntroductionBecause of high incidences in the developing countries of the world, oral cancers have become a worldwide health problem and captured lots of attentions.1 Especially in some Asian areas, such as Melanesia and south-central Asia, mortality from oral cancer is remarkably high due to the habit of chewing tobacco and betel quid (AQ).2 In Taiwan, oral cancer has become the fourth leading cause of cancer death in men because of the AQ chewing habit,3 which leads to many clinical cases of oral submucous fibrosis (OSF), oral leukoplakia, and oral squamous cell carcinoma (SCC).4 For advanced cases, the Five-year oral cancer survival rate is 18%, compared to 76% for localized lesions.5 Therefore, early diagnosis can provide more effective treatment of this lethal disease. Management of oral dysplasia lesions is problematic because of multiple sites, diffused margins, and unpredictable risk of malignant transformation. To date, incisional biopsy remains to be the most reliable diagnostic method for the detection of oral neoplasia. However, it is not easy to take a representative tissue for biopsy from a large area of premalignant oral lesion. Therefore, development of a simple, noninvasive, routine screening tool that can detect oral neoplasia in the early stage would be important for those high-risk patients. Fluorescence spectroscopic diagnosis, either autofluorescence or induced by an extrinsic photosensitizer, has shown encouraging results in differentiating normal from neoplastic tissues in clinical oncology.6, 7 Autofluorescence spectroscopy, which is highly related to the morphohistological characteristics and intrinsic fluorophores of the tissues, has shown great potential in detecting cancerous tissues.8, 9, 10 Fluorescence diagnosis using extrinsic 5-aminolevulinic acid (ALA) has been developed to improve the detection of neoplastic lesions and applied to oral, oesophageal, bronchial, and urothelial epithelia.11, 12, 13 ALA itself is not a photosensitizer and serves as the biological precursor in the heme biosynthetic pathway.14 Administration of ALA bypasses the feedback control system in the heme biosynthetic pathway, resulting in cellular accumulation of protoporphyrin IX (PpIX, the photosensitizer). Compared to the normal cells, tumor cells accumulated more PpIX, which makes ALA successfully used to diagnose and treat tumor tissues.15, 16 For effective management of oral neoplasia, we previously showed that autofluorescence spectroscopy can be used in vivo to differentiate oral neoplastic tissue [normal oral mucosa (NOM)] from normal tissue in patients with AQ-chewing habit.9, 17 However, we also found that autofluorescence intensity of neoplasia lesions was distorted in patients with OSF.17 OSF is characterized by epithelial atrophy and marked fibrosis with deposition of collagen bundles in the lamina propria and submucosa layers of oral mucosa. These deposited collagen in fibrotic mucosa result in the distorted autofluorescence spectra of epithelial hyperkeratosis (EH), epithelial dysplasia (ED) and SCC lesions in OSF patients. Although autofluorescence spectroscopy could be used to differentiate malignant lesions from normal and premalignant tissues in OSF patients, premalignant lesions (EH and ED) on fibrotic mucosa are not distinguishable from NOM and OSF tissues due to the distorted autofluorescence intensity. The effective diagnosis of oral premalignant lesions on OSF mucosa is required because many premalignant lesions, such as leukoplakia, erythroleukoplakia, erythroplakia, and verrucous hyperplasia, can be found on the fibrotic mucosa. These oral premalignant lesions in OSF patients can occur on multiple sites and have unpredictable risk of malignant transformation. In this regard, a simple and noninvasive tool is required to find out the premalignant lesions in OSF patient. After topically applied onto oral mucosa tissue, ALA was mainly converted into PpIX in the epithelial cells, which was selective for oral premalignant and malignant tissues.18, 19 Because of the atrophic epithelium, the conversion of ALA to PpIX in fibrotic oral mucosa tissues was expected to be much lower than NOM, EH, or ED tissues. In this study, we tried to increase the effectiveness of discrimination by using PpIX fluorescence spectroscopy for the detection of premalignant lesions in OSF patients. To overcome the side effect of cutaneous photosensitivity caused by systemic ALA administration, a mucosal delivery system was developed to apply ALA onto the oral lesions. Using this mucoadhesive formulation, we showed that ALA-derived PpIX fluorescence spectroscopy could improve the effectiveness for finding out premalignant lesions above the fibrotic tissues. 2.Materials and Methods2.1.Preparation of ALA LiquidThe sol-gel formulation of ALA was prepared using Pluronic F127 (BASF, Mount Olive, New Jersey) and Carbopol 971P, which was kindly provided by Noveon Chemicals (Cleveland, Ottio). The “cold method” was adopted for preparing the Pluronic F127 gel.20 Double concentrated gels of Pluronic F127 and Carbopol 971P in water were separately prepared prior to mixing, and the mixture was stored at . ALA (20% w/w) solution was prepared prior to use by dissolving ALA into of the precooled liquid vehicle, and filled into a 1-cc syringe. The final formulation is composed of 20% ALA, 20% Pluronic F127, and 1% Carbopol 971P in distilled water. The formulation was used within . 2.2.Patients and LesionsThis study was reviewed and approved by the Human Investigation Review Board of National Taiwan University Hospital (No. 91-00006821). In total, 40 patients, with clinically suspected pure OSF (11 patients), EH on OSF (16 patients), and ED on OSF (13 patients) were recruited from the Department of Oral and Maxillofacial Surgery, National Taiwan University Hospital (see Table 1 ). All the patients had AQ chewing habits, and the examined tissues of this study were at the location of oral buccal mucosa. Written informed consent was obtained from the patient. Clinical diagnosis was performed by an oral pathologist and further confirmed by histopathological examination of the biopsy specimens taken from the characteristic part of the OSF or premalignant lesion at the patient’s first visit. For fluorescence measurement, the oral lesions and surrounding normal tissues were topically applied with ALA liquid at the dose of , which is based on our previous experience.21 To avoid the dilution of the ALA by the saliva, three cotton rolls were placed onto the orifices of bilateral Stensen’s and Wharton’s ducts before ALA application. According to the clinical experience, the initial was the most critical period for the absorption of ALA into oral lesional epithelial cells. For ALA application, the patient was asked to lie on the dental chair with the mouth open and the leaked saliva was controlled by intermittent suction during the initial . Previously, we have found that the PpIX accumulation arrived at a significant level at and reached a maximum level at 1.5 or after topical application of ALA.22 Therefore, an in vivo fluorescence spectroscopic examination was performed at after ALA application and, subsequently, biopsy specimens were taken from the site where the fluorescence spectra were measured. The specimens were fixed in 10% neutral formalin, embedded, sectioned, and stained with hematoxylin and eosin. The oral pathologist, who did not know the results of the fluorescence spectroscopy, performed all the histopathological assessments. Table 1Numbers of normal controls and three types of oral lesions: NOM, OSF, EH lesion on OSF mucosa (EH on OSF), and ED lesion on OSF mucosa (EH on OSF).
2.3.In Vivo Measurement of PpIX FluorescenceFluorescence emission spectra were measured in vivo at each lesion under the excitation of light using a spectrofluorometer (SkinSkan, JY, Urbana, Illinois?). A ozone-free xenon lamp provided the excitation light, which was selected by a motor-controlled monochromator. The excitation light was guided to illuminate samples by one arm of a Y-type quartz fiber bundle, and the emission fluorescence was collected by another arm of the fiber bundle. Both the fibers in two arms were gathered together and randomly distributed to optimize the performance of fluorescence collection (Fig. 1 ). The tip of the fiber bundle was specially designed in a bent shape to be convenient for measurements in the oral cavity. After the oral cavity of the patient was examined and cleaned, the tip of the fiber bundle was gently placed on the normal tissue or suspected lesions of the buccal mucosa by an experienced oral pathologist and then the measurement of fluorescence emission spectra began. For each measurement, were taken and the emission spectra were recorded from in increments. Each measurement was repeated twice. It was found that differences between two spectra were , which indicated that almost no photobleaching occurred during measurements. The obtained spectra were normalized by dividing the intensity of each wavelength by the integrated area under the total emission spectra, which precludes the possible variation due to fluctuation of excitation light power and fiber collection efficiency. 2.4.Statistical AnalysisOne way analysis of variance (ANOVA) was conducted to test significance of differences between groups of samples. The significant level was set at . In general, the ANOVA test was used to examine if the means of groups are not all equal when . To further exactly determine which groups differ from one another, the Post Hoc multiple comparison test is usually applied.23 In this study, a Fisher’s least significant difference (Fisher’s LSD) procedure was employed. The Fisher’s LSD is a restricted pairwise comparison procedure that should follow the ANOVA test, which had indicated significant differences.23 The significant level for the multiple comparison procedure was also set at . All the statistical analysis was carried out with a commercial statistical program (SPSS for Windows, version 12, SPSS, Inc., Chicago, Illinois). 3.Results3.1.Comparison among NOM, OSF, EH on OSF, and ED on OSF LesionsFigure 2 shows the averaged ALA-derived PpIX fluorescence spectra obtained from OSF, EH on OSF, ED on OSF, and the surrounding NOM in patients at excitation. Figure 2a shows the spectrum of tissues after ALA application; whereas Fig. 2b shows the spectrum of tissues before ALA being applied (i.e., autofluorescence). In Fig. 2a, two peaks, around (B-blue) and (R-red) respectively, were observed in the fluorescence spectra. However in Fig. 2b, only one peak at can be obviously observed. The blue peak represents tissue autofluorescence, which was noticeable in both Figs. 2a and 2b; however, the red emission peak, which represents the characteristic PpIX fluorescence, was significantly enhanced after ALA being applied for but not so apparent in autofluorescence (i.e., before ALA application). In Fig. 2a compared to the surrounding normal mucosa, the PpIX fluorescence intensity at was significantly higher in EH on OSF and ED on OSF. On the contrary, the PpIX fluorescence intensity of pure OSF lesions was significantly lower than that of NOM tissues [Fig. 2a]. Therefore, these results further indicate the possibility of using ALA-induced PpIX fluorescence spectroscopy to differentiate EH and ED lesions on OSF from the surrounding NOM or pure OSF tissue. Fig. 2(a) Averaged fluorescence spectra of ALA-induced PpIX for OSF, NOM, EH lesion on OSF mucosa, and ED lesion on OSF mucosa samples 90 min after topical application of 20% ALA sol-gel. (b) Averaged autofluorescence spectra for OSF, NOM, EH lesion on OSF mucosa, and ED lesion on OSF mucosa samples before ALA application.  The absolute intensity of PpIX fluorescence could be affected by the angle, distance, and intensity of the excitation light. To rule out the possible individual-to-individual variation and for the normalization of spectral profile, Profio used a demarcation criteria by dividing the “red peak” (PpIX fluorescence intensity) by “blue peak” (autofluorescence intensity).24 Thus, a value denoted as was defined as the ratio of the area under spectrum of to that of . In the present study, the values from all 40 patients measured were calculated. As shown in Fig. 3, due to the transformation of ALA to PpIX in oral tissues, the mean values were dramatically increased after ALA application. Furthermore, it was also observed that the mean values getting larger in the order of OSF, NOM, EH on OSF, and ED on OSF. An ANOVA test shows that there exist significant differences in values between categories (ANOVA, ), indicating that at least one category is different from the others. To further exactly determine which groups differ from one another, the corresponding post hoc multiple comparison test with Fisher’s least significant difference procedure was employed. The result shows significant differences between each categories except for the NOM and OSF, which were not distinguishable in the present case (please refer to Table 2 ). Fig. 3The averaged values for OSF, NOM, EH lesion on OSF mucosa, and ED lesion on OSF mucosa samples. The values for both autofluorescence (before 5-ALA being applied) and ALA-induced PpIX fluorescence were presented. The standard deviation and the number of each sample are also shown. 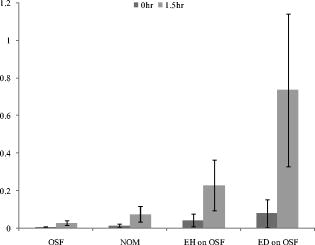 Table 2ANOVA and corresponding post hoc multiple comparison test of R∕B values for OSF, adjacent NOM, EH lesion on OSF mucosa (EH on OSF), and ED lesion on OSF mucosa (EH on OSF) samples.
Note:
*
indicates that
p<0.05
. On the other hand, the values for the autofluorescence (i.e., before ALA applications) show no significant differences (ANOVA test, ) between these groups. OSF has the characteristics of epithelial atrophy and deposition of collagen bundles in the lamina propria and submucosa of the oral mucosa. Previously, we have indicated that tissue fibrosis can distort the fluorescence intensity of premalignant lesions.17 This distortion makes autofluorescence spectroscopy difficult to diagnose premalignant lesions in OSF patients. However, ALA-induced PpIX fluorescence could considerably improve the diagnostic effectiveness. Figure 4b shows the scattering plot of OSF, EH on OSF, ED on OSF, and NOM samples for after ALA application, with the optimal threshold determined by a receiver operating characteristic (ROC) curve [Fig. 4a]. The ROC curve is a graphic method that shows the relationship between specificity and sensitivity under various thresholds that distinguish two populations. The false negative rate (one specificity) and the sensitivity are plotted on a two-dimensional scatter plot under various threshold values.25 The optimal criteria are normally determined near the upper left corner of the plot, at which the specificity and sensitivity both reach satisfactorily high values. In this study, thresholds from 0 to 1.6 in 0.01 steps were applied in the ROC curves. In considering NOM and OSF as the “nondiseased” group, while EH on OSF, and ED on OSF as “diseased” group, by means of ROC curve [Fig. 4b], we found that the optimal threshold value was 0.113, at which the sensitivity and specificity are 86.2 and 84.3%, respectively [Fig. 4a]. Fig. 4(a) Scattering plot of the values for OSF, NOM, EH lesion on OSF mucosa, and ED lesion on OSF mucosa samples with a classification threshold (only that for after ALA being applied were presented). (b) ROC curve for classification of “nondiseased” group (including OSF and NOM samples) and “diseased” group (including EH on OSF and ED on OSF samples). Optimal threshold, sensitivity, and specificity were also indicated in the plot.  4.DiscussionAlthough autofluorescence spectroscopy can be used to differentiate oral premalignant lesions from normal mucosa, we have found that this technique is only suitable in non-OSF patients.17 In OSF patients, the fluorescence spectra were distorted by the fibrosis tissue and thus made the discrimination difficult, as shown in Fig. 1. Unfortunately, oral premalignant lesions are frequently found in OSF patients that are highly related to the AQ-chewing habit.26 Therefore, the usefulness of autofluorescence spectroscopy in finding oral premalignant lesions in patients with an AQ-chewing habit would be limited. OSF is a premalignant condition of the oral mucosa.27 Chronically, the mucosa appears pale, mottled, or opaque white and feels hard and boardlike. Patients with OSF have problem in mouth opening due to fibrous bands, which can be felt running in a vertical direction in the buccal segment and in a circular direction in the labial region.26 Histologically, OSF is characterized by epithelial atrophy and progressive accumulation of collagen fibers in the lamina propria and submucosa of the oral mucosa.28 Although a marked fibrosis could be found below the dysplastic epithelium, the thickening epithelium is still found in OSF patients with EH or ED lesions.17 Because of the atrophic epithelium, the conversion of ALA to PpIX was expected to be lower, that explains the relative lower PpIX fluorescence in the pure fibrotic tissues [Fig. 2a]. Conversely, compared to normal tissues, EH or ED lesions has a thickening epithelial layer, which result in the significant higher amount of PpIX, and thus the ALA-induced PpIX fluorescence intensity from EH or ED lesions above the fibrotic tissues was significantly higher than that of surrounding NOM tissues in OSF patients [Fig. 2a]. These results indicate that ALA-derived PpIX fluorescence spectroscopy might be useful to find out oral premalignant (EH and ED) lesions above fibrotic tissues in OSF patients. ALA-derived PpIX fluorescence diagnosis has been found to be a noninvasive diagnostic modality to detect early cancers in various organs, including the oral cavity.11, 12, 13, 29, 30, 31 To our knowledge, this is the first time to show that ALA-derived fluorescence spectroscopy could be used to discriminate premalignant (EH and ED) lesions above fibrosis tissues from surrounding normal mucosa in OSF patients. In studying the spectroscopic characteristics of biological systems, many factors need to be carefully considered in performing experiments and evaluating the results. This is especially true for fluorescence spectral analyses of living tissues. Because of the limitation of instrument, the absolute intensity of fluorescence is difficult to obtain; therefore, interpretation of the spectral properties for tissue was problematic. In this regard, proper normalization procedure would be very important. In this study, we used a dimensionless ratio value to eliminate the possible influences by geometrical factors such as the target distance variations, surface topography of the lesions, as well as the excitation/detection efficiencies. Although some literature indicated that applying a “pair test” of “abnormal” to “normal” for an individual patient is useful for tissue classification, we did not employ this because the individual variations of data were expected to be eliminated via the normalization procedure. We showed in this study that this value as a diagnostic algorithm could differentiate abnormal oral lesions from normal mucosa and fibrosis tissue. Although this kind of measurement has a lot of inherited drawbacks, it may be one of the few methods that can give the physician real-time information. In fact, this diagnostic algorithm has been shown useful for discriminating malignant tissue from benign tissues.13, 32 For the patients with AQ-chewing habit, oral neoplasial lesions may occur at all sites in the oral cavity; thus, topical administration should be the preferred mode of photosensitizer administration. In this study, we used a 20% (w/w) 5-ALA sol-gel formulation, which is mucoadhesive and thermoreversable. This ALA formulation offers a series of advantages, such as it assists in retaining of the active ingredient at the lesion area, quick and easy removal of the dosage form, relatively good drug absorption, and satisfactory patient acceptance and compliance. Therefore, during photodetection, this ALA formulation not only has the advantage of easily covering all lesions in the oral cavity but also been shown to overcome the side effect of cutaneous photosensitivity caused by systemic ALA administration. In fact, this ALA-PDT is also very effective for the treatment of oral verrucous hyperplasia and carcinoma.21, 22 Our studies have demonstrated the usage of 5-ALA mucoadhesive formulation for discrimination of premalignant lesions in OSF-patients with an AQ-chewing habit. Because the detection of premalignant lesions is one of the main requisites for proper early treatment, we speculate that the inherent advantages of ALA-derived PpIX fluorescence spectroscopy might be useful for early diagnosis of oral premalignant lesions. In the future, it is possible to have diagnosis and treatment of oral neoplasia performed at the same time with the ALA sol-gel and further development of fluorescence imaging system. In fact, the success of photodetection and photodynamic therapy for the management of oral neoplasia has important clinical significance due to the large number of oral cancer patients. AcknowledgmentsThis work was supported by the National Science Council (Grants No. NSC91-2736-L038-004 and No. NSC95-2221-E-214-003-MY2) Taiwan. ReferencesJ. Ferlay, F. Bray, P. Pisani, and D. M. Parkin,
“GLOBOCAN 2002: cancer incidence, mortality and prevalence worldwide,”
IARC CancerBase, IARC Press, Lyon
(2004). Google Scholar
P. Pisani, D. M. Parkin, F. Bray, and J. Ferlay,
“Estimates of the worldwide mortality from 25 cancers in 1990,”
Int. J. Cancer, 83
(1), 18
–29
(1999). https://doi.org/10.1002/(SICI)1097-0215(19990924)83:1<18::AID-IJC5>3.0.CO;2-M 0020-7136 Google Scholar
Y. C. Ko, T. A. Chiang, S. J. Chang, and S. F. Hsieh,
“Prevalence of betel quid chewing habit in Taiwan and related sociodemographic factors,”
J. Oral Pathol., 21
(6), 261
–264
(1992). https://doi.org/10.1111/j.1600-0714.1992.tb01007.x 0300-9777 Google Scholar
J. S. Huang, S. H. Kok, and Y. S. Kuo,
“Oral cancers in Taiwan: review of the literature,”
Chin. J. Oral Maxillofac. Surg., 5
(1), 13
–22
(1994). Google Scholar
A. Garfinkel,
“Cancer statistics and trends,”
American Cancer Society Textbook of Clinical Oncology, 2
–9 American Cancer Society, Atlanta
(1991). Google Scholar
R. Richards-Kortum and E. Sevick-Muraca,
“Quantitative optical spectroscopy for tissue diagnosis,”
Annu. Rev. Phys. Chem., 47 555
–606
(1996). https://doi.org/10.1146/annurev.physchem.47.1.555 0066-426X Google Scholar
G. A. Wagnieres, W. M. Star, and B. C. Wilson,
“In vivo fluorescence spectroscopy and imaging for oncological applications,”
Photochem. Photobiol., 68
(5), 603
–632
(1998). 0031-8655 Google Scholar
S. K. Chang, N. Marin, M. Follen, and R. Richards-Kortum,
“Model-based analysis of clinical fluorescence spectroscopy for in vivo detection of cervical intraepithelial dysplasia,”
J. Biomed. Opt., 11
(2), 024008
(2006). https://doi.org/10.1117/1.2187979 1083-3668 Google Scholar
C. Y. Wang, T. Tsai, H. M. Chen, C. T. Chen, and C. P. Chiang,
“PLS-ANN based classification model for oral submucous fibrosis and oral carcinogenesis,”
Lasers Surg. Med., 32
(4), 318
–326
(2003). https://doi.org/10.1002/lsm.10153 0196-8092 Google Scholar
Y. Wu and J. Y. Qu,
“Autofluorescence spectroscopy of epithelial tissues,”
J. Biomed. Opt., 11
(5), 054023
(2006). https://doi.org/10.1117/1.2362741 1083-3668 Google Scholar
C. S. Betz, H. Stepp, P. Janda, S. Arbogast, G. Grevers, R. Baumgartner, and A. Leunig,
“A comparative study of normal inspection, autofluorescence and 5-ALA-induced PPIX fluorescence for oral cancer diagnosis,”
Int. J. Cancer, 97
(2), 245
–252
(2002). https://doi.org/10.1002/ijc.1596 0020-7136 Google Scholar
P. Monnier, M. Savary, C. Fontolliet, G. Wagnières, A. Châtelain, P. Cornaz, C. Depeursinge, and H. van den Bergh,
“Photodetection and photodynamic therapy of “early” squamous cell carcinomas of the pharynx, oesophagus and tracheo-bronchial tree,”
Lasers Med. Sci., 5
(2), 149
–169
(1990). https://doi.org/10.1007/BF02031377 0268-8921 Google Scholar
D. Zaak, D. Frimberger, H. Stepp, S. Wagner, R. Baumgartner, P. Schneede, M. Siebels, R. Knuchel, M. Kriegmair, and A. Hofstetter,
“Quantification of 5-aminolevulinic acid induced fluorescence improves the specificity of bladder cancer detection,”
J. Urol. (Baltimore), 166
(5), 1665
–1668
(2001). 0022-5347 Google Scholar
D. Zaak, D. Frimberger, H. Stepp, S. Wagner, R. Baumgartner, P. Schneede, M. Siebels, R. Knuchel, M. Kriegmair, and A. Hofstetter, J. Urol. (Baltimore), 166
(5), 1668
–1669
(2001). 0022-5347 Google Scholar
L. C. Gardner, S. J. Smith, and T. M. Cox,
“Biosynthesis of delta-aminolevulinic acid and the regulation of heme formation by immature erythroid cells in man,”
J. Biol. Chem., 266
(32), 22010
–22018
(1991). 0021-9258 Google Scholar
S. Lu, J. Y. Chen, Y. Zhang, J. Ma, P. N. Wang, and Q. Peng,
“Fluorescence detection of protoporphyrin IX in living cells: a comparative study on single- and two-photon excitation,”
J. Biomed. Opt., 13
(2), 024014
(2008). https://doi.org/10.1117/1.2907316 1083-3668 Google Scholar
Q. Peng, K. Berg, J. Moan, M. Kongshaug, and J. M. Nesland,
“5-Aminolevulinic acid-based photodynamic therapy: principles and experimental research,”
Photochem. Photobiol., 65
(2), 235
–251
(1997). https://doi.org/10.1111/j.1751-1097.1997.tb08549.x 0031-8655 Google Scholar
T. Tsai, H. M. Chen, C. Y. Wang, J. C. Tsai, C. T. Chen, and C. P. Chiang,
“In vivo autofluorescence spectroscopy of oral premalignant and malignant lesions: distortion of fluorescence intensity by submucous fibrosis,”
Lasers Surg. Med., 33
(1), 40
–47
(2003). https://doi.org/10.1002/lsm.10180 0196-8092 Google Scholar
A. Leunig, M. Mehlmann, C. Betz, H. Stepp, S. Arbogast, G. Grevers, and R. Baumgartner,
“Fluorescence staining of oral cancer using a topical application of 5-aminolevulinic acid: fluorescence microscopic studies,”
J. Photochem. Photobiol., B, 60
(1), 44
–49
(2001). https://doi.org/10.1016/S1011-1344(01)00117-8 1011-1344 Google Scholar
A. Leunig, K. Rick, H. Stepp, R. Gutmann, G. Alwin, R. Baumgartner, and J. Feyh,
“Fluorescence imaging and spectroscopy of 5-aminolevulinic acid induced protoporphyrin IX for the detection of neoplastic lesions in the oral cavity,”
Am. J. Surg., 172
(6), 674
–677
(1996). https://doi.org/10.1016/S0002-9610(96)00312-1 0002-9610 Google Scholar
I. R. Schmolka,
“Artificial skin. I. preparation and properties of pluronic F-127 gels for treatment of burns,”
J. Biomed. Mater. Res., 6
(6), 571
–582
(1972). https://doi.org/10.1002/jbm.820060609 0021-9304 Google Scholar
J. C. Tsai, C. P. Chiang, H. M. Chen, S. B. Huang, C. W. Wang, M. I. Lee, Y. C. Hsu, C. T. Chen, and T. Tsai,
“Photodynamic therapy of oral dysplasia with topical 5-aminolevulinic acid and light-emitting diode array,”
Lasers Surg. Med., 34
(1), 18
–24
(2004). https://doi.org/10.1002/lsm.10250 0196-8092 Google Scholar
H. M. Chen, C. T. Chen, H. Yang, M. Y. Kuo, Y. S. Kuo, W. H. Lan, Y. P. Wang, T. Tsai, and C. P. Chiang,
“Successful treatment of oral verrucous hyperplasia with topical 5-aminolevulinic acid-mediated photodynamic therapy,”
Oral Oncol., 40
(6), 630
–637
(2004). https://doi.org/10.1016/j.oraloncology.2003.12.010 0964-1955 Google Scholar
D. G. Kleinbaum, L. L. Kupper, and K. E. Muller, Applied Regression Analysis and Other Multivariable Methods, Duxbury Press, Pacific Grove, CA
(1998). Google Scholar
A. E. Profio, D. R. Doiron, and E. G. King,
“Laser fluorescence bronchoscope for localization of occult lung tumors,”
Med. Phys., 6
(6), 523
–525
(1979). https://doi.org/10.1118/1.594617 0094-2405 Google Scholar
Multivariate Interpretation of Clinical Laboratory Data,
(1997) Google Scholar
N. Shah and P. P. Sharma,
“Role of chewing and smoking habits in the etiology of oral submucous fibrosis (OSF): a case-control study,”
J. Oral Pathol. Med., 27
(10), 475
–479
(1998). 0904-2512 Google Scholar
J. J. Pindborg,
“Lesions of the oral mucosa to be considered premalignant and their epidemiology,”
Oral Premalignancy, 2
–12
(1980) Google Scholar
J. J. Pindborg,
“Oral submucous fibrosis: a review,”
Ann. Acad. Med. Singapore, 18
(5), 603
–607
(1989). 0304-4602 Google Scholar
R. Baumgartner, R. M. Huber, H. Schulz, H. Stepp, K. Rick, F. Gamarra, A. Leberig, and C. Roth,
“Inhalation of 5-aminolevulinic acid: a new technique for fluorescence detection of early stage lung cancer,”
J. Photochem. Photobiol., B, 36
(2), 169
–174
(1996). https://doi.org/10.1016/S1011-1344(96)07365-4 1011-1344 Google Scholar
P. Hillemanns, H. Weingandt, R. Baumgartner, J. Diebold, W. Xiang, and H. Stepp,
“Photodetection of cervical intraepithelial neoplasia using 5-aminolevulinic acid-induced porphyrin fluorescence,”
Cancer, 88
(10), 2275
–2282
(2000). https://doi.org/10.1002/(SICI)1097-0142(20000515)88:10<2275::AID-CNCR11>3.0.CO;2-B 0008-543X Google Scholar
D. P. Ladner, R. A. Steiner, J. Allemann, U. Haller, and H. Walt,
“Photodynamic diagnosis of breast tumours after oral application of aminolevulinic acid,”
Br. J. Cancer, 84
(1), 33
–37
(2001). https://doi.org/10.1054/bjoc.2000.1532 0007-0920 Google Scholar
W. Zheng, K. C. Soo, R. Sivanandan, and M. Olivo,
“Detection of squamous cell carcinomas and pre-cancerous lesions in the oral cavity by quantification of 5-aminolevulinic acid induced fluorescence endoscopic images,”
Lasers Surg. Med., 31
(3), 151
–157
(2002). https://doi.org/10.1002/lsm.10105 0196-8092 Google Scholar
|
|||||||||||||||||||||||||||||||||||||||||||||||||||||||||||||||||||||||||||


