
|
|
1.IntroductionProtein adsorption on solid surfaces has key relevance on biomedicine, biotechnology, biomaterials, and biological studies in general. It is, for instance, one of the critical factors modulating biosensor response or cell response to solid surfaces, which has implications for material biocompatibility. Indeed, protein adsorption and patterning has been the object of several studies, whether in the field of biosensors,1, 2 cell adhesion techniques,3, 4 or microarrays.5 Useful to probe protein adsorption and patterning on solid surfaces are proteins that emit fluorescence in the visible range, as the green fluorescent protein (GFP) from the jellyfish Aequorea victoria and its engineered colored mutants.6 They have been widely used not only as fluorescent markers in cell biology, contributing to visualizing dynamic processes and protein interactions inside cells,6, 7 but also to evaluate protein binding to solid surfaces.8 Reverse micelles or water-in-oil microemulsions are self-forming, thermodynamically equilibrated aggregates of water solubilized in organic solvent.9 Amphiphilic molecules aggregate with the polar head toward the micellar core to solubilize spheroidal water droplets. The dynamic properties of these systems are characterized by collision, which might lead to fusion–fission between reverse micelles and exchange of solutes between water pools. The size of water pools can be widely varied by changing the water-to-surfactant molar ratio, also called the parameter, which is directly proportional to the size of the reverse micelles. The possibility of varying the size of reverse micelles affects the solubilization of macromolecules in the water droplets. Indeed, microencapsulation of macromolecules in reverse micelles, especially proteins, has been used to several purposes such as enzyme catalysis,10 microreactors for tailoring macromolecular conjugates,11 bioseparation,10 and protein refolding.12 In this work, we have used fluorescence lifetime imaging microscopy combined with fluorescence resonance energy transfer (FLIM-FRET) to characterize a novel procedure to cluster proteins on solid surfaces. FLIM offers several advantages in fluorescence imaging and opens new possibilities to assess protein–protein interactions and protein conformational changes, as lifetime measurements are independent of fluorophore concentration, excitation intensity, and unintended photobleaching.13 The combination of FLIM with FRET provides high spatial (nanometer) and temporal (nanosecond) resolution when compared to intensity-based FRET imaging, mainly because spectral bleedthrough is not an issue in FLIM-FRET imaging. The spatial resolution limit of underlying conventional microscopy can be overcome by using FRET, allowing protein–protein interactions on surfaces to be directly probed. We were able to show that small reverse micelles can be used to cluster the cyan/yellow fluorescent protein (CFP/YFP) pair on surfaces, enabling the adequate proximity to allow FRET to occur. The work is presented as follows: (1) fluorescence lifetimes of the most common FRET pair (CFP/YFP) were measured in aqueous solution and deposited on poly-L-lysine–coated coverslips to characterize protein distribution by conventional spin-coating methodology; (2) FPs were microencapsulated in reverse micelles, and FLIM-FRET measurements were used to characterize protein distribution in small ( 5) and large ( 20) reverse micelles; (3) the reverse micellar solution containing FPs was then deposited on coverslips, and the pattern observed in solution remained on the solid surface. FPs while microencapsulated in the water pool of a reverse micelle were distributed as well-individualized round spots. Interestingly, the proximity between CFP and YFP that originates FRET in solution also leads to FRET on the coverslip, showing that clustering of proteins on the solid surface can be controlled through the reverse micelle size. 2.Materials and Methods2.1.MaterialsThe plasmids pECFP and pEYFP were purchased from Clontech (Mountain View, California). The sodium phosphate salts, sodium 1,4-bis(2-ethyl-1-hexyl) sulfo-succinate (AOT) and spectroscopic grade iso-octane were purchased from Merck (Darmstadt, Germany). The poly-L-lysine, isopropyl thiol galactoside (IPTG), and all other chemicals were purchased from Sigma (Saint Louis, Missouri). The E. coli strain BL21 (DE3) was obtained from Invitrogen (Carlsbad, California). Round coverslips ( , #1) were obtained from Menzel-Glaser (Braunschweig, Germany). 2.2.Production, Purification and Sample Preparation of Fluorescent ProteinsPlasmids with the CFP or YFP coding sequence were transformed into BL21 (DE3) and grown in LB culture medium supplemented with ampicillin at , . At , IPTG was added. Cells were harvested after induction by centrifugation, ressuspended in phosphate buffer (pH 8), and disrupted by sonication. Centrifugation at , , for separates the supernatant containing the fluorescent protein from cell debris. One protein batch of CFP was purified to electrophoretic homogeneity using two chromatographic steps carried out in an AKTA system. First, hydrophobic interaction chromatography was carried out in a phenyl-sepharose fast flow column (HiTrapTM HIC, , GE Healthcare), and the protein was eluted at the end of the gradient from 20% to 0% ammonium sulphate (buffer Tris-HCl, EDTA, pH 8). Second, anionic exchange chromatography was carried out in a Resource Q column ( , GE Healthcare), and the protein was eluted at 40 to 50% of the gradient from NaCl (buffer Tris-HCl, pH 7). After two chromatographic steps, CFP was pure by biochemical standards since a single band with size appears in the SDS-PAGE gel. YFP was not purified. The protein concentration was determined using the extinction coefficients of at for CFP and at for YFP.14 FPs were studied in solution ( phosphate buffer, pH 7) and spread on coverslips previously coated with poly-L-lysine . A spin coating machine (Laurell Technologies Corporation) was used to spread of a solution containing of CFP (or CFP plus YFP) on coverslips under controlled conditions of vacuum and centrifugal force ( of CFP were actually spread). Reverse micelles at two values ( is the water-in-oil molar ratio, i.e., ) were prepared by addition of the appropriate volume of protein aqueous solution to of AOT (or larger when specified) in iso-octane and further stirred until total transparency was achieved. CFP concentration in the water pool of reverse micelles was . FLIM images were obtained after spreading of the reverse micellar solution on coverslips and letting the isooctane evaporate, meaning that and of CFP were actually deposited from reverse micelles with 5 and 20, respectively. 2.3.Dynamic Light ScatteringDynamic light scattering (DLS) measurements were carried out using a multiangle apparatus (Brookhaven Corp.) equipped with a He–Ne laser (Model 127, Spectra Physics) with and power. The diffused light was detected by a photomultiplier (placed at a fixed angle of ) and analyzed with a 136-channel correlator (Model BI2030AT). CFP concentration in the water pool of reverse micelles was . All solutions were filtered through Millipore filters ( pore size) of hydrophobic polytetrafluoroethylene (PTFE). CONTIN software was used for size distribution information.15 2.4.Steady-State Fluorescence SpectroscopySteady-state fluorescence measurements were performed at room temperature in a Cary Eclipse fluorescence spectrophotometer from Varian. Emission spectra were recorded using a excitation wavelength and then corrected using a curve supplied with the instrument. Considering the CFP quantum yield in water as 0.4 ,14 the refractive index of water as 1.33 ,16 and the refractive index of iso-octane as 1.39 , it is possible to calculate the CFP quantum yield in reverse micelles from: where represents the integrated intensity, and is the absorbance value at the excitation wavelength for CFP in reverse micelles and in water .Calculation of distances based on FRET measurements requires the knowledge of the distance at which FRET is 50% efficient . This distance for the CFP YFP pair in aqueous solutions is .6, 17, 18 For reverse micelles, this distance was calculated taking into account small changes in absorption and emission that may occur in reverse micelles using the usual relationship: where is the quantum yield of CFP in reverse micelles, is the acceptor molar absorption coefficient, is the orientation factor (considered equal to ), is the refractive index (1.33), and (nm) is the wavelength.Experimental FRET efficiencies were obtained from steady-state and lifetime measurements: where , , and are the CFP fluorescence intensities or the CFP average lifetime, respectively, in the presence and absence of YFP.2.5.Time-Resolved Fluorescence and FLIM MeasurementsTime-resolved fluorescence and FLIM measurements were acquired with a Microtime 200 from Picoquant GmbH (Berlin, Germany) using the time-correlated single-photon counting (TC-SPC) technique. The instrument setup includes an inverted microscope (Olympus IX 71) and provides image resolution up to per pixel. The sample holder is positioned on an XY stage E-710 Digital PZT Controller with scanning range of with resolution. Spatial resolution of the setup was down to as determined by using fluorescent beads from Molecular Probes. This value is close to the diffraction limit (about half the wavelength of the incident light). A more detailed description of the instrument is found elsewhere,19, 20, 21 Lifetime measurements were performed with excitation light of (pulsed picosecond laser diode set to , , pulse width) and bandpass emission filters of (for CFP) or (for YFP). Detection could use a photomultiplier tube (Picoquant, Model PMA-182) or single-photon avalanche diodes (SPADs), depending on the fluorescence intensity. Mostly, the photomultiplier tube was used for measurements in solution and SPADs for measurements on coverslips. Data acquisition was performed in a PC equipped with a Timeharp 200 TC-SPC board, (Picoquant) with 4096 channels and a time increment smaller than . Light from the laser beam was backscattered by the square base of optical path quartz fluorescence cuvette or coverslip and was directed to the detection system to obtain the instrumental response function (IRF).22, 23 Data analysis was performed by deconvolution using a nonlinear least-squares fitting program, based on the Marquardt algorithm. The goodness of the fit was evaluated by the usual statistical criteria and by visual inspection of the distribution of weighted residuals and the autocorrelation function. Average lifetimes, ⟨ ⟩, were calculated from: where is the individual decay lifetime, and its respective normalized amplitudes.3.Results3.1.CFP/YFP in Aqueous SolutionTime-resolved fluorescence decays were obtained for CFP and YFP in aqueous solution, pH 7 (Fig. 1 and Table 1 ). CFP displays two lifetimes and YFP a single lifetime, as described elsewhere.18, 24 CFP decays can be fitted with two exponentials even in mammalian cells.25. The introduction of a second exponential to describe the decay of YFP slightly improves the fit (lower and better autocorrelation), as also documented elsewhere.24 However, as the amplitude of the second lifetime is very low and the fit improvement is not consistent for different measurements, we have considered that YFP decays according to a single lifetime. This is a reasonable approximation to the aim of our study and is well supported by the residuals and the parameter (Fig. 1 and Table 1). Purification of CFP to electrophoretic homogeneity has no effect on its fluorescence decay, showing that lifetimes of FPs are independent of the presence of other cell fluorophores (Table 1). Those that may eventually be excited at such as heme proteins or flavin mononucleotides are either not fluorescent or present in such low amounts compared to overexpressed proteins in E. coli that no interference with fluorescence properties of FPs was detected. Therefore, all the results shown in the following report fluorescence of unpurified samples. Fig. 1CFP and YFP decays in phosphate buffer, pH 7, and residuals for a double (CFP) and mono exponential decay (YFP).  Table 1Fluorescence lifetimes and normalized amplitudes of fluorescent proteins in solution obtained upon deconvolution with the IRF.
In the experimental conditions used, no FRET was detected for the pair CFP/YFP in aqueous solution, as the lifetime of CFP does not decrease in the presence of YFP (Table 1). Calculations made to determine the possibility of energy transfer in solution show that of the acceptor YFP is needed to detect FRET in solution,26 and the YFP concentration was increased only up to in this study. 3.2.CFP/YFP Deposited on Cover Slips with Poly-L-LysineFPs were spread on coverslips previously coated with poly-L-lysine in order to promote protein adsorption. FLIM images were acquired and show large spots of FPs with no well-defined shape (Fig. 2 ). Distribution of lifetimes in these spots is shown in the histogram of Fig. 2. CFP alone displays an average lifetime distribution with a peak at , shorter than in aqueous solution. In the presence of YFP (ratio 1:5 CFP/YFP), the lifetime distribution can be shifted to shorter or longer time scales, depending on the spot. This indicates that deposition of FPs is heterogeneous as regards both shape and proximity between CFP and YFP molecules, despite the use of a spin-coating machine. Most probably, FRET can occur for some areas whereas it does not occur for others, depending on the local concentration of YFP. Fig. 2FLIM images of (a) CFP and (b) CFP/YFP (1:5) spread on coverslips previously coated with poly-L-lysine (PLL). The histogram of lifetimes calculated from FLIM images is shown in (c) for CFP alone (red line, number 1) and for two different depositions of CFP/YFP (1:5) (blue line, number 2). Lifetime distribution for YFP is shown in black (number 3) after deposition of CFP/YFP (1:5). (Color online only.)  A fluorescence decay acquired as a point or an area measurement within the spot and deconvoluted with the instrumental response function reveals in more detail the characteristics of the CFP decay (Table 2 ). It is still a double exponential decay, as in aqueous solution. The average lifetime is shorter compared to the value in aqueous solution due to a decreased amplitude and lifetime of the long component. The fluorescence decay of CFP is sensitive to its immediate environment, and the average lifetime decreases with the increase on the refractive index of the medium.24 When CFP and YFP (ratio 1:5) were jointly spread, the average lifetime of CFP does not change significantly, indicating no FRET. The heterogeneity of the deposition for different spots is also reflected on the large standard deviation observed for the average lifetime of CFP in the presence of YFP . YFP in aqueous solution decays with a single component but when spread on PLL displays clearly two lifetimes of the same magnitude as the ones observed for CFP. However, the average lifetime is longer than that of CFP due to larger amplitude of the long component. Table 2Lifetimes and normalized amplitudes of fluorescent proteins spread on coverslips previously coated with poly-L-lysine (PLL) upon deconvolution with the IRF.
3.3.CFP/YFP in Reverse MicellesDecay of CFP microencapsulated in reverse micelles with a molar ratio of water/surfactant of 5 displays two lifetimes, as in aqueous solution (Fig. 3 ). However, the average lifetime is shorter, as both components are shorter than in aqueous solution. In the presence of more water, i.e., with a water/surfactant molar ratio of 20, CFP decay is still double exponential, but the average lifetime increases to , closer to the value observed in aqueous solution . Fluorescence decays of CFP at low water content systems such as reverse micelles or deposited on PLL matrix are therefore shorter than in aqueous solution, mainly due to a decrease in the long component. Decays of YFP microencapsulated in reverse micelles can be fitted to double exponentials, as observed on coverslips coated with PLL (Fig. 3). The average lifetime of YFP is shorter than in aqueous solution, both for PLL-coated coverslips and reverse micelles, showing that low water content leads to decreased FP lifetimes, whether CFP or YFP. The same behavior was previously observed for the green fluorescent protein in reverse micelles.27 Fig. 3Decays of CFP, YFP, and CFP in the presence of YFP (CFP:YFP molar ratio is 1:5) microencapsulated in reverse micelles of AOT with 5. Lifetimes, amplitudes, and Chi-square values shown on the decay plot and residuals were obtained after deconvolution of the decay with the IRF. 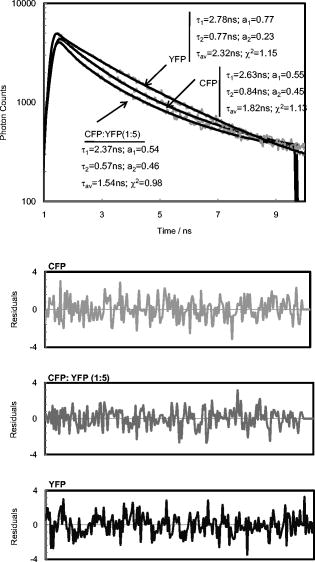 Regarding FRET in reverse micelles with 5, the long component of CFP in the presence of YFP (ratio 1:5 CFP/YFP) decreases, leading to a significant decrease in the average lifetime from (Fig. 3). This clearly indicates the occurrence of FRET when the pair CFP/YFP is microencapsulated in reverse micelles with 5. As expected, the lifetime of CFP decreases more significantly with the increase in the ratio acceptor/donor (Fig. 4 ). Efficiency of FRET increases linearly with the ratio acceptor/donor, reaching more than 20% at a ratio YFP/CFP of 10. Using the equation that relates efficiency of energy transfer with donor acceptor distance26 and the value of for measured in reverse micelles [Eq. 2], the distance between CFP and YFP was calculated. For a ratio YFP/CFP of 1 and 10, the average distance between CFP and YFP is 7.0 and , respectively. FRET was confirmed through steady-state measurements (Fig. 4). Interestingly, FRET occurs only in the water pool of small reverse micelles ( 5), as there is no decrease in the fluorescence intensity or in the lifetime when FPs are encapsulated in large reverse micelles ( 20). Fig. 4Steady-state (a) and time-resolved (b) FRET measurements for the CFP/YFP pair (different molar ratios), microencapsulated in reverse micelles with 5 and 20. Inset in (b): Efficiency of energy transfer calculated from Eq. 3.  Dynamic light scattering was used to evaluate whether the different size of reverse micelles explains the absence of FRET at 20. Empty reverse micelles (no protein) show a single distribution with hydrodynamic radii larger than previously reported values28, 29 due to the use of nondried surfactant and solvent (Table 3 ). Microencapsulation of CFP in reverse micelles with 5 increases the average radius to , as expected due to reorganization of reverse micelles to accommodate the protein28, 29, 30 but a single distribution is still observed (Fig. 5 ). CFP is a cylinder with radius of around and half-height of around . These dimensions justify the size of for CFP-filled reverse micelles, which should account for the water plus the FP volume. At 20, microencapsulation of CFP results clearly in two size distributions. A bimodal distribution accounting for empty and protein-filled reverse micelles was also detected after microencapsulation of other proteins.31 Some reverse micelles remain empty, with hydrodynamic radii close to that measured in the absence of protein, but a new population of very large reverse micelles was detected. CFP molecules microencapsulated in reverse micelles containing more water ( 20) induce the appearance of very large structures, where FP molecules are far enough apart to prevent the occurrence of FRET. Fig. 5Illustration depicting microencapsulation of CFP in reverse micelles of two different sizes ( 5 and 20). Hydrodynamic radii were determined by dynamic light scattering (DLS). Microencapsulation of CFP in reverse micelles with 5 increases the size of reverse micelles from , with being the weighted average size of filled and empty reverse micelles, as DLS has no resolution to discriminate between similar sizes. Microencapsulation of CFP in reverse micelles with 20 leads clearly to a two-size distribution of empty and filled structures containing probably several CFP molecules. The shape of this large structure is undefined (shown by a dotted line), as its size is too large in comparison to common reverse micelles, defined as a thermodynamically stable system composed by spherical structures under dynamic equilibrium.  Table 3Hydrodynamic radius (RH) at the peak of distribution of AOT reverse micelles with no protein and with CFP as measured by dynamic light scattering.
At 5, CFP is sequestered in small reverse micelles. The size of CFP-filled reverse micelles at 5 is not large enough to allow simultaneous encapsulation of both CFP and YFP. The distance between donor and acceptor calculated from FRET efficiency also supports this statement, as the size of filled reverse micelles cannot account for two FP molecules separated from (Fig. 5). Therefore, FRET should result from either micelle encounter, which is diffusion limited, or micelle fusion/fission. Indeed, reverse micelles can collide and fuse their contents temporarily,10 and transient oligomerization was described.32 Exchange rates of reverse micelles are in the order of 33. This value times the reverse micellar concentration ( for 5) gives a rate constant significantly smaller than the fluorescence decay rate constant, meaning that during the lifetime of CFP, the reversed micellar system is close to static. FRET results then from micelle proximity and/or from reverse micelles caught in fusion/fission processes. At 20, reverse micelles are very large, and CFP and YFP molecules incorporated should remain quite far apart. The reverse micelle concentration is significantly lower, and diffusion of reverse micelles must be slower, especially regarding protein-filled reverse micelles. Therefore, the micelle proximity and fusion does not allow the FRET process to occur. 3.4.CFP/YFP Deposited on Coverslips from a Reverse Micellar SolutionFRET measurements used in cell biology studies reveal the spatial distribution of CFP and YFP in the cell, which in most of the cases grow attached to a surface. Assessment of FRET on surfaces is thus of particular interest to the study of cell biology, but as we showed earlier, deposition on a matrix of PLL is heterogeneous and does not allow characterization of the CFP/YFP pair. Since FRET was detected for this pair microencapsulated in small reverse micelles, we have deposited the reverse micellar solution on coverslips and let the organic solvent evaporate. The spherical shape of the water pool of a reverse micelle at 5 allows deposition of FPs as round spots with well-defined contours, a diameter of around , and well separated from each other (Fig. 6 ). By keeping the value constant and increasing the surfactant concentration, which is equivalent to keeping the structure and increasing the number of reverse micelles, it is possible to increase the number of spots on the coverslip. Probably this increase is not linear as single spots should result from reverse micellar coalescence upon solvent evaporation (see the following). At 20 and low concentration of reverse micelles ( of AOT), spots tend to be more diffuse since they result from very large micelles, as proved by the DLS data shown earlier. Again, by increasing the number of reverse micelles, the number of spots increases. Networks of spots were even obtained when the number of reverse micelles is too large ( of AOT), indicating spot coalescence. Measurements of lifetimes reveal FRET from CFP to YFP within the spots obtained at 5 (Fig. 7 and Table 4 ). CFP alone display a lifetime distribution peaked at . In the presence of YFP, the peak distribution decreases to , indicating 11% of FRET efficiency and an average distance of between CFP and YFP. The spherical shape of the water pool of reverse micelles in solution remains upon deposition on coverslips, sequestering CFP and YFP in microdroplets that allow FRET to occur. These round spots should result from coalescence of different water pools, as they are larger than the diffraction limit. Fusion of water pools that allow FRET to occur in liquid reverse micelles may be transformed into static entities upon deposition, and the average distance between CFP and YFP remains approximately constant through the deposition process and solvent evaporation. Deposition from large reverse micelles with 20 does not induce FRET, as observed in solution (Table 4). Deposition of FPs on coverslips from reverse micellar solutions reproduces the FRET pattern observed in solution and constitutes a new controlled way to deposit proteins on surfaces. Fig. 6Fluorescence intensity images of CFP spread on coverslips from a reverse micellar solution with 5 (upper row) and 20 (lower row). The parameter was kept constant, but the surfactant concentration (AOT) was increased from to increase the number of spots. Small picture shows a zoom of one spot obtained from a reverse micellar solution at 5 and of surfactant. All the figures were normalized to have the same contrast to allow comparison of spot intensities. 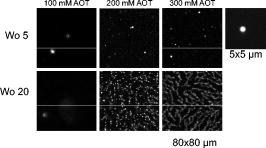 Fig. 7FLIM images of (a) CFP, (b) CFP:YFP (1:5), and (c) YFP spread on coverslips from a reverse micellar solution with 5. The histogram of lifetimes calculated from FLIM images is shown in (d) for CFP alone (red line, number 1), CFP:YFP (1:5) (blue line, number 2) and YFP (black line, number 3). RGB colors were used to scale lifetimes (red for longer and blue for shorter lifetimes) with predominantly blue and green pixels in A and B, and predominantly yellow pixels in C. (Color online only.) 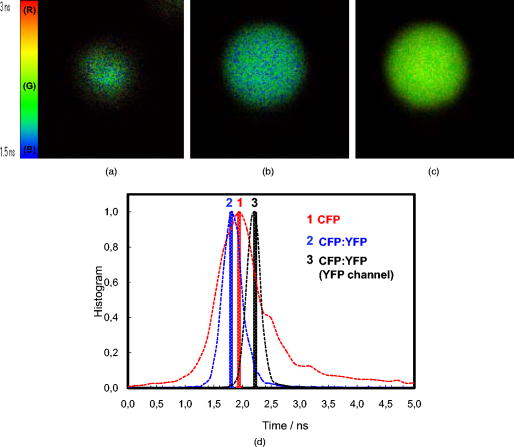 Table 4Average fluorescence lifetimes of cyan and yellow fluorescent proteins deposited on coverslips from a reverse micellar solution at two WO values of 5 and 20, obtained from lifetime histograms of FLIM images.
4.Concluding RemarksPatterning of proteins on solid surfaces is a fundamental phenomenon with implications for nanotechnology, biomaterials, and biotechnological processes. The deposition of cyan and yellow fluorescent protein (CFP/YFP) pairs on coverslips from reverse micellar solutions was followed by the FLIM-FRET technique. Coating solid surfaces with proteins microencapsulated in reverse micellar solutions is a novel procedure that allows deposition of microsized spots of proteins retaining the physicochemical properties that exist in the water pools of reverse micelles. The protein deposition pattern reflects notably the size of the reverse micellar water pool. Small reverse micelles sequester proteins in confined microenvironments, allowing their deposition in close proximity. The FRET pattern observed in solution was reproduced and constitutes a new controlled way to cluster proteins on surfaces. Large reverse micelles, on the contrary, lead to deposition of dispersed protein molecules, and no proximity was detected by FRET. The dependence of protein proximity on the size of reverse micelles was proved for one of the most relevant FRET pairs in cell biology studies, the CFP/YFP pair. FRET is probably the photophysical process mostly used to study biological systems—namely, between interacting partners—due to its high dependence on distance. Its importance as a tool to probe molecular cell-biomaterial interactions has been reviewed recently.34 The novel procedure proposed in this work to deposit proteins on solid surfaces has several advantages. The deposition process is very fast, as the water pools of reverse micelles are forced to settle down on the surface by the evaporation of the solvent, overcoming two key steps on protein adsorption: the slow diffusion of the protein through the bulk (liquid) to the adsorbing surface and the desorption back into the bulk.35 The density of spot distribution can be controlled by changing the concentration of reverse micelles. The close proximity between proteins achieved with deposition of small reverse micelles might be used to study protein–protein interactions on surfaces, yielding critical information on processes involved in many biological systems/solid materials interactions. Clustered distribution of cell adhesion ligands may, for instance, be achieved.36 The conformation of FPs was not affected through the deposition process, and this might be crucial, as adsorption at interfaces often affects protein conformation.37, 38, 39 Hydrophilic proteins microencapsulated in reverse micelles can be included in the water pool, protected from the denaturing effect of the surfactant and organic solvent10, 40 and therefore retaining their native conformation upon deposition on the solid surface. Application of this procedure in the development of novel molecular devices such as biosensors and biomaterials design, where molecular proximity in well-defined areas is important, might be another area of potential interest. It is worth mentioning that delivery of reversed micellar solutions to solid surfaces can be accomplished via spot formation techniques—namely, contact printing methods.41 In conclusion, deposition of proteins from reverse micelles is a novel method that allows patterning of solid surfaces with microsized spots, and notably the size of reverse micelles filled with proteins controls the degree of protein clustering on the solid surface. Proximity between two proteins of around was accomplished with small reverse micelles. AcknowledgmentsThis work was supported by a POCI/CVT/56668/2004 Project grant from Fundação para a Ciência e Tecnologia (FCT), Portugal. Additional funding from FCT through IBB/CBME, LA, Programa Operacional Ciência e Inovação 2010 (POCI 2010), European FEDER Program, and Reequipment Project Reeq115̱2001 is also acknowledged. C. Madeira and N. Estela acknowledge, respectively, a postdoctoral and a doctoral fellowship from FCT, Portugal (SFRH/BPD/18348/2004 and SFRH/BD/18639/2004). The authors thank Prof. Gaspar Martinho and Dr. Telmo Prazeres from Instituto Superior Técnico for the use of dynamic light scattering equipment. ReferencesM. Veiseh, M. H. Zareie, and M. Zhang,
“Highly selective patterning on gold-silicon substrates for biosensor applications,”
Langmuir, 18 6671
–6678
(2002). https://doi.org/10.1021/la025529j 0743-7463 Google Scholar
T. J. Park, S. Y. Lee, S. J. Lee, J. P. Park, K. S. Yang, K. B. Lee, S. Ko, J. B. Park, T. Kim, S. K. Kim, Y. B. Shin, B. H. Chung, S. J. Ku, D. H. Kim, and I. S. Choi,
“Protein nanopatterns and biosensors using gold binding polypeptide as a fusion partner,”
Anal. Chem., 78 7197
–7205
(2006). https://doi.org/10.1021/ac060976f 0003-2700 Google Scholar
X. Jiang, R. Ferrigno, M. Mrksich, and G. M. Whitesides,
“Electrochemical desorption of self-assembled monolayers noninvasively releases patterned cells from geometrical confinements,”
J. Am. Chem. Soc., 125 2366
–2367
(2003). https://doi.org/10.1021/ja029485c 0002-7863 Google Scholar
M. Veiseh, O. Veiseh, M. C. Martin, F. Asphahani, and M. Zhang,
“Short peptides enhance single cell adhesion and viability on microarrays,”
Langmuir, 23 4472
–4479
(2007). https://doi.org/10.1021/la062849k 0743-7463 Google Scholar
L. Giorgetti, G. Bongiorno, A. Podestà, G. Berlanda, P. E. Scopelliti, R. Carbone, and O. Milani,
“Adsorption and stability of streptavidin on cluster-assembled nanostructured films,”
Langmuir, 24 11637
–11644
(2008). https://doi.org/10.1021/la801910p 0743-7463 Google Scholar
R. Y. Tsien,
“The green fluorescent protein,”
Annu. Rev. Biochem., 67 509
–544
(1998). https://doi.org/10.1146/annurev.biochem.67.1.509 0066-4154 Google Scholar
R. M. Siegel, F. K.-M. Chan, D. A. Zacharias, R. Swofford, K. L. Holmes, R. Y. Tsien, and M. L. Lenardo,
“Measurement of molecular interactions in living cells by fluorescence resonance energy transfer between variants of the green fluorescent protein,”
Sci. STKE, 2000
(38), pl1
(2000). https://doi.org/10.1126/stke.2000.38.pl1 1525-8882 Google Scholar
Z.-F. Gan, J.-S. Jiang, Y. Yang, B. Du, M. Qian, and P. Zhang,
“Immobilization of homing peptide on magnetite nanoparticles and its specificity in vitro,”
J. Biomed. Mater. Res., 84 10
–18
(2008). https://doi.org/10.1002/jbm.a.31181 0021-9304 Google Scholar
K. Shinoda and B. Lindman,
“Organized surfactant systems: microemulsions,”
Langmuir, 3 135
–149
(1987). https://doi.org/10.1021/la00074a001 0743-7463 Google Scholar
E. P. Melo, M. R. Aires-Barros, and J. M. S. Cabral,
“Reverse micelles and protein biotechnology,”
Biotechnol. Annu. Rev., 7 87
–129
(2001). https://doi.org/10.1016/S1387-2656(01)07034-X Google Scholar
A. V. Kabanov, N. L. Klyachko, S. N. Nametkin, S. Merker, A. V. Zarova, V. I. Bunik, M. V. Ivanov, and A. V. Levashov,
“Engineering of functional supramacromolecular complexes of proteins (enzymes) using reversed micelles as matrix microreactors,”
Protein Eng., 4 1009
–1017
(1991). https://doi.org/10.1093/protein/4.8.1009 0269-2139 Google Scholar
A. Sadana,
“Protein refolding and inactivation during bioseparation: bioprocessing implications,”
Biotechnol. Bioeng., 48 481
–489
(1995). https://doi.org/10.1002/bit.260480510 0006-3592 Google Scholar
Y. Chen, J. D. Mills, and A. Periasamy,
“Protein localization in living cells and tissues using FRET and FLIM,”
Differentiation, 71 528
–541
(2003). https://doi.org/10.1111/j.1432-0436.2003.07109007.x 0301-4681 Google Scholar
G. Patterson, R. N. Day, and D. Piston,
“Fluorescent protein spectra,”
J. Cell. Sci., 114 837
–838
(2001). 0021-9533 Google Scholar
S. W. Provencher,
“Constrained regularization method for inverting data represented by linear algebraic or integral equations,”
Comput. Phys. Commun., 27 213
–227
(1982). https://doi.org/10.1016/0010-4655(82)90173-4 0010-4655 Google Scholar
S. Fery-Forgues and D. Lavabre,
“Are fluorescence quantum yields so tricky to measure? A demonstration using familiar stationery products,”
J. Chem. Educ., 76 1260
–1264
(1999). 0021-9584 Google Scholar
G. H. Patterson, D. W. Piston, and B. G. Barisas,
“Förster distances between green fluorsecent proteins pairs,”
Anal. Chem., 284 438
–440
(2000). 0003-2700 Google Scholar
M. A. Rizzo, G. Springer, K. Segawa, W. R. Zipfel, and D. W. Piston,
“Optimization of pairings and detection conditions for measurements of FRET between cyan and yellow fluorescent proteins,”
Microsc. Microanal., 12 238
–254
(2006). https://doi.org/10.1017/S1431927606060235 1431-9276 Google Scholar
M. Maus, E. Rousseau, M. Cotlet, G. Schweitzer, J. Hofkens, M. Van der Auweraer, F. C. De Schryver, and A. Krueger,
“New picosecond laser system for easy tunability over the whole ultraviolet/visible/near infrared wavelength range based on flexible harmonic generation and optical parametric oscillation,”
Rev. Sci. Instrum., 72 36
–40
(2001). https://doi.org/10.1063/1.1326930 0034-6748 Google Scholar
P. M. R. Paulo, R. Gronheid, F. C. De Schryver, and S. M. B. Costa,
“Porphyrin-dendrimer assemblies studied by electronic absorption spectra and time-resolved fluorescence,”
Macromolecules, 36 9135
–9144
(2003). https://doi.org/10.1021/ma034844p 0024-9297 Google Scholar
D. M. Togashi, S. M. Costa, and A. J. Sobral,
“Lipophilic porphyrin microparticles induced by AOT reverse micelles: a fluorescence lifetime imaging study,”
Biophys. Chem., 119 121
–126
(2006). https://doi.org/10.1016/j.bpc.2005.08.005 0301-4622 Google Scholar
J. A. B. Ferreira and S. M. B. Costa,
“Activationless nonradiative decay in rhodamines: role of NH and lower frequency vibrations in solvent kinetic isotope effects,”
Chem. Phys., 321 197
–208
(2006). https://doi.org/10.1016/j.chemphys.2005.08.069 0301-0104 Google Scholar
S. M. Andrade, R. Teixeira, S. M. B. Costa, and A. J. F. N. Sobral,
“Self-aggregation of free base porphyrins in aqueous solution and in DMPC vesicles,”
Biophys. Chem., 133 1
–10
(2008). https://doi.org/10.1016/j.bpc.2007.11.007 0301-4622 Google Scholar
J. W. Borst, M. A. Hink, A. van Hoek, and A. J. W. G. Visser,
“Effects of refractive index and viscosity on fluorescence and anisotropy decays of enhanced cyan and yellow fluorescent proteins,”
J. Fluoresc., 15 153
–160
(2005). https://doi.org/10.1007/s10895-005-2523-5 1053-0509 Google Scholar
M. Millington, G. J. Grindlay, K. Altenbach, R. K. Neely, W. Kolch, M. Benčina, N. D. Read, A. C. Jones, D. T. F. Dryden, and S. W. Magennis,
“High-precision FLIM-FRET in fixed and living cells reveals heterogeneity in a simple CFP-YFP fusion protein,”
Biophys. Chem., 127 155
–164
(2007). https://doi.org/10.1016/j.bpc.2007.01.008 0301-4622 Google Scholar
J. R. Lakowicz, Principles of Fluorescence Spectroscopy, Kluwer Academic/Plenum Publishers, New York
(1999). Google Scholar
M. A. Uskova, J. W. Borst, M. A. Hink, A. van Hoek, A. Schots, N. L. Klyachko, and A. J. W. G. Visser,
“Fluorescence dynamics of green fluorescent protein in AOT reversed micelles,”
Biophys. Chem., 87 73
–84
(2000). https://doi.org/10.1016/S0301-4622(00)00184-8 0301-4622 Google Scholar
E. P. Melo, P. Fojan, J. M. S. Cabral, and S. B. Petersen,
“Dynamic light scattering of cutinase in AOT reverse micelles,”
Chem. Phys. Lipids, 106 181
–189
(2000). https://doi.org/10.1016/S0009-3084(00)00152-3 0009-3084 Google Scholar
G. G. Zampieri, H. Jäckle, and P. L. Luisi,
“Determination of the structural parameters of reverse micelles after uptake of proteins,”
J. Phys. Chem., 90 1849
–1853
(1986). https://doi.org/10.1021/j100400a023 0022-3654 Google Scholar
D. Chatenay, W. Urbach, A. M. Cazabat, M. Vacher, and M. Waks,
“Proteins in membrane mimetic systems: insertion of myelin basic protein into microemulsion droplets,”
Biophys. J., 48 893
–898
(1985). https://doi.org/10.1016/S0006-3495(85)83851-0 0006-3495 Google Scholar
E. P. Melo, S. M. B. Costa, J. M. S. Cabral, P. Fojan, and S. B. Petersen,
“Cutinase-AOT interactions in reverse micelles: the effect of 1-hexanol,”
Chem. Phys. Lipids, 124 37
–47
(2003). https://doi.org/10.1016/S0009-3084(03)00031-8 0009-3084 Google Scholar
M. Hirai, R. Kawai-Hirai, S. Yabuki, T. Takizawa, T. Hirai, K. Kobayashi, Y. Amemiya, and M. Oya,
“Aerosol-OT reversed micellar formation at low water-surfactant ratio studied by synchrotron radiation small-angle x-ray scattering,”
J. Phys. Chem., 99 6652
–6660
(1995). https://doi.org/10.1021/j100017a056 0022-3654 Google Scholar
S. S. Atik and J. K. Thomas,
“Transport of photoproduced ions in water in oil microemulsions: movement of ions from one water pool to another,”
J. Am. Chem. Soc., 103 3543
–3550
(1981). https://doi.org/10.1021/ja00402a048 0002-7863 Google Scholar
N. D. Huebsch and D. J. Mooney,
“Fluorescent resonance energy transfer: a tool for probing molecular cell-biomaterial interactions in three dimensions,”
Biomaterials, 28 2424
–2437
(2007). https://doi.org/10.1016/j.biomaterials.2007.01.023 0142-9612 Google Scholar
D. Pellene, R. A. Bennett, R. J. Green, M. Sperrin, and P. A. Mulheran,
“New insights on growth mechanism of protein clusters at surfaces: an AFM and simulation study,”
Langmuir, 24 9648
–9655
(2008). https://doi.org/10.1021/la801246k 0743-7463 Google Scholar
G. Maheshwari, G. Brown, D. A. Lauffenburger, A. Wells, and L. G. Griffith,
“Cell adhesion and mobility depend on nanoscale RGD clustering,”
J. Cell. Sci., 113 1677
–1686
(2000). 0021-9533 Google Scholar
L. Baugh and V. Vogel,
“Structural changes of fibronectin adsorbed to model surfaces probed by fluorescence resonance energy transfer,”
J. Biomed. Mater. Res., 69 525
–534
(2004). https://doi.org/10.1002/jbm.a.30026 0021-9304 Google Scholar
M. F. M. Engel, C. P. M. van Mierlo, and A. J. W. G. Visser,
“Kinetic and structural characterization of adsorption-induced unfolding of bovine -lactalbumin,”
J. Biol. Chem., 277 10922
–10930
(2002). https://doi.org/10.1074/jbc.M106005200 0021-9258 Google Scholar
J. J. Gray,
“The interaction of proteins with solid surfaces,”
Curr. Opin. Struct. Biol., 14 110
–115
(2004). https://doi.org/10.1016/j.sbi.2003.12.001 0959-440X Google Scholar
M. C. R. Shastry and M. R. Eftink,
“Reversible thermal unfolding of ribonuclease in reverse micelles,”
Biochemistry, 35 4094
–4101
(1996). https://doi.org/10.1021/bi952550t 0006-2960 Google Scholar
I. Barbulovic-Nad, M. Lucente, Y. Sun, M. Zhang, A. R. Wheeler, and M. Bussmann,
“Bio-microarray fabrication techniques—a review,”
Crit. Rev. Biotechnol., 26 237
–259
(2006). https://doi.org/10.1080/07388550600978358 0738-8551 Google Scholar
|
|||||||||||||||||||||||||||||||||||||||||||||||||||||||||||||||||||||||||||||||||||||||||


