|
|
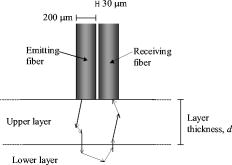
1.IntroductionPathological hyperactivity in central structures in the brain, e.g., the thalamus, globus pallidus, or subthalamic nucleus, plays a central role in some neurodegenerative diseases such as Parkinson’s disease (PD). The symptoms of PD, for example, can be alleviated by thermally coagulating some of the hyperactive neurons with a high frequency current, a procedure called radio-frequency (RF) lesioning,1 or jamming it with electric pulses from an implanted intracerebral electrode in a procedure called deep brain stimulation (DBS).2 RF lesioning, or RF ablation, is an electrosurgical method for thermocoagulation in a wide area of organs, e.g., the brain. RF electrodes with optical fibers in the tip have been developed at the Department of Biomedical Engineering at Linköping University. Such an RF electrode has been used by our group for the creation of trajectories for deep brain stimulation electrodes, while light intensity has been recorded with diffuse reflectance spectroscopy and laser Doppler perfusion monitoring (LDPM).3 Another identical RF electrode has been used for spectroscopy during RF lesioning in ex-vivo porcine brain.4 Identically dimensioned optical probes without RF capability have also been developed and used for intracerebral measurements.5, 6 During surgery in deep brain structures, it is important that the instrument is inserted along a safe trajectory and that the correct target is reached. For reversible procedures such as DBS, electrode implantation postoperative imaging may be sufficient for target verification, but for destructive procedures such as RF lesioning, it is important that the target is verified during the surgery itself. Diffuse optical reflectance methods such as diffuse reflectance spectroscopy, laser Doppler flowmetry, or just pure visual inspection can be used to study different types of tissue in an invasive or noninvasive manner. The amount of reflected light from the brain observed during visual inspection has given name to gray and white matter. Diffuse reflectance techniques can thus be expected to be useful for intracerebral recordings during surgery. Diffuse reflectance spectroscopy has consequently been used to study brain tissue with the aim of verifying correct trajectory during stereotactic surgery.3, 5, 7 Common gray matter structures that may be passed during stereotactic neurosurgery in the central brain are gyri and sulci of the cortex, the caudate nucleus (CN), the thalamus (Tha), the putamen (Put) and the external and internal part of the globus pallidus (GPe and GPi). Blood content can greatly affect the reflected light intensity from tissue, but in our experience it does not seem to have any noticeable impact at the wavelength when using these electrodes or probes.3, 5 From previous studies we have reason to believe that cerebrospinal fluid (CSF) in, e.g., cysts can have an important impact on RF lesioning8 and deep brain stimulation,9 and we are thus interested in methods for detecting them. The Monte Carlo (MC) technique uses a large number of random numbers to solve mathematical problems. In biomedical optics, MC is frequently used to simulate the propagation of photons in arbitrary complex geometries. It is considered the gold standard in this field and is superior to the analytic diffusion approximation, especially when the separation between the light emitting fiber and the light receiving fiber is small, as in the models in this work. For brain tissue, MC simulations have previously been used by others to obtain optical parameters from experimental data10, 11 and to predict changes in reflected light intensity at transitions between gray and white matter.12, 13 The aim of this study was to use MC simulations to predict the reflected light intensity changes from the optical RF electrode and probe at when they pass through gray brain matter, light gray matter, white brain matter, blood, and cerebrospinal fluid, as well as to predict the reflected light intensity during RF lesioning. 2.Materials and Methods2.1.Monte Carlo ModelMC modeling and simulation14 was used to predict the reflected light intensity at . The optical part of the electrode was modeled as two parallel fibers apart (Fig. 1 ). The fibers had a diameter of , a numerical aperture of 0.22, and were assumed to have an index of refraction . One fiber acted as a light source emitting photons with a rectangular distribution from the fiber surface and the other as a receiving fiber. Tissue was modeled as one or two parallel semi-infinite layers. For two-layer models, the upper layer had a variable thickness, (mm). For the models with a CSF layer thicker than , the total thickness of the two layers was . For all other models, the total thickness was . From these depths, no noticeable amount of light was expected to return, since the emitting and receiving fibers were close to each other. The used index of refraction (-), absorption coefficient , scattering coefficient , anisotropy factor (-), and reduced scattering coefficient for the different layers are given in Table 1 . The scattering of light by the tissue increases with the reduced scattering coefficient, which is defined as The Henyey-Greenstein phase function was used to model the scattering angles based on . Single layer models were made for gray matter, coagulated gray matter, thalamic gray matter, coagulated thalamic gray matter, white matter, coagulated white matter, and blood. Standard settings for the optical properties of brain tissue were taken as mean values from a study on human ex-vivo tissue made by Yaroslavsky,10 while compiled data were used for blood.15, 16, 17 Yaroslavsky had also reported the standard deviations of the estimates of , , and for the brain tissues. To show the possible impact of differences between individuals, models were made for brain tissues using measured mean for and mean for , giving more scattering tissue, and mean for and mean for , giving less scattering tissue. Single layer models with randomly mixed white and gray matter were made with 25, 50, and 75 % gray matter. Dual layer models with gray over white matter, white over gray matter, coagulated gray over gray matter, coagulated white over white matter, blood over white matter, and blood over gray matter were made with an upper layer thickness between 0.2 and . Dual layer models with CSF over gray and white matter, respectively, were made with between 0.5 and . In total, 22 single layer and 65 dual layer models were simulated.Table 1Optical parameters used and single layer model results. White matter was used for normalization and the mean for resulting I780 is thus defined as 1. All tissue except cerebrospinal fluid and blood refer to Ref. 10, with the exception of n , which uses Ref. 23. The first row for each tissue type contains means of the measured values. “More scattering” stands for mean +1s.d. for μs and mean −1s.d. for g . “Less scattering” stand for mean −1s.d. for μs and mean +1s.d. for g , e.g., μs=38±3mm−1 and g=0.87±0.01 for white matter ( mean±s.d. , n=7 ). The mean values were used in the simulations unless otherwise explicitly stated.
MC simulations were performed with a program developed at our department.15 Ten simulations were performed for each model with photons emitted in each simulation. 2.2.Data from Clinical MeasurementsDiffuse light reflectance measurements, made during the creation of trajectories for DBS electrodes,3 were used for comparison with the simulation results. The surgeon had inserted the optical RF electrode, with as even speed as possible, from the cortex toward the central brain targets globus pallidus internus (GPi), the subthalamic nucleus (STN), or the zona incerta (ZI) adjacent to the STN. During the insertion, the reflected light intensity at had been measured using either a laser Doppler perfusion monitoring system or a spectroscopy system. Using pre- and postoperative MRI and CT, the neurosurgeon had noted the structures in the brain that were passed during the insertions. All intensities had been normalized with the mean intensity from subcortical white matter in the corresponding trajectory (Fig. 2 ), giving dimensionless, normalized intensities (-). For details of the clinical study, see Ref. 3. Fig. 2Example of clinical measurement in brain.3 The reflected light intensity from subcortical white matter was used as reference intensity. Intensities from gray matter structures were taken from their minimum values. 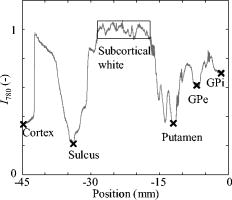 2.3.Data AnalysisThe numbers of detected photons in the simulations were normalized with the mean number of detected photons for simulated native white matter using the standard setting. This gave normalized intensities in a similar way as in the clinical measurements. Mean values and 95 % double-sided confidence intervals for were calculated for each model. For the layered models, a detectability thickness (mm) was calculated as an estimate of the minimum thickness needed for the upper layer to have any substantial impact on . Similarly, a look-ahead distance,12 (mm), was calculated as an estimate of the allowed maximal thickness of the upper layer for the underlying tissue to have any substantial impact on . and were based on a deviation of two times the average measured standard deviation within subcortical white matter compared to the intensities from the single layer simulations of corresponding tissue from the upper and lower layers respectively. The average measured standard deviation within subcortical white matter had been found to be 0.035 in the previous clinical study,3 giving: Cubic interpolation was used to estimate for thicknesses between the simulated ones. Homogeneous CSF was assumed to give a reflected light intensity of . All data analysis was performed using MatLab 7.5 (MathWorks Incorporated, Natick, Massachusetts).3.ResultsSimulation results for single layer models are presented in Table 1 and Fig. 3, where comparisons with clinical measurements also are presented. Simulated was highest for white matter , lower for thalamus , even lower for blood , and lowest for gray matter . Fig. 3Reflected light intensity for gray matter, thalamus, and white matter. MN: measured native tissue,3 SN: simulated native tissue. SC: simulated coagulated tissue. The bars show deviation for measured lowest values from gray matter and thalamus , and standard deviation for white matter . For simulated values, the bars show results for less and more scattering (Table 1) instead. Mean for measured and native white matter is defined as 1, and thus does not indicate identical results. 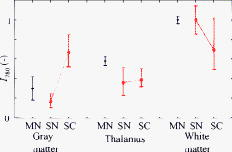 Results for randomly mixed and dual layer models of gray and white matter are presented in Fig. 4 . Results for dual layer models with CSF over gray and white matter are presented in Fig. 5a, and for blood over gray and white matter in Fig. 5b. Detectability thickness and look-ahead distance for dual layer models are presented in Table 2 . for the optically scattering layers ranged between for white over gray matter to for blood over gray matter, while ranged between 0.11 for blood over gray matter to for gray over white matter. for CSF layers was 2.3 and , while was 3.0 and over gray and white matter, respectively. For increasingly thick layers of CSF over gray or white matter, simulated first increased to reach a maximum around , and then decreased as the distance to the brain tissue increased. Fig. 4Simulated light intensity from mixes of gray and white matter. Circles and squares mark simulated values and the lines show the cubic interpolation between them. (a) Random mixed tissue, from pure white to pure gray. (b) Layered mixed tissue. Dashed lines show detectability thickness and look-ahead distance based on a deviation of two s.d. of for white matter. With this threshold, a gray structure approached in white matter should be detectable if it is at least thick, and a sufficiently thick gray structure should be detectable within a distance of . 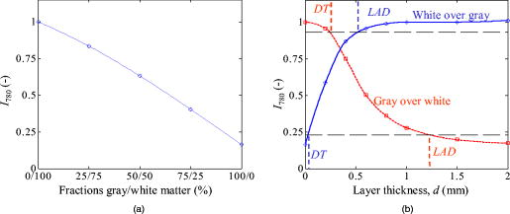 Fig. 5(a) CSF over gray and white matter. (b) Blood over white and gray matter. Circles and squares mark simulated values and the lines show the cubic interpolation between them. 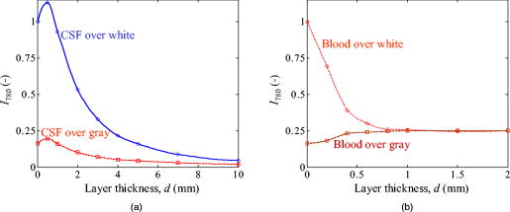 Table 2Detectability thickness (DT) and look-ahead distance (LAD) from the dual layer simulations.
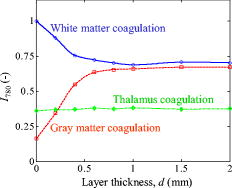
Results for dual layer models of coagulation in gray and white matter are presented in Fig. 6 . When the tissue is coagulated, simulated values of decrease from unity to 0.70 in white matter, increase from 0.16 to 0.67 in gray matter, and increase slightly from 0.36 to 0.39 in the thalamus. The changes in for coagulation in thalamus were too small to give any or . 4.DiscussionWe have used MC simulations to predict reflected light intensity changes in native and coagulated brain tissue at the wavelength . It must be stressed that the results in this study only are directly applicable to this wavelength and the optical fiber configuration used here. A probe with another configuration of the optical fibers may behave differently and the results may be different for other wavelengths, especially beneath where absorption from blood is high. Similar wavelengths and configurations should give similar results. Apart from allowing the most compact design, the fibers in the modeled probe are placed adjacently to give the largest contrast between tissues with different scattering properties and the smallest impact from the absorption. If a larger fiber separation was to be used, the differences in reflected light intensity from gray, light gray, and white matter are expected to decrease. For a sufficiently large fiber separation, the amount of light reflected from gray matter is even expected to be greater than from white matter, as light does not travel as far in a medium with a high as in a medium with a lower and equal absorption. The wavelength was chosen due to the low absorption from both blood and water between about 650 and , and as it is commonly used in laser Doppler flowmetry systems. Other wavelengths between 650 and should work approximately equally well. A lower reflected light intensity is expected for longer wavelengths in all tissue types, as decreases with wavelength in this range.10 Regarding discrimination between gray and white matter, we have not noticed any additional information from multiple wavelengths during in-vivo spectroscopic measurements in the brain.3 Multiple wavelengths are of interest if chromophore content, such as the amount of blood or lipofuscin, is to be studied. The simulations predict somewhat less light from gray matter than what the measurements3 gave . The cortex is only thick. From the layered models with gray over white matter, we would expect this to be sufficient to be seen as pure gray matter by the electrode [Fig. 4b]. However, the cortex could be compressed somewhat by the pressure of the electrode when the measurement started. The measurements from sulci were in better agreement with the simulations , although it is possible that the electrode was moved through some CSF. If there is enough CSF ahead of the underlying gray matter, the layered simulations predict a reduced reflected light intensity. The simulation results for the thalamus also predict less reflected light than actually was found in the clinical studies ( , ).3 A possible explanation for this is that the clinical measurements only have been performed in the lateral part of the thalamus. Myelin staining of histological sections of the thalamus shows a higher myelin fraction in the lateral part of the thalamus than the medial part.18 The clinical measurements are thus not representative for the entire thalamus. It would be of great interest to make measurements of the optical properties of the lateral part of the thalamus and the globus pallidus. As always in simulation studies, it is also possible that the discrepancies are due to unknown inaccuracies in the model. Particular difficulties associated with the measurements of the optical properties of tissue are tissue heterogeneity and possible changes after death. For example, the used values of or for white matter could be too high or low respectively, giving too much reflected light in the simulations. The concept of a look-ahead distance is taken from a study by Qian on dual layer models.12 Their definition was based on deviations from twice the standard deviation when only viewing one tissue type; a logical choice when dealing with measurements. When using MC simulations, however, the standard deviation in homogeneous tissue will depend on the number of photons used rather than the variability of the optical properties within a tissue type. Thus, we opted for using a fixed level based on twice the measured standard deviation within subcortical white matter instead. Detectability distance and look-ahead distance were shorter for white over gray matter ( , ) than for gray over white matter ( , ) as a result of the higher scattering of white matter. The short for white over gray matter indicates that thin white matter structures, such as the lamina between the putamen and the globus pallidus, should be readily detectable. This has also been found to be possible in practice.3, 13 Small gray structures may be harder to detect. It is also possible that boundaries at an oblique or parallel angle to the optical fibers may cause less distinct changes in than the orthogonal boundaries modeled in this study. When used for navigation, a measured light intensity between the values for gray and white matter does not in itself reveal whether gray over white matter, white over gray matter, or light gray matter is viewed. should thus preferably be measured continuously along the trajectory to the point of interest, rather than just measured in a single point. The simulations predict small changes in reflected light intensity from thalamic tissue, as can be expected from the small difference in measured values of the optical properties between native and coagulated thalamic tissue. is thus probably not suitable for the detection of coagulation in the human thalamus, although a small but significant increase of reflected light intensity from porcine thalamus when coagulated in vitro has been found.19 The other common targets for RF lesioning in the brain, the globus pallidus and subthalamic nucleus, are also paler than cortical gray. Thus, may be unsuitable there, too. A possibility could be that other wavelengths are more suitable, although our experience is that the changes of the reflected light intensity are similar in the entire range during thermocoagulations.4 Different changes could be expected for absorption at different wavelengths, but the short fiber separation gives a reflected light intensity that primarily is affected by the scattering properties of the tissue. A better alternative for coagulation monitoring is probably LDPM, which measures a perfusion signal from Doppler shifts of light scattered in moving tissue, usually assumed to mainly be moving red blood cells. The perfusion signal from LDPM has been shown to decrease after coagulation, as would be expected when the blood is thermocoagulated.20 Lack of changes in optical parameters during coagulation is actually beneficial for LDPM, as such changes complicate the interpretation of the perfusion signal. A drawback of LDPM is that the elevated temperature causes a rather large artifact during the RF lesioning itself due to thermal or thermally induced motion in the tissue. It is thus not expected to be useful during the lesioning itself. The simulations predict that white matter should reflect less light after coagulation. Our experimental comparisons with RF lesioning in porcine brain in vitro have been inconclusive regarding this. Sometimes the white matter has become darker (unpublished data), but no consistent decrease in reflected light intensity has been found for coagulation with the electrode modeled here.4 It is possible that the composition of different brains differs. It would thus be of interest to compare, e.g., fat and myelin content in brain tissue with the optical changes during coagulation for a number of brains. Another possibility is that the duration of heating matters, as heating can cause loss of water from the tissue over time, even if is not reached. For example, Haemmerich 21 noticed some water loss from liver when it was heated to for several minutes, but not when it was heated to . During RF lesioning, we use heating durations around while the tissue used by Yaroslavsky for determination of the optical properties used in this work had been coagulated for .10 Water loss can thus be expected to have a greater impact in the latter case. A very slight darkening of ex vivo porcine white matter coagulated by laser irradiation for has been found by Schulze 22 On the other hand, Jaywant found to remain fairly unchanged during slow heating of ex vivo bovine white brain matter.11 The short detectability thicknesses and look-ahead distances for coagulated gray ( , ) and white matter ( , ) indicate that the reflected light intensity should detect coagulation around the electrode tip quite instantaneously. However, it is not expected to be useful for estimation on how far away from the electrode tip the coagulation zone extends, as will not change much once the RF lesion extends beyond . If such an objective is desired, one or more additional detector fibers should be added in the electrode further away from the light emitting fiber. This will, however, make the manufacturing of an electrode with optical fibers more complicated, and improved may be hampered by a reduced contrast from scattering and an overall reduced reflected light intensity due to the greater fiber separations. CSF is of particular interest to us, as simulation studies indicate that its presence can affect both DBS9 and RF lesioning.8 The results from this study predict that a sufficiently large amount of CSF ahead of the electrode should give a considerable decrease in [Fig. 5a]. However, it seems layers need to be more than thick to be detectable with the wavelength and fiber configuration used here. There is even a local maximum of for , as some light is reflected in the boundary between CSF and brain matter due to the difference in the index of refraction. It is not certain that such a local maximum will be present in a clinical measurement, as the approached surface probably is not orthogonal to the optical fibers as in the model. Further, the reflection will be more diffuse if the surface is rough. In conclusion, the simulations predict that the modeled electrode will perceive shades of gray in a similar fashion as the human eye does, and this is in agreement with clinical measurements. The light intensity is not expected to be suitable for the detection of coagulation in thalamus. Coagulation in gray or white matter on the other hand should be detected quite instantaneously through an increase or decrease, respectively, in reflected light intensity. More research is needed, however, on whether this also will hold true for actual clinical lesioning. AcknowledgmentsWe would like to thank Patric Blomstedt at Norrland’s University Hospital, Umeå, Sweden, for the medical image analysis. The study was supported by the Swedish Governmental Agency for Innovation Systems (Vinnova), the Swedish Foundation for Strategic Research (SSF), and the Swedish Research Council (VR). ReferencesE. Cosman,
“Radiofrequency lesions,”
Textbook of Stereotactic and Functional Neurosurgery, 973
–985 Quebecor Printing, Kingsport, Quebec
(1996). Google Scholar
A. L. Benabid,
“Deep brain stimulation for Parkinson’s disease,”
Curr. Opin. Neurobiol., 13 696
–706
(2003). https://doi.org/10.1016/j.conb.2003.11.001 0959-4388 Google Scholar
J. D. Johansson, P. Blomstedt, N. Haj-Hosseini, A. T. Bergenheim, O. Eriksson, and K. Wårdell,
“Combined diffuse light reflectance and electric impedance measurements for navigation aid in deep brain surgery,”
Stereotact. Funct. Neurosurg., 87 105
–113
(2009). https://doi.org/10.1159/000202977 1011-6125 Google Scholar
J. D. Johansson, A. Zerbinati, and K. Wårdell,
“Diffuse reflectance spectroscopy during experimental radio frequency ablation,”
371
–374
(2008). Google Scholar
J. Antonsson, O. Eriksson, P. Blomstedt, A. T. Bergenheim, M. I. Hariz, J. Richter, P. Zsigmond, and K. Wårdell,
“Diffuse reflectance spectroscopy measurements for tissue-type discrimination during deep brain stimulation,”
J. Neural Eng., 5 185
–190
(2008). https://doi.org/10.1088/1741-2560/5/2/009 1741-2560 Google Scholar
K. Wårdell, P. Blomstedt, J. Richter, J. Antonsson, O. Eriksson, P. Zsigmond, A. T. Bergenheim, and M. I. Hariz,
“Intracerebral microvascular measurements during deep brain stimulation implantation using laser Doppler perfusion monitoring,”
Stereotact. Funct. Neurosurg., 85 279
–286
(2007). https://doi.org/10.1159/000107360 1011-6125 Google Scholar
C. A. Giller, M. Johns, and H. L. Liu,
“Use of an intracranial near-infrared probe for localization during stereotactic surgery for movement disorders,”
J. Neurosurg., 93 498
–505
(2000). https://doi.org/10.3171/jns.2000.93.3.0498 0022-3085 Google Scholar
J. D. Johansson, D. Loyd, K. Wårdell, and J. Wren,
“Impact of cysts during radiofrequency lesioning in deep brain structures—a simulation and in vitro study,”
J. Neural Eng., 4 87
–95
(2007). https://doi.org/10.1088/1741-2560/4/2/009 1741-2560 Google Scholar
M. Åström, J. D. Johansson, M. I. Hariz, O. Eriksson, and K. Wårdell,
“The effect of cystic cavities on deep brain stimulation in the basal ganglia: a simulation-based study,”
J. Neural Eng., 3 132
–138
(2006). https://doi.org/10.1088/1741-2560/3/2/007 1741-2560 Google Scholar
A. N. Yaroslavsky, P. C. Schulze, I. V. Yaroslavsky, R. Schober, F. Ulrich, and H. J. Schwarzmaier,
“Optical properties of selected native and coagulated human brain tissues in vitro in the visible and near infrared spectral range,”
Phys. Med. Biol., 47 2059
–2073
(2002). https://doi.org/10.1088/0031-9155/47/12/305 0031-9155 Google Scholar
S. Jaywant, B. Wilson, M. Patterson, L. Lilge, T. Flotte, J. Woolsey, and C. McCulloch,
“Temperature dependent changes in the optical absorption and scattering spectra of tissues: correlation with ultrastructure,”
Proc. SPIE,
(1993)
(0277-786X) Google Scholar
Z. Qian, S. V. Sunder, G. Yeqing, C. A. Giller, and H. L. Liu,
“Look-ahead distance of a fiber probe used to assist neurosurgery: phantom and Monte Carlo study,”
Opt. Express, 11 1844
–1855
(2003). 1094-4087 Google Scholar
C. A. Giller, H. L. Liu, P. Gurnani, S. Victor, U. Yasdani, and D. C. German,
“Validation of a near-infrared probe for detection of thin intracranial white matter structures,”
J. Neurosurg., 98 1299
–1306
(2003). https://doi.org/10.3171/jns.2003.98.6.1299 0022-3085 Google Scholar
L. Wang, S. L. Jacques, and L. Zheng,
“MCML--Monte Carlo modeling of light transport in multi-layered tissues,”
Comput. Methods Programs Biomed., 47 131
–146
(1995). https://doi.org/10.1016/0169-2607(95)01640-F 0169-2607 Google Scholar
I. Fredriksson, M. Larsson, and T. Strömberg,
“Optical microcirculatory skin model: assessed by Monte Carlo simulations paired with in vivo laser Doppler flowmetry,”
J. Biomed. Opt., 13 014015
(2008). https://doi.org/10.1117/1.2854691 1083-3668 Google Scholar
A. Roggan, M. Friebel, K. Dörschel, A. Hahn, and G. Müller,
“Optical properties of circulating human blood in the wavelength range 400-2500 NM,”
J. Biomed. Opt., 4 36
–46
(1999). https://doi.org/10.1117/1.429919 1083-3668 Google Scholar
A. M. Enejder, J. Swartling, P. Aruna, and S. Andersson-Engels,
“Influence of cell shape and aggregate formation on the optical properties of flowing whole blood,”
Appl. Opt., 42 1384
–1394
(2003). https://doi.org/10.1364/AO.42.001384 0003-6935 Google Scholar
M. N. Gallay, D. Jeanmonod, J. Liu, and A. Morel,
“Human pallidothalamic and cerebellothalamic tracts: anatomical basis for functional stereotactic neurosurgery,”
Brain. Struct. Funct., 212 443
–463
(2008). https://doi.org/10.1007/s00429-007-0170-0 Google Scholar
O. Eriksson and K. Wårdell,
“Optical changes as a marker for lesion size estimation during radio frequency ablation: a model study,”
Biomed. Diag., Guidance, Surgical-Assist Syst. 3, 164
–171 2001). Google Scholar
J. Antonsson, O. Eriksson, P. Lundberg, and K. Wårdell,
“Optical measurements during experimental stereotactic radiofrequency lesioning,”
Stereotact. Funct. Neurosurg., 84 118
–124
(2006). https://doi.org/10.1159/000094463 1011-6125 Google Scholar
D. Haemmerich, I. dos Santos, D. J. Schutt, J. G. Webster, and D. M. Mahvi,
“In vitro measurements of temperature-dependent specific heat of liver tissue,”
Med. Eng. Phys., 28 194
–197
(2006). https://doi.org/10.1016/j.medengphy.2005.04.020 1350-4533 Google Scholar
P. C. Schulze, T. Kahn, T. Harth, H. J. Schwurzmaier, and R. Schober,
“Correlation of neuropathologic findings and phase-based MRI temperature maps in experimental laser-induced interstitial thermotherapy,”
J. Magn. Reson Imaging, 8 115
–120
(1998). https://doi.org/10.1002/jmri.1880080123 1053-1807 Google Scholar
A. Roggan,
“Dosimetrie thermischer laseranwendungen in der medizin,”
(1997). Google Scholar
|


