

|
|
1.IntroductionThe knowledge of the absorption properties of biological tissues can provide diagnostically useful pieces of information. Due to the strong attenuation of light in other spectral ranges, data are often collected in the near IR, between 700 and , where the two forms of hemoglobin are generally regarded as the main absorbers. In some cases, however, even longer wavelengths are investigated, to include the absorption peaks of lipids at and water at . Collagen is a main constituent of soft and hard tissues, and in particular of breast tissue. Specifically, breast stroma includes various extracellular matrix proteins, and fibrillar collagens are perhaps the most important in determining stromal architecture.1 In turn, alterations of stromal architecture and composition are a well-known aspect of both benign and malignant pathologies, and may play an initial role in breast carcinogenesis. 2 Recently, studies performed on mammary tumors in mice showed that increased collagen density increases tumorigenesis, local invasion, and metastatic character, proving a causal link between stromal collagen and tumor formation and progression.3 Thus, collagen could have significant relevance for breast cancer detection. Moreover, changes in mammographic density are expected to reflect stromal changes, and thus collagen content is likely to correlate with breast density.1 Optical data interpreted using principal component analysis have already shown a strong correlation with quantitative mammographic features.4 The quantification of collagen content based on optical measurements could provide a noninvasive means for the direct assessment of breast density, which presently requires the use of ionizing radiation (x-ray mammography). For diagnostic purposes, it is also interesting to note that high breast density is a recognized risk factor for developing breast cancer.5, 6 Thus, the noninvasive identification of subjects with mammographically dense breasts could be diagnostically relevant. Finally, it has recently been observed that collagen in high-density breasts has different features as compared with collagen in low-density breasts,7 again stressing the potential interest of collagen for diagnostic purposes. All this notwithstanding, the optical properties of collagen are not known from the literature and its contribution to the overall absorption of tissue is generally neglected when optical data are interpreted with the Beer law to derive information on tissue composition. Only recently we have performed initial measurements for the optical characterization of collagen, collecting time-resolved transmittance data8 from collagen type I powder between 610 and . The measured absorption line shape suggested that spectral features potentially useful for the quantification of collagen in tissues could be observed at even longer wavelengths. Actually, the presence of specific spectral features (e.g., a sharp distinct peak) within the observation range would make the procedure for the estimate of tissue composition from absorption data more robust, and it would be of special value when measurements are necessarily restricted to a few selected wavelengths, as typically occurs for diagnostic imaging purposes (e.g., optical mammography). Recently, differences were observed in the spectral shape and position of the absorption peak of free versus bound water around . It was suggested that such spectral differences could be exploited to discriminate tumor from normal breast tissue.9 More generally, several spectral shifts in the absorption features of malignant versus healthy breast tissue were detected in the range of , and attributed to C–H bonds of lipids and O–H bonds of water and lipids oxidation products. 10 In the past, breast tissue spectroscopy has never investigated thoroughly the range between 1000 and . Above , the absorption of water and oxy- and deoxyhemoglobin decreases for increasing wavelengths, while the reverse occurs for lipids and collagen, which both show peaks right after . Consequently, at even longer wavelengths the overall tissue absorption could decrease, improving the feasibility of in vivo measurements and giving a new prospect to the diagnostic application of breast spectroscopy. The aim of this study was to determine whether operation in the range of could effectively be performed in vivo on breast tissue, and to start investigating whether the collected information could profitably be used for breast tissue characterization and identification of pathologies. To this purpose, our instrumentation for time-resolved diffuse spectroscopy11 was modified to enable measurements to be performed continuously up to longer wavelengths . The upgraded setup was then used to extend the optical characterization of collagen powder and perform an accurate measurement of the absorption properties of lipid over the extended interval . Finally, the first in vivo absorption and scattering spectra of breast tissue were measured from 10 healthy volunteers in the same spectral range. 2.Materials and Methods2.1.Experimental SetupThe system is fully automated for what concerns both data acquisition and analysis. Figure 1 shows a scheme of the setup. The previous version of our instrumentation for time-resolved diffuse spectroscopy operated between 610 and , relying on a synchronously pumped dye laser and on an actively mode-locked Ti:sapphire laser11 . For this study, the setup was upgraded to enable measurements to be performed continuously from . Both the optics and the alignment of the Ti:sapphire laser were modified to optimize its operation in the region beyond . Now it is used to provide picosecond pulses from . To cover shorter wavelengths, a supercontinuum fiber laser was introduced. Wavelength selection is achieved through the computer-controlled rotation of a Pellin-Broca prism, so that the selected wavelength can be extracted from the dispersed light by coupling it into a fiber optic, placed distal to the prism. 12 Typically data are acquired on the full available range for both sources ( for the fiber laser and for the Ti:sapphire laser). The exact extension of the Ti:sapphire data set that is used for further data interpretation can be slightly adjusted, depending on the specific experiment to be performed, for best balance between spectral resolution and available power, as shown in Sec. 3. Fig. 1Setup of the system for time-resolved transmittance spectroscopy: CW Argon, continuous wave argon laser; MC, monochromator; MCP PMT; microchannel plate photomultiplier tube; TCSPC; PC board for time-correlated single-photon counting.  Optical fibers deliver the illumination light to the sample and collect the diffusely transmitted or reflected light. Time-correlated single-photon counting is used for the detection of the reemitted pulses.11 The overall time resolution of the system varies between 70 and , depending on wavelength. For this study, time-resolved data were collected every , with an acquisition time of /wavelength with the supercontinuum fiber laser and /wavelength with the Ti:sapphire laser. 2.2.Spectroscopy of Tissue ConstituentsCollagen type I powder from bovine achilles tendon (Sigma-Aldrich) was placed in a black cylindrical container ( diameter, height), gently pressed to reach a sample density of , and measured in transmittance geometry, with the line of sight between the injection and collection points set along the cylinder axis (thickness of measured ). Purified pork fat (lard) was melted to fill a tank. After solidifying at room temperature, measurements were performed in reflectance geometry with an interfiber distance of , to provide good signal level and satisfy the hypotheses of the diffusion approximation. Repeated measurements were performed on both samples. 2.3.In Vivo Spectroscopy of Breast TissueTen healthy volunteers were enrolled (ages 26 to 63). Mild breast compression between parallel plates was applied (thickness range of compressed breast , median ). As already mentioned, using a suitable combination of both laser sources, measurements were performed from in transmittance mode through the central breast region. Data were collected from both breasts. Informed consent was obtained from all volunteers. 2.4.Data AnalysisThe values of the absorption and reduced scattering coefficients at each wavelength were estimated by fitting the time distributions to an analytical solution of the diffusion approximation (with the extrapolated boundary condition) for an infinite slab.13, 14 Information on tissue composition and structure was obtained directly from time-resolved transmittance curves measured at all wavelengths The Beer law was used to relate the absorption properties to the concentrations of the main tissue constituents. The scattering properties were modeled through a simple approximation to Mie theory: , where and is the scattering coefficient15, 16 . The experimental data were globally best fitted with a spectrally constrained fitting procedure. 17 Free parameters of the fitting were the concentrations of oxy- and deoxyhemoglobin18 ( and Hb, respectively), water,19 lipids, and collagen, together with scattering amplitude and power . 3.Results and DiscussionTo investigate the potential of breast spectroscopy in the wavelength interval between 1000 and , we modified our setup for time-resolved transmittance and reflectance spectroscopy. A supercontinuum fiber laser and a mode-locked Ti:sapphire laser are now used to cover continuously wavelengths from . Actually, the supercontinuum fiber laser can provide good power levels over the entire range. However, wavelength selection relies on dispersion within a prism and it is thus affected by the spectral dependence of material dispersion. Actually, the source bandwidth increases with wavelength from at at , and to approximately at . As recently shown,20 a wide source bandwidth can cause significant underestimation of the absorption values as well as distortion of nonsymmetrical absorption line shapes. These effects are more marked when sharp absorption peaks are measured, namely, where the absorption changes rapidly with wavelength. As an example, Fig. 2 shows the absorption spectrum measured in vivo from the breast of a healthy volunteer using both the supercontinuum fiber laser over the entire wavelength range and the Ti:sapphire laser above . As is evident from the figure, the estimate of the absorption peak of lipids at is strongly affected by the large bandwidth of the fiber laser. Accordingly, the former source was typically used for wavelengths , and the latter for longer wavelengths, where sharper peaks are expected. However, above the Ti:sapphire laser is close to the edge of its lasing range, and its use is critical, especially for in vivo measurements, due to marked instability and limited day-to-day reproducibility of its performances. As shown in the following, independent of breast type the overall tissue absorption does not vary markedly over , and consequently, its estimate is not significantly affected by laser bandwidth problems. Thus, the fiber laser can effectively be used between 1070 and when needed to obtain reliable in vivo data up to , and it was actually used for the in vivo measurements of this study. Fig. 2Absorption spectra of the breast of a healthy volunteer, as obtained from measurements performed with the two available laser sources. The effect of the laser bandwidth is evident in the estimate of the sharp absorption peak of lipids at .  Our final goal is to investigate the potential of long wavelengths for diagnostic purposes. This involves the measurement of tissue optical properties and their interpretation in terms of tissue composition and structure to derive diagnostically relevant pieces of information. Thus, as an initial step, the optical characterization of collagen powder was extended toward longer wavelengths with respect to previously available data.8 Figure 3 displays the absorption spectrum measured from collagen type I powder. A main absorption peak is identified around . This represents a rather sharp spectral feature that could prove useful for the quantification of collagen from in vivo absorption data. The other features in the wavelength range of observation are a fairly steep decrease in absorption for increasing wavelengths below and a minor absorption peak at , in agreement with what was observed previously. The scattering properties of collagen were also estimated. Specifically, the reduced scattering coefficient is rather high and decreases only slightly with wavelength, approximately from moving from . However, this piece of information cannot be directly applied for the interpretation of in vivo data, as the different structure of collagen in physiologic conditions is expected to lead to different scattering properties as compared to the powder that was object of the present study. The choice of collagen type I of bovine origin was motivated by the need to deal with a large amount of substance (namely, a few tens of grams), to enable a reliable interpretation of the collected data within the diffusion approximation for an infinite medium. In human breast tissue, collagen type I represents 70% of the total collagen content. However, collagen type III is also abundant21 (25%). It should be taken into account that currently no specific information is available to state that collagen of different origin (human versus bovine) and/or type (type III versus type I) have similar absorption properties. The absorption properties of lipid of animal origin had already been measured previously. At long wavelengths, however, the estimated absorption data were affected by a significant spread.22 By means of the upgraded setup we can now reliably assess the absorption properties of lipid up to by means of time-resolved diffuse spectroscopy. Measurements were performed at room temperature on purified pork fat (lard). The sample was in solid form and was characterized by reduced scattering coefficient decreasing approximately from over the wavelength range of observation. Similar to what was already mentioned for collagen, the scattering spectrum of the pure lipid cannot be directly related to in vivo data, also due to its strong dependence on temperature. Figure 4 reports the estimated absorption spectrum of lipid. The absorption line shape shows the characteristic sharp peak at . A secondary absorption peak is also present at . Around , the absorption seems to reach a minimum and then start increasing again toward longer wavelengths. For wavelengths up to approximately , the absorption spectrum of lipid is similar to what previously published. 22 However, at longer wavelengths the absorption values measured in the present study are lower and the difference increases with wavelength, becoming very marked at ( against ). Comparing Figs. 3 and 4, we see that between 900 and , both collagen and lipid show an absorption peak. A similar situation occurs between 1000 and . The absorption features of collagen and lipid are spectrally close, but not fully overlapped. Moreover, their spectral shape is significantly different. Finally, the relative weight of the two peaks is different for collagen and lipid: the feature at longer wavelengths is dominant for collagen, while the reverse occurs for lipids. Thus, at least in principle, the long-wavelength range could profitably be exploited to better determine the contribution of the two constituents to breast tissue composition. Clearly, this is only possible if reliable optical measurements can effectively be performed in vivo on breast tissue. First, measurement feasibility relies on obtaining adequate signal levels within an acceptable acquisition time. Tissue composition can vary significantly with age and even more markedly with breast type, strongly affecting this key aspect. To investigate it, time-resolved transmittance measurements were performed on 10 healthy volunteers of different ages and breast parenchymal patterns. Since our final goal is to explore the potential application and benefits of long wavelengths with specific attention to optical mammography, in vivo data were collected in compressed breast geometry, the same as used in our setup for breast imaging. 23 Figure 5 displays examples of absorption spectra obtained from three healthy volunteers. For two of them, labeled “#2—Fibrous” and “#10—Adipose,” the parenchymal pattern was determined based on x-ray mammograms. Tabàr classification24 ranks the former subject as type IV (dominated by prominent linear and nodular densities) and the latter one as type II (dominated by adipose tissue). X-ray mammograms were not available for the third subject (#3). In that case, the breast type was assumed to be “mixed” based on its absorption line shape, which suggests intermediate content of water (at ) and lipids (at ), as compared to the other two subjects. Lipid is responsible for the absorption peak that is clearly detected at in the adipose breast, while the collagen contribution can barely be revealed as a shoulder on the trailing edge of the water peak of the fibrous breast and cannot be visually appreciated in the case of the adipose breast. Besides the major absorption peaks, other minor details reveal differences in the relative weight of water and lipid content for different breast types. Specifically, the absorption peak around is sharper when lipids are dominant (e.g., subject 10), while it looks broader when the water content is high and absorbs appreciably even at those wavelengths. Finally, stronger absorption at short wavelengths generally suggests higher hemoglobin content, with the deoxygenated (oxygenated) form dominating below (above) . For some subjects, however, also collagen can contribute noticeably to the overall tissue absorption in the range . Fig. 5Absorption spectra measured in vivo from the breasts of three healthy volunteers with different breast types. 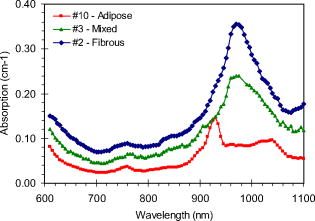 Even though the overall tissue absorption above is generally lower than between 900 and , most important constituents absorb significantly in that region. Specifically, the trailing edge of the absorption peak of water at gives a nonnegligible contribution up to , even for clearly adipose breasts. Similarly, the broad absorption band of oxyhemoglobin still contributes appreciably. Deoxyhemoglobin is the only main constituent that absorbs negligibly. However, its contribution can easily be evaluated at shorter wavelengths, and in particular below , where it generally dominates. As already mentioned, the quantification of lipids and collagen can likely take advantage of their absorption peaks in the range of . Currently, however, it cannot be excluded that the spectral overlap of such features might cause fitting problems and uncertainty in the estimate of collagen content in the case of markedly adipose breasts, where lipids could absorb much more strongly than collagen. This specific condition must be further investigated on a wide number of subjects. For the 10 volunteers, the reduced scattering coefficient of breast decreases progressively from on increasing wavelength from . Figure 6 reports the reduced scattering spectra obtained from the same subjects as considered in Fig. 5. In agreement with what generally was also observed in the past, the scattering of the fibrous breast decreases with a steeper slope than that of mixed or adipose breasts. Fig. 6Reduced scattering spectra measured in vivo from the breasts of three healthy volunteers (same volunteers as shown in Fig. 5).  For all subjects, independent of breast pattern, acceptable signal levels were achieved at long wavelengths. Provided that adequate levels of illumination light were available at all wavelengths, this positive result is the combination of acceptable light attenuation in tissue and high sensitivity of the detection apparatus. To better understand how light attenuation depends on tissue parameters that cannot be changed (parenchymal pattern), geometrical factors that can only moderately be affected (thickness of compressed breast) and instrumental parameters (operation wavelength or spectral range), the fraction of transmitted signal was calculated based on the diffusion equation. The optical properties measured for subjects 2, 3, and 10 were taken as representative of different breast types, and the fraction of the transmitted signal was calculated for two values of tissue thickness (i.e., 3 and ), to account for different breast volumes. The results are shown in Fig. 7 . Fibrous breasts are typically characterized by stronger absorption and often also by higher scattering, at least at short wavelengths. Hence, this breast type generally attenuates light more markedly in the entire wavelength range of observation as compared to adipose breasts, and thus light transmission in the near-IR range is strongly reduced. Tissue thickness is a key parameter in determining the level of the transmitted signal. Where peak absorption is observed, an increase in thickness from reduces the transmitted signal by two to three orders of magnitude (for adipose breasts on the lipid peak at and for fibrous breasts on the water peak at , respectively). The effect of the change of wavelength is smaller or, at most, comparable. Moreover, it is interesting to note that the average transmission above is higher than in the range by a factor of 1.5 to 3.3, with the strongest difference observed for a -thick fibrous breast. This is a positive feature in view of potential clinical applications, as they typically rely on very short acquisition times and consequently face problems of low signal level at wavelengths that are strongly attenuated by tissue. The availability of efficient detectors is obviously a critical issue that must be taken into account. In the past, commercial detectors provided only very low efficiency at long wavelengths, thus significantly limiting practical applications in that spectral range. However, the technological advances made in the field have recently overcome such limitations and efficient detectors are now available for time-resolved applications24, 25 above . Fig. 7Signal transmitted through compressed breasts of different type (fibrous, mixed, and adipose) and thickness (3 and ).  To estimate tissue composition, and specifically to investigate the possibility of noninvasively quantifying the content of collagen, time-resolved data obtained from all volunteers were best fitted with a spectrally constrained fitting procedure leaving constituent concentrations and scattering amplitude and power as free parameters.17 Conventionally, the absorption and reduced scattering spectra of breast are estimated from time-resolved transmittance curves measured at different wavelengths. Then, following the Beer law, the concentrations of the main tissue constituents are obtained by best fitting their reference spectra to the absorption spectra of tissue. However, the spectrally constrained procedure proved to provide higher stability as compared to the conventional procedure17 and was thus adopted in this work. Table 1 displays the estimated tissue composition and scattering parameters. For each subject, values obtained for the left and right breasts were averaged. The estimated tissue composition confirms the qualitative observations based on the visual analysis of the absorption spectra. For the six subjects aged over , x-ray mammograms were available and the parenchymal pattern was ranked based on Tabàr classification.26 In agreement with what expected from the absorption spectrum, subject 2, identified as breast type IV (fibrous), is characterized by high collagen content , as well as high water and low lipid content. The scattering power is also high (1.16). Similar features were observed also in subject 1, who can reasonably be ranked as a fibrous breast as well. In the latter case, the fitting procedure could not provide an acceptable estimate of lipid content, likely due to the fact that the low lipid absorption was overwhelmed by very strong water absorption. On the contrary, subjects 8 to 10 show a low content of collagen and water , but a high content of lipids . This is in agreement both with Tabàr classification as type II or III (adipose) and with what was expected from the measured absorption properties. The scattering power was markedly lower than for the fibrous breasts (0.52 to 0.69 to compare with 1.16 to 1.29). Tissue composition and scattering power for the remaining five subjects (3 to 7) were intermediate between what observed for fibrous and adipose breasts and suggested an intermediate breast type. This hypothesis could be confirmed only in two cases, where x-ray mammograms were available and the breast pattern was identified as type I (mixed). The estimated tissue parameters seem to span some what broader ranges for mixed breasts than for fibrous and adipose breasts. This might be caused by the fact that just a few subjects belong to each category, and the results have no statistical significance. However, it might also be related with the different nature of tissues. Especially for intermediate tissue types, where there is no dominant constituent and heterogeneity is more marked, optical measurements might depend on the specific location that reflects local variations in tissue composition and structure. It is also reasonable to hypothesize that breast type I (mixed) might identify a broader category of tissue composition and structure. Further studies on a wider number of subjects are required to determine whether averaging measurements performed at different locations can reduce the variability of the results. Table 1Breast tissue composition and scattering parameters of healthy volunteers with different breast type.
Average values and standard deviations of measurements performed on both breasts are reported. When available, the breast parenchymal pattern following Tabàr classification is also reported. We can account for significantly less than 100% of tissue volume: for the 10 subjects analyzed up to now. To estimate the percentage composition of tissue, the density of each constituent is required. For collagen in soft tissues, no information is available in the literature. Therefore, we relied on a density value of , which was reported for hard tissue.27 Thus, the low percentage of tissue volume accounted for in our measurements could be due to a wrong estimate of collagen density in breast tissue, and this is the reason why data on tissue composition are presented in Table 1 as absolute values (in milligram per cubic centimeter) rather than as percentage composition. However, it could also indicate that an appreciable percentage of tissue volume is represented by constituents that do not absorb significantly in the red and near-IR spectral range. 4.Conclusion and Future WorkThe final goal of our study was to investigate the feasibility and potential interest of diffuse optical spectroscopy above for diagnostic applications, and in particular for optical mammography. The results are positive for what concerns the quality of the data that are collected in vivo at long wavelengths, essentially due to adequate signal levels that are reached independent of breast type. To enable accurate data interpretation, as a part of this study, the absorption spectrum of collagen and lipid were measured from . Time-resolved in vivo data can reliably be interpreted to estimate the optical properties of breast tissue as well as to derive its composition in terms of main constituents, including collagen, and information on its structure. Based on these encouraging preliminary results, our setup for time-resolved optical mammography has recently been upgraded to enable images to be collected at seven wavelengths between 637 and . The instrument was tested at the laboratory level and is now entering a clinical study to investigate its ability in the noninvasive assessment of breast density and its diagnostic potential for lesion detection and characterization. ReferencesS. Alowami, S. Troup, S. Al-Haddad, I. Kirkpatrick, and P. H. Watson,
“Mammographic density is related to stroma and stromal proteoglycan expression,”
Breast Cancer Res. Treat., 5 R129
–R135
(2003). 0167-6806 Google Scholar
Y. P. Guo, L. J. Martin, W. Hanna, D. Benerjee, N. Miller, E. Fishell, R. Khokha, and N. F. Boyd,
“Growth factors and stromal matrix protein associated with mammographic densities,”
Cancer Epidemiol. Biomarkers Prev., 10 243
–248
(2001). 1055-9965 Google Scholar
P. P. Provenzano, D. R. Inman, K. W. Eliceiri, J. G. Knittel, L. Yan, C. T. Rueden, J. G. White, and P. J. Keely,
“Collagen density promotes mammary tumor initiation and progression,”
BMC Med., 6 11
(2008). https://doi.org/10.1186/1741-7015-6-11 Google Scholar
K. M. Blackmore, J. A. Knight, and L. Lilge,
“Association between transillumination breast spectroscopy and quantitative mammographic features of the breast,”
Cancer Epidemiol. Biomarkers Prev., 17 1043
–1050
(2008). https://doi.org/10.1158/1055-9965.EPI-07-2658 1055-9965 Google Scholar
C. Byrne,
“Studying mammographic density: Implications for understanding breast cancer,”
J. Natl. Cancer Inst., 89 531
–533
(1997). https://doi.org/10.1093/jnci/89.8.531 0027-8874 Google Scholar
N. F. Boyd, L. J. Martin, J. Stone, C. Greenberg, S. Minkin, and M. J. Yaffe,
“Mammographic densities as a marker of human breast cancer risk and their use in chemoprevention,”
Curr. Oncol. Rep., 3 314
–321
(2001). https://doi.org/10.1007/s11912-001-0083-7 Google Scholar
J. Couzin,
“Dissecting a hidden breast cancer risk,”
Science, 309 1664
–1666
(2005). https://doi.org/10.1126/science.309.5741.1664 0036-8075 Google Scholar
P. Taroni, D. Comelli, A. Pifferi, A. Torricelli, and R. Cubeddu,
“Absorption of collagen: effects on the estimate of breast composition and related diagnostic implications,”
J. Biomed. Opt., 12 014021
(2007). https://doi.org/10.1117/1.2699170 1083-3668 Google Scholar
S. H. Chung, A. E. Cerussi, C. Klifa, H. M. Baek, O. Birgul, G. Gulsen, S. I. Merritt, D. Hsiang, and B. J. Tromberg,
“In vivo water state measurements in breast cancer using broadband diffuse optical spectroscopy,”
Phys. Med. Biol., 53 6713
–6727
(2008). https://doi.org/10.1088/0031-9155/53/23/005 0031-9155 Google Scholar
S. Kukreti, A. Cerussi, B. Tromberg, and E. Gratton,
“Intrinsic tumor biomarkers revealed by novel double-differential spectroscopic analysis of near-infrared spectra,”
J. Biomed. Opt., 12 020509
(2007). https://doi.org/10.1117/1.2709701 1083-3668 Google Scholar
A. Pifferi, A. Torricelli, P. Taroni, D. Comelli, A. Bassi, and R. Cubeddu,
“Fully automated time domain spectrometer for the absorption and scattering characterization of diffusive media,”
Rev. Sci. Instrum., 78 053103
(2007). https://doi.org/10.1063/1.2735567 0034-6748 Google Scholar
A. Bassi, A. Farina, C. D’Andrea, A. Pifferi, G. Valentini, and R. Cubeddu,
“Portable, large-bandwidth time-resolved system for diffuse optical spectroscopy,”
Opt. Express, 15 14482
–14487
(2007). https://doi.org/10.1364/OE.15.014482 1094-4087 Google Scholar
M. S. Patterson, B. Chance, and B. C. Wilson,
“Time-resolved reflectance and transmittance for the noninvasive measurement of tissue optical properties,”
Appl. Opt., 28 2331
–2336
(1989). https://doi.org/10.1364/AO.28.002331 0003-6935 Google Scholar
R. C. Haskell, L. O. Svasaand, T. T. Tsay, T. C. Feng, M. S. McAdams, and B. J. Tromberg,
“Boundary conditions for the diffusion equation in radiative transfer,”
J. Opt. Soc. Am. A, 11 2727
–2741
(1994). https://doi.org/10.1364/JOSAA.11.002727 0740-3232 Google Scholar
J. R. Mourant, T. Fuselier, J. Boyer, and I. J. Bigio,
“Predictions and measurements of scattering and absorption over broad wavelength ranges in tissue phantoms,”
Appl. Opt., 36 949
–957
(1997). https://doi.org/10.1364/AO.36.000949 0003-6935 Google Scholar
A. M. Nilsson, K. C. Sturesson, D. L. Liu, and S. Addersson-Engels,
“Changes in spectral shape of tissue optical properties in conjunction with laser-induced thermotherapy,”
Appl. Opt., 37 1256
–1267
(1998). https://doi.org/10.1364/AO.37.001256 0003-6935 Google Scholar
C. D’Andrea, L. Spinelli, A. Bassi, A. Giusto, D. Contini, J. Swartling, A. Torricelli, and R. Cubeddu,
“Time-resolved spectrally constrained method for the quantification of chromophore concentrations and scattering parameters in diffusing media,”
Opt. Express, 5 1888
–1898
(2006). https://doi.org/10.1364/OE.14.001888 1094-4087 Google Scholar
S. Prahl, Oregon Medical Laser Center,
“Optical absorption of hemoglobin,”
(1999) http://omlc.ogi.edu/spectra/hemoglobin/index.html Google Scholar
L. Kou, D. Labrie, and P. Chylek,
“Refractive indices of water and ice in the spectral range,”
Appl. Opt., 32 3531
–3540
(1993). https://doi.org/10.1364/AO.32.003531 0003-6935 Google Scholar
A. Farina, A. Bassi, A. Pifferi, P. Taroni, D. Comelli, L. Spinelli, and R. Cubeddu,
“Bandpass effects on time-resolved diffuse spectroscopy,”
Appl. Spectrosc., 63 48
–56
(2009). 0003-7028 Google Scholar
E. Jarocka-Cyrta, E. Bańkowski, and K. K. Jodczyk,
“Collagen of breast with benign dysplasia,”
Patol. Pol., 42 83
–86
(1991). 0031-3114 Google Scholar
R. L. P. van Veen, H. J. C. M. Sterenborg, A. Pifferi, A. Torricelli, E. Chikoidze, and R. Cubeddu,
“Determination of visible near-IR absorption coefficients of mammalian fat using time- and spatially resolved diffuse reflectance and transmission spectroscopy,”
J. Biomed. Opt., 10
(5), 054004
(2005). https://doi.org/10.1117/1.2085149 1083-3668 Google Scholar
P. Taroni, L. Spinelli, A. Torricelli, A. Pifferi, G. M. Danesini, and R. Cubeddu,
“Multi-wavelength time domain optical mammography,”
Technol. Cancer Res. Treat., 4 527
–537
(2005). 1533-0346 Google Scholar
M. A. Itzler, R. Ben-Michael, C.-F. Hsu, K. Slomkowski, A. Tosi, S. Cova, F. Zappa, and R. Ispasoiu,
“Single photon avalanche diodes (SPADs) for photon counting applications,”
J. Mod. Opt., 54 283
–304
(2007). https://doi.org/10.1080/09500340600792291 0950-0340 Google Scholar
I. T. Gram, E. Funkhouser, and L. Tabàr,
“The Tabàr classification of mammographic parenchymal patterns,”
Eur. J. Radiol., 24 131
–136
(1997). https://doi.org/10.1016/S0720-048X(96)01138-2 0720-048X Google Scholar
D. L. Batchelar, M. T. M. Davidson, W. Dabrowski, and I. A. Cunnigham,
“Bone-composition imaging using coherent tomography: assessing bone health beyond bone mineral density,”
Med. Phys., 33 904
–915
(2006). https://doi.org/10.1118/1.2179151 0094-2405 Google Scholar
|
||||||||||||||||||||||||||||||||||||||||||||||||||||||||||||||||||||||||||||||||||||||||||||||||||||||||||


