
|
|
1.IntroductionFemtosecond (fs) laser–based cell surgery is an excellent tool for minimally invasive and extremely precise manipulation of single-cell organelles. This technique allows us to manipulate single cells at very low pulse energies in the range of some nJ or even less,1, 2, 3, 4, 5 thus minimizing the putative cell damage. Although many researchers are using this technology, effects at the cellular and molecular level are not well known in detail due to high numbers of interacting molecules and thereby the complexity of cellular dynamics. During fs laser–based cell surgery at pulse energies below the optical breakdown threshold, a so-called low-density plasma is produced at the very focus of the laser beam, which results in cumulative free-electron-mediated chemical effects.5 It is assumed that in the direct vicinity of the focal volume, chemical bonds are broken, liberating free electrons, which dissociate and ionize water and biomolecules. This disintegration of the molecule structure leads to material dissection. In addition, reactive oxygen species (ROS) are yielded by multiphoton ionization and dissociation of molecules in the laser focus.5, 6, 7, 8, 9 As a cell consists of approximately 70% water, the formed ROS due to ionization are mainly , the hydrogen ion , and the hydroxyl radical via the chemical reactions and . Within , excited water molecules can be dissociated to H and . Further chemical transformations of hydrated electrons and excited water molecules with soluted oxygen lead to formation of superoxide and singlet oxygen . In addition, recombination of hydroxyl radicals between themselves produces hydrogen peroxide .10 Under normal conditions, ROS are very important molecules in living cells as highly reactive ions and do play an important role in cell signaling. ROS are produced inside cell compartments, for example, in mitochondria or peroxisomes, which are responsible for the cell metabolism. During the process of adenosine- -triphosphate (ATP) production, oxygen is involved by binding electrons and is normally reduced to water. However, oxygen is incompletely reduced so that superoxide remains, which is not particularly reactive, but it possibly inactivates enzymes or initiates lipid peroxidation.11, 12, 13 An accumulation of ROS in a cell results in oxidative stress, which can correlate with cell damage. Cells have developed efficient mechanisms to reduce ROS, e.g., by antioxidants such as superoxide dismutase, catalase, glutathione, and vitamins A, C, and E. Therefore, ROS in cells are only detected if these reducing mechanisms are overrun.14 Valencia showed that they can be enhanced by addition of millimolar concentrations of general antioxidants to the culture medium, such as vitamin C, leading to successful suppression of UVA-induced ROS accumulation.15 The laser parameters for cell surgery are strongly dependent on the application. Two different regimes are typically used, at repetition rates of kHz or MHz. At high repetition rates of , chromosome cutting, or for example, membrane perforation, which allows foreign molecules such as DNA to enter the cell, or intracellular dissection were demonstrated in the low-density plasma regime.16, 17, 18, 19, 20 Other applications such as mitochondria ablation1 or axon dissection21 are typically done at beyond the optical breakdown threshold. If multiphoton microscopy is used, it is advantageous to manipulate in the MHz regime, as there is no other component needed, such as an amplifier system or an acousto-optical modulator, to reduce the laser repetition rate. However, when looking at the molecular level, Iwanaga showed that the repetition rate has a strong influence on the stimulation of calcium release.22 Calcium is an important intracellular messenger that is released from internal stores through channels in the endoplasmic reticulum and mediates information within cells to regulate their activity.23 Iwanaga set a threshold at about for stimulation of release. At this repetition rate, only 40,000 pulses lead to a 50% probability for wave formation at a pulse energy of and pulses. Below this value ( , at the same pulse energy and pulse duration), 160,000 irradiated pulses are necessary for the same probability of release.22 In addition, with respect to temperature distribution, the repetition rate is an important parameter. In the center of a single tightly focused laser pulse ( , wavelength, pulse energy), the temperature increases slightly (approximately ), then decreases, and reaches the initial value within , which corresponds to the time between two successive pulses at repetition rate.5 Thus, in the kHz regime, temperature accumulation does not play a role, whereas in the lower MHz regime, temperature starts to accumulate, and in the higher MHz regime, temperature effects have to be taken into account.5 In this work, we targeted the cell nucleus and compared the influence of fs laser irradiation on ROS formation in single cells while using different repetition rates in the kHz and the MHz regimes, which are commonly used for cell surgery, and different pulse energies below the optical breakdown threshold. Imaging fluorescence of the ROS indicator CM- was done by multiphoton microscopy. Compared to conventional one-photon-based confocal laser scanning microscopy, this method causes less photodamage to living cells.24, 25, 26 We analyzed the effect of ROS accumulation in single cells in relationship to pulse energy, repetition rate, and total introduced energy. In addition, we present our study on the influence of combination of successive irradiation at kHz and MHz repetition rate and vice versa. Last, we did the same experiments with vitamin C (ascorbic acid) as an additional antioxidant. 2.Materials and Methods2.1.Experimental Setup2.1.1.Laser system and pulse pickerThe laser system used in this study was a tunable Ti:sapphire laser (Coherent, Chameleon), which generates ultrashort pulses of at a repetition rate of . The accessible wavelength ranges from and the maximum pulse energy at is at the laser output. An acousto-optical pulse picker (APE, Pulse Select) was used to regulate the pulse frequency for the repetition rate–dependent experiments. It consists of a Bragg cell that selects pulses of the laser beam. These pulses are diffracted into the first order with a diffraction angle of approximately (see Fig. 1 ). The pulse picker was configured to change the repetition rate from to either or . 2.1.2.Scan unit and microscopeThe diffracted and initial laser beam were guided through a mechanical shutter (Thorlabs, SC10) and an attenuator before being superimposed. Afterward, both were deflected in the and direction by galvanometer scan-mirrors (Cambridge Technology) into the microscope (Carl Zeiss AG, Axiovert 100). They entered the tube via a dichroic beamsplitter and were further guided onto the sample. A oil immersion objective (Carl Zeiss AG, Plan-Neofluar) focused the beams into the sample with a theoretical spot size of approximately at a central wavelength of . While the diffracted beam from the pulse picker was used for cell manipulation (manipulation beam), the initial beam was used for multiphoton microscopy (imaging beam). The fluorescence, induced by multiphoton excitation at very low laser pulse energies of about for all labeled samples, passed a dye-specific bandpass filter (Semrock) and was detected by a photomultiplier tube (Hamamatsu, R6357) (see Fig. 2 ). The pixel dwell time was about , and the size of the scanned area was . 2.2.Cells and LabelingBovine endothelial cells were cultivated in glass-bottom dishes with a thickness of (MatTek Corporation) using RPMI 1640 medium (Roswell Park Memorial Institute) supplemented with 10% fetal calf serum (FCS) and the antibiotics penicillin, streptomycin, and patricin at and 5% humidified atmosphere. The dyes used in our experiments were the ROS indicator CM- (Invitrogen emission: ; bandpass filter: ), the mitochondrial-selective fluorescent label MitoTracker Red 580 FM (Invitrogen; emission: ; bandpass filter: ), and the membrane impermeable nucleic acid stain propidium iodide (Fisher Scientific, emission: ; bandpass filter: ). MitoTracker Red 580 FM and propidium iodide (PI) were used to assess the mitochondrial morphology and the membrane integrity over time. Damaged cells are characterized by uptake of prodidium iodide molecules. Furthermore, swelling of mitochondria in a cell is an early indicator of apoptotic and necrotic cell death. ROS labeling was realized by incubating cells for in NaCl-bath solution (NaCl-BS) media containing NaCl, KCl, , , , glucose, HEPES, pH 7.4 and an osmolarity or in NaCl-BS supplemented with ascorbic acid being the same concentration as used by Valencia to suppress UVA-induced ROS accumulation.15 Then, ROS indicator was added, and the cells were incubated for another and washed once with NaCl-BS to remove redundant dye molecules. The experiments were done in NaCl-BS or NaCl-BS containing ascorbic acid in case of previous incubation with this antioxidant. For the evaluation of cell viability, cells were costained with ROS indicator and MitoTracker Red 580 FM for after previous incubation in NaCl-BS for . Then, they were washed once in NaCl-BS and maintained in NaCl-BS with propidium iodide during these measurements. 2.3.Manipulation and Imaging of Single CellsROS formation during fs laser cell surgery was studied by targeting the manipulation beam at a central wavelength of into the nucleus of labeled cells using a objective. The manipulation was done at a pulse energy of or , which both are below the optical breakdown threshold, so that the manipulation effect was due to low-density plasma generation.5 Two different repetition rate regimes were used at and , although the kHz regime is typically used for cell surgery experiments beyond the optical breakdown threshold (see Sec. 1). In the kHz regime, an irradiation time of was applied, which is equivalent to an exposure to 160,000 laser pulses and corresponds to the threshold for stimulation of release in HeLa cells at pulse energy.22 For repetition rate, an irradiation time of was applied, so that the same number of pulses was introduced into the cells as in the kHz regime. In addition to single-exposure measurements at MHz or kHz repetition rate, experiments with two pulse intervals were realized at the same repetition rate as well as at different repetition rates in the kHz and MHz regimes (see Fig. 3 ). The time interval between two exposures was , as the cells needed approximately this time after manipulation to reduce the ROS concentration to the initial level at (see Fig. 4 ) and almost to the initial level at (see Fig. 5 ). Fig. 3Scheme of two irradiation intervals for (a) two pulse trains, (b) two pulse trains,(c) pulse train followed by pulse train, and (d) pulse train followed by pulse train, each with a recovery time of between both exposures.  Fig. 4Multiphoton microscopy images of bovine endothelial cells, labeled with , before and after manipulation at repetition rate, pulse energy, and 160,000 pulses without ascorbic acid. (a) The manipulated cell is highlighted by the white rectangle, the control cell by the dashed red rectangle. The relative fluorescence increase is the ratio of the normalized average fluorescence intensity of the manipulated and the control cell. Manipulation of the cells at (b) or (c) repetition rate induced an increase of fluorescence (red squares), which indicates an accumulation of ROS. This increase could be suppressed with ascorbic acid (blue circles). The dotted black lines indicate the time of laser irradiation. Scale bar: . The experiments were done five times, and the values represent the error of the mean (Color online only.)  Fig. 5Manipulation of bovine endothelial cells with 160,000 pulses at pulse energy and (a) or (b) repetition rate induced an increase of fluorescence (red squares), which indicates an accumulation of ROS. This increase could be reduced with ascorbic acid (blue circles). The dotted black lines indicate the time of laser irradiation. The experiments were done five times, and the values represent the error of the mean. (Color online only.) 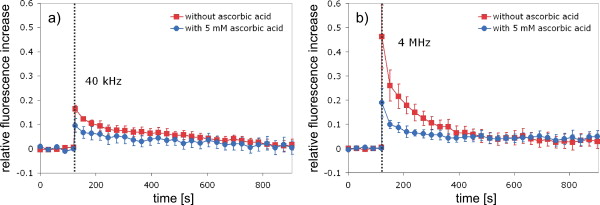 Imaging of the fluorescence reaction of single cells after manipulation was done by multiphoton microscopy for at a central excitation wavelength of for all used dyes, scanning the field of view once every to take an image. Five images were taken before manipulation to measure the initial ROS fluorescence level. This was done by determining the mean ROS fluorescence intensity over the cell nucleus in each image and averaging over all five images. The cell nucleus had an approximate cross section of which was much larger than the focal volume of . At least one control cell, which was not manipulated, was observed additionally. Variations in ROS fluorescence in manipulated cells were compared to those in nonmanipulated cells. To this end, both fluorescence curves were normalized separately by dividing their values by the initial fluorescence levels. The relative fluorescence increase was then determined by dividing the normalized curve of the manipulated cell by the corresponding curve of the control cell. 3.Results3.1.ROS Formation Depending on Repetition Rate and Total Introduced EnergyIrradiation of the cell nucleus with 160,000 pulses at pulse energy and repetition rate and without ascorbic acid resulted in a fast fluorescence increase of the ROS indicator of about during the exposure time and then a slow recovery to the initial level within the next [see Fig. 4b]. At the same laser pulse energy and number of pulses but higher repetition rate of , we observed a similar increase of about followed by a significantly faster decrease to the initial level within [see Fig. 4c]. In contrast, addition of ascorbic acid to the NaCl-BS media reduced the increase to about 0.02 and at and , respectively. The following decrease of fluorescence intensity behaved in almost the same manner as without ascorbic acid. Similar experiments were done at higher pulse energy of (see Fig. 5). Laser irradiation with 160,000 pulses at repetition rate and without ascorbic acid led to an instantaneous increase of about (which was a factor of about 2 compared to the results at pulse energy) followed by a slow decrease to the initial level within the whole observation time of [see Fig. 5a]. Compared to this, an irradiation at resulted in a strong increase of the fluorescence intensity of about , which was significantly higher than at , followed by a decrease almost to the initial level within [see Fig. 5b]. In contrast to the results at pulse energy, addition of ascorbic acid was not enough to reduce most of the formed ROS molecules at . The fluorescence intensity raised about at and at followed by a decrease to the initial level as without ascorbic acid. At both pulse energies, and , change of mitochondrial morphology or diffusion of PI molecules into the cell were not observed after exposure to 160,000 pulses at or repetition rate (data not shown). 3.2.ROS Formation Behavior after Consecutive Laser Exposure at Different Repetition Rate RegimesThe influence of consecutive application of pulse trains from different repetition rate regimes was studied at a constant laser pulse energy of . Exposure to two pulse trains at the same repetition rate and a time interval of between both exposures led to two steps of ROS increase that corresponded to those observed at single irradiation in the kHz and MHz regimes. Two successive irradiations with 160,000 pulses at repetition rate led to two steps of fluorescence intensity increase of 0.25 and without ascorbic acid [see Fig. 6a ]. After each pulse train, the fluorescence decreased to approximately within . Again, ascorbic acid strongly reduced ROS accumulation during each laser irradiation period. The same experiment was also done at a higher repetition rate of . Without ascorbic acid, the fluorescence intensity increased about after the first pulse train, followed by a decrease to within the next [see Fig. 6b]. The second irradiation led to another increase of about . Thereafter, the fluorescence decreased to until the end of the observation period. Like the experiment at , ascorbic acid reduced the fluorescence increase after each irradiation by a factor of four. Fig. 6Multiple manipulation of bovine endothelial cells each with 160,000 pulses at pulse energy and (a) or (b) repetition rate and between the two exposure intervals. The red squares represent the fluorescence behavior without ascorbic acid and the blue circles with ascorbic acid. The dotted black lines indicate the time of laser irradiation. The experiments were done five times, and the values represent the error of the mean. (Color online only.) 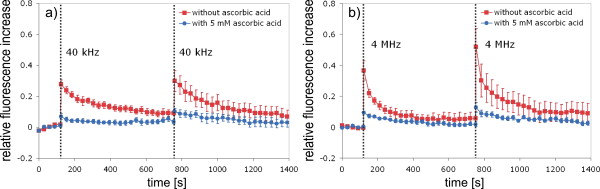 Exposure to two pulse trains at different repetition rates showed an unexpected behavior. Whereas irradiation with a kHz pulse train followed by a MHz pulse train led to the supposed ROS increase corresponding to each step, the reverse repetition rate sequence resulted in a dramatic fluorescence increase after kHz repetition rate exposure as a second manipulation, which led to cell death in 3 out of 14 cases (approximately 20%). Irradiation with 160,000 pulses at followed by the same pulse train at repetition rate led to two steps of fluorescence increase, 0.2 and , without ascorbic acid [see Fig. 7a ]. After each pulse interval, the fluorescence decreased almost to the initial level within . Ascorbic acid was again effective in reducing ROS accumulation, as the steps after each exposure were significantly smaller. Fig. 7Multiple manipulation of bovine endothelial cells each with 160,000 pulses at pulse energy and (a) first at for , and after at repetition rate for , or (b) vice versa. The red squares represent the fluorescence behavior without ascorbic acid, and the blue circles with ascorbic acid. The dotted black lines indicate the time of laser irradiation. The experiments were done at least five times, and the values represent the error of the mean. (Color online only.) 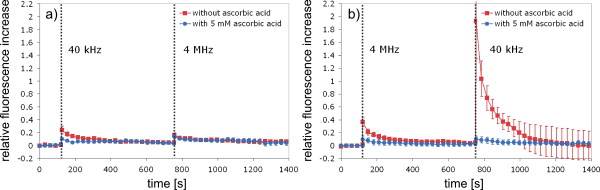 Interestingly, the same experiment in the reverse repetition rate sequence caused a different behavior. As in the case of single exposure, the fluorescence intensity increased about directly after laser irradiation at repetition rate without ascorbic acid [see Fig. 7b]. Within the next , it decreased to . The following exposure to 160,000 pulses at resulted in a dramatic increase of about . In comparison to the experiment with two pulse intervals at , this increase was a factor of about 4 higher [see Fig. 6b]. After the second exposure, the fluorescence intensity continuously decreased to the initial level. As indicated by the high standard error of the mean, this behavior was not a constant result. Usually, the fluorescence level decreased slowly and did not reach the initial level during the whole observation time [see Fig. 8a ], while in 3 out of 14 cases (approximately 20%), the fluorescence intensity of the manipulated cell approached zero within a few minutes [see Fig. 8b]. As observed previously, ascorbic acid strongly reduced ROS accumulation during each irradiation interval. Fig. 8Multiple manipulation of bovine endothelial cells, each with 160,000 pulses at pulse energy and first at for , and after at repetition rate for . (a) The fluorescence decreases slowly after the second exposure until it reaches a plateau about 0.5 unit above the initial level. (b) The fluorescence intensity of the manipulated cell approaches zero within a few minutes after the second exposure. The dotted black lines indicate the time of laser irradiation. 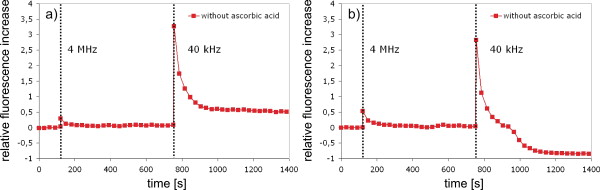 Laser irradiation with two pulse intervals consisting of 160,000 laser pulses with pulse energy at the same repetition rate of either or led to no visible change of mitochondrial morphology and uptake of PI molecules. The same applied to consecutive manipulation at and repetition rate. In contrast, in case of laser irradiation at followed by repetition rate, the mitochondrial morphology was strongly dependent on the fluorescence behavior in the ROS indicator channel ( bandpass emission filter). If the fluorescence level decreased slowly after the second exposure, no change of mitochondrial morphology or PI diffusion into the cell was observed within the whole observation time. However, if the fluorescence of the manipulated cell in the ROS indicator channel sharply approached zero after the second exposure, the mitochondria underwent swelling approximately at the same time ( after irradiation) (see Fig. 9 ). Furthermore, about later, PI started to accumulate in the manipulated cell. Fig. 9Multiphoton microscopy images of bovine endothelial cells, labeled with MitoTracker Red and propidium iodide. Two exposures to 160,000 pulses at pulse energy and repetition rates of followed by with a time interval of were targeted into the nucleus (highlighted by the arrow) just before the first image was taken. The mitochondria undergo swelling approximately after the second manipulation, after the beginning of the measurement. About later , propidium iodide starts to accumulate in the cell nucleus. Scale bar: .  4.Discussion and ConclusionThe results of the ROS measurements during fs laser–based cell surgery showed a strong dependence on the repetition rate of laser irradiation. Irradiation of the nucleus at a pulse energy of , repetition rate, and irradiation time led to a fast increase of of fluorescence, which was homogeneously distributed over the whole cell [see Figs. 4a and 4b]. The fluorescence behavior indicates that ROS were immediately produced by the laser application. While several types of generated ROS such as singlet oxygen and the hydroxyl radical are confined to the focal volume, hydrogen peroxide is stable enough to cross cell membranes.10, 27, 28 Therefore, the fast fluorescence increase over the whole cell can be attributed to fast diffusion of ROS indicator molecules after their oxidation by ROS either inside or outside the focal volume. Within the next , the fluorescence intensity decreased to the initial value. We assume that this behavior was due to simultaneous ROS degradation by cellular ROS scavengers and diffusion of molecules through the cell membrane. With ascorbic acid, there was almost no increase of fluorescence intensity. Addition of the antioxidant was enough to quench the ROS molecules in the focal volume where they were produced. Compared to this, at repetition rate and exposure time, which is the same total deposited energy, approximately the same increase of about of fluorescence intensity took place [see Fig. 4c]. This leads to the assumption that the recovery of ROS scavenger capacities in the manipulated cells after each laser pulse is faster than the time interval between two pulses at both and . Applying an exponential fit to the first five ROS fluorescence values after manipulation for both cases resulted in a significantly faster reduction of the instant fluorescence increase in the MHz regime. In this case, the initial ROS level was achieved within after manipulation. Perhaps, the 100-fold longer irradiation time needed to introduce the same total energy at somehow delays subsequent recovery processes in the cells. As for the lower repetition rate, almost no increase of fluorescence could be observed with ascorbic acid. At higher pulse energy of , the fluorescence intensity rose a factor of 2 higher for and a factor of 5 higher for repetition rate compared to the manipulation at pulse energy [see Figs. 5a and 5b]. This difference can be attributed to finite diffusion coefficients of ROS scavengers. If high amounts of ROS molecules are produced in the focal volume, this may lead to an overflow of ROS scavenger capacities within this region. The effectiveness of ROS reducing mechanisms for subsequent pulses is then defined by diffusion of scavengers into the focal volume. For example, the diffusion coefficient of catalase is , which is much lower than for ROS molecules.29, 30 Therefore, due to the 100-fold shorter time interval between two pulses, a stronger ROS accumulation is observed at repetition rate compared to . With ascorbic acid, there was an increase of fluorescence at these parameters, but still significantly lower compared to the results without additional antioxidants. Due to the higher production of ROS molecules at pulse energy, the quenching capacity of ascorbic acid molecules was not enough to achieve an instantaneous reduction of the produced ROS. In addition to ROS labeling, the mitochondrial morphology and the cell membrane integrity were observed as early signals of cell damage. Exposure to 160,000 pulses with a pulse energy of or at or did not result in any change of these properties (data not shown). This indicates that cell viability was not affected by the laser irradiation at these parameters. The influence of kHz or MHz exposure on subsequent laser irradiation resulted in an interesting behavior concerning ROS accumulation compared to single pulse train irradiation. Exposure to two pulse trains at and irradiation time or and irradiation time led to the same increase of fluorescence intensity as for the respective single exposure at these parameters [see Figs. 6a and 6b]. Again, no signs of cell damage were observed in both cases. With ascorbic acid as an additional antioxidant, there was a significantly lower increase of the fluorescence intensity after both pulse trains due to ascorbic acid dependent reduction of the produced ROS molecules. Irradiation with 160,000 pulses at followed by the same number of pulses after showed the expected reaction, an increase of about after the kHz irradiation and another increase of approximately the same amount due to MHz pulses [see Fig. 7a]. The reverse procedure beginning with irradiation at resulted in a completely different fluorescence behavior. Although irradiation with 160,000 pulses at a repetition rate of led to the effects previously described, the following exposure to the kHz pulse interval induced a further dramatic increase of fluorescence intensity of about [see Fig. 7b]. Compared to two pulse trains at , this increase was a factor of 4 higher [see Fig. 6b]. Only with ascorbic acid as an additional antioxidant, the fluorescence increase was comparable to that of single irradiation at pulse energy. Even for exposure at followed by , the ROS level did not rise significantly higher after the second pulse train in this case. As the antioxidant ascorbic acid suppressed the unexpected behavior after consecutive irradiation at different repetition rates, we assume that the ROS scavenger mechanisms were damaged or reduced in activity due to the first exposure Therefore, ROS reduction was impeded in the whole cell. Nikogosyan showed that photochemical processes leading to generation of ROS can be classified into fast and slow reactions with time constants of and , respectively.10 We assume that these slow photochemical processes in the millisecond range of time are normally suppressed by ROS scavengers, but have a strong influence at low repetition rates after damaging the ROS scavenger mechanisms due to previous irradiation in the MHz regime. By successive irradiation at repetition rate, however, they remain of minor importance because of the short time interval of between two consecutive laser pulses. This leads to their permanent inhibition due to ionization and dissociation of the molecules in the focal volume. As a result, after previous irradiation at , the ROS accumulation in the kHz regime became much stronger, whereas the amount of produced ROS molecules in the MHz regime remained constant. To verify this assumption described earlier, we replicated the same experiments after adding of the catalase inhibitor 3-amino-1,2,4-triazole (Sigma) to the culture medium The ROS scavenger catalase particularly decomposes hydrogen peroxide into oxygen and water.31 The initial fluorescence level was much higher in this case, which indicates that hydrogen peroxide plays an important role in fluorescence generation (data not shown). Furthermore, in contrast to the experiments without catalase inhibition, the ROS accumulation after single exposure at was stronger than at . Nevertheless, it was still significantly lower in comparison to consecutive pulse trains in the MHz and kHz regime. Therefore, it can be assumed that other ROS scavengers such as superoxide dismutase, which are not inhibited by 3-amino-1,2,4-triazole, also play an important role in reducing ROS molecules. Without ascorbic acid, consecutive pulse trains at followed by induced changes in mitochondrial morphology in 3 out of 14 cases (approximately 20%) within two to three minutes after second exposure. The alteration of mitochondria was followed by leakage of the cell [ROS fluorescence decreased to zero, see Fig. 8b] and accumulation of PI in the nucleus indicating a significant damage to the cell membrane (see Fig. 9). This observation suggests that consecutive irradiation led to necrosis. In cells that did not show an uptake of PI, the ROS concentration slowly decreased after the second irradiation [see Fig. 8a]. The average of the ROS fluorescence intensity at these parameters indicated a decrease to the initial level that was observed in only 4 out of 14 cases. Furthermore, the divergent behavior of the fluorescence in different cells was reflected in the large standard error of the mean for these measurements [see Fig. 7b]. The presented results on ROS formation in bovine endothelial cells lead to new insights on laser-induced damage during cell surgery. Cells are highly influenced by laser irradiation at the molecular level. On the one hand, the repair mechanisms are fast enough to almost completely recover the direct ROS increase due to laser light. But in the following, cells seem to be more sensitive to laser irradiation, which indicates that they are still disturbed in their dynamics after a few minutes. Cell surgery experiments should therefore always include a long time assay to be sure of cell viability. However, especially the multiple-exposure experiments show that at constant pulse energy, a repetition rate in the MHz regime is worse than the kHz regime in terms of cell viability. Thus, kHz repetition rates are preferable for cell surgery. Furthermore, an addition of antioxidants significantly reduces negative side effects and even necrosis. AcknowledgmentsThis work was funded by the initiative of the German Federal and State Governments through the German Research Foundation (DFG) within the excellence cluster “REBIRTH” and the Transregio 37. ReferencesW. Watanabe, N. Arakawa, S. Matsunaga, T. Higashi, K. Fukui, K. Isobe, and K. Itoh,
“Femtosecond laser disruption of subcellular organelles in a living cell,”
Opt. Express, 12
(18), 4203
–4213
(2004). https://doi.org/10.1364/OPEX.12.004203 1094-4087 Google Scholar
N. Shen, C. B. Schaffer, D. Datta, and E. Mazur,
“Photodisruption in biological tissues and single cells using femtosecond laser pulses,”
Lasers and Electro Optics, Conf. Tech. Dig., 56 403
–404 OSA, Washington, DC
(2001). Google Scholar
K. Koenig, I. Riemann, P. Fischer, and K. Halbhuber,
“Intracellular nanosurgery with near-infrared femtosecond laser pulses,”
Cell. Mol. Biol. (Paris), 45
(2), 192
–201
(1999). 0145-5680 Google Scholar
A. Heisterkamp, I. Z. Maxwell, E. Mazur, J. M. Underwood, J. A. Nickerson, S. Kumar, and D. E. Ingber,
“Pulse energy dependence of subcellular ablation by femtosecond laser pulses,”
Opt. Express, 13
(10), 3690
–3696
(2005). https://doi.org/10.1364/OPEX.13.003690 1094-4087 Google Scholar
A. Vogel, J. Noack, G. Huettman, and G. Paltauf,
“Mechanisms of femtosecond laser nanosurgery of cells and tissues,”
Appl. Phys. B, 81
(8), 1015
–1047
(2005). https://doi.org/10.1007/s00340-005-2036-6 0946-2171 Google Scholar
G. Maatz, A. Heisterkamp, H. Lubatschowski, S. Barcikowski, C. Fallnich, H. Welling, and W. Ertmer,
“Chemical and physical side effects at application of ultrashort laser pulses for intrastromal refractive surgery,”
J. Opt. A, Pure Appl. Opt., 2
(1), 59
–64
(2000). https://doi.org/10.1088/1464-4258/2/1/311 1464-4258 Google Scholar
A. Heisterkamp, T. Ripken, T. Mammom, W. Drommer, H. Welling, W. Ertmer, and H. Lubatschowski,
“Nonlinear side effects of fs pulses inside corneal tissue during photodisruption,”
Appl. Phys. B, 74
(5), 419
–425
(2002). https://doi.org/10.1007/s003400200825 0946-2171 Google Scholar
P. K. Frederiksen, M. Jorgensen, and P. R. Ogilby,
“Two-photon photosensitized production of singlet oxygen,”
J. Am. Chem. Soc., 123
(6), 1215
–1221
(2001). https://doi.org/10.1021/ja003468a 0002-7863 Google Scholar
B. C. Garret, D. A. Dixon, D. M. Camaioni, D. M. Chipman, M. A. Johnson, C. D. Jonah, G. A. Kimmel, J. H. Miller, T. N. Rescigno, P. J. Rossky, S. S. Xantheas, S. D. Colson, A. H. Laufer, D. Ray, P. F. Barbara, D. M. Bartels, K. H. Becker, K. H. Bowen, S. E. Bradforth, I. Carmichael, J. V. Coe, L. R. Corrales, J. P. Cowin, M. Dupuis, K. B. Eisenthal, J. A. Franz, M. S. Gutowski, K. D. Jordan, B. D. Kay, J. A. LaVerne, S. V. Lymar, T. E. Madey, C. W. McCurdy, D. Meisel, S. Mukamel, A. R. Nilsson, T. M. Orlando, N. G. Petrik, S. M. Pimblott, J. R. Rustad, G. K. Schenter, S. J. Singer, A. Tokmakoff, L.-S. Wang, C. Wettig, and T. S. Zwier,
“Role of water in electron-initiated processes and radical chemistry: issues and scientific advances,”
Chem. Rev. (Washington, D.C.), 105
(1), 355
–389
(2005). 0009-2665 Google Scholar
D. N. Nikogosyan, A. A. Oraevsky, V. I. Rupasov,
“Two-photon ionization and dissociation of liquid water by powerful laser UV radiation,”
Chem. Phys., 77
(1), 131
–143
(1983). https://doi.org/10.1016/0301-0104(83)85070-8 0301-0104 Google Scholar
D. Han, E. Williams, and E. Cadenas,
“Mitochondrial respiratory chain-dependent generation of superoxide anion and its release into the intermembrane space,”
Biochem. J., 353
(2), 411
–416
(2001). https://doi.org/10.1042/0264-6021:3530411 0264-6021 Google Scholar
A. Boveris, N. Oshino, and B. Chance,
“The cellular production of hydrogen peroxide,”
Biochem. J., 128
(3), 617
–630
(1972). 0264-6021 Google Scholar
F. Kroetz, H. Y. Sohn, T. Gloe, S. Zahler, T. Riexinger, T. M. Schiele, B. F. Becker, K. Theisen, V. Klauss, and U. Pohl,
“NAD(P)H oxidase-dependent platelet superoxide anion release increases platelet recruitment,”
Blood, 100
(3), 917
–924
(2002). https://doi.org/10.1182/blood.V100.3.917 0006-4971 Google Scholar
W. Jakubowski and G. Bartosz,
“2,7 dichlorofluorescin oxidation and reactive oxygen species: what does it measure?,”
Cell Biol. Int., 24
(10), 757
–760
(2000). https://doi.org/10.1006/cbir.2000.0556 1065-6995 Google Scholar
A. Valencia, A. Rajadurai, A. B. Carle, and I. E. Kochevar,
“7-dehydrocholesterol enhances ultraviolet A-induced oxidative stress in keratinocytes: roles of NADPH oxidase, mitochondria, and lipid rafts,”
Free Radic Biol. Med., 41
(11), 1704
–1718
(2006). https://doi.org/10.1016/j.freeradbiomed.2006.09.006 0891-5849 Google Scholar
K. Koenig, I. Riemann, and W. Fritzsche,
“Nanodissection of human chromosomes with near-infrared femtosecond laser pulses,”
Opt. Lett., 26
(11), 819
–821
(2001). https://doi.org/10.1364/OL.26.000819 0146-9592 Google Scholar
U. K. Tirlapur and K. Koenig,
“Targeted transfection by femtosecond laser,”
Nature (London), 418
(6895), 290
–291
(2002). https://doi.org/10.1038/418290a 0028-0836 Google Scholar
D. Stevenson, B. Agate, X. Tsampoula, P. Fischer, C. T. A. Brown, W. Sibbet, A. Riches, F. Gunn-Moore, and K. Dholakia,
“Femtosecond optical transfection of cells: viability and efficiency,”
Opt. Express, 14
(16), 7125
–7133
(2006). https://doi.org/10.1364/OE.14.007125 1094-4087 Google Scholar
J. Baumgart, W. Bintig, A. Ngezahayo, S. Willenbrock, H. Murua Escobar, W. Ertmer, H. Lubatschowski, and A. Heisterkamp,
“Quantified femtosecond laser based opto-perforation of living GFSHR-17 and MTH53a cells,”
Opt. Express, 16
(5), 3021
–3031
(2008). https://doi.org/10.1364/OE.16.003021 1094-4087 Google Scholar
T. Shimada, W. Watanabe, and S. Matsunaga,
“Intracellular disruption of mitochondria in a living HeLa cell with a femtosecond laser oscillator,”
Opt. Express, 13
(24), 9869
–9880
(2005). https://doi.org/10.1364/OPEX.13.009869 1094-4087 Google Scholar
M. F. Yanik, H. Cinar, H. N. Cinar, A. D. Chisholm, Y. Jin, and A. Ben-Yakar,
“Neurosurgery: functional regeneration after laser axotomy,”
Nature (London), 432
(7019), 822
(2004). https://doi.org/10.1038/432822a 0028-0836 Google Scholar
S. Iwanaga, N. I. Smith, K. Fujita, and S. Kawata,
“Slow wave stimulation using low repetition rate femtosecond pulsed irradiation,”
Opt. Express, 14
(2), 717
–725
(2006). https://doi.org/10.1364/OPEX.14.000717 1094-4087 Google Scholar
M. J. Berridge, M. D. Bootman, and P. Lipp,
“Calcium—a life and death signal,”
Nature (London), 395
(6703), 645
–648
(1998). https://doi.org/10.1038/27094 0028-0836 Google Scholar
W. Denk, J. H. Strickler, and W. W. Webb,
“Two-photon laser scanning fluorescence microscopy,”
Science, 248
(4951), 73
–76
(1990). https://doi.org/10.1126/science.2321027 0036-8075 Google Scholar
K. Koenig,
“Multiphoton microscopy in life sciences,”
J. Microsc., 200
(2), 83
–104
(2000). https://doi.org/10.1046/j.1365-2818.2000.00738.x 0022-2720 Google Scholar
J. M. Squirrell, R. D. Schramm, A. M. Paprocki, D. L. Wokosin, and B. D. Bavister,
“Imaging mitochondrial organization in living primate oocytes and embryos using multiphoton microscopy,”
Microsc. Microanal., 9
(3), 190
–201
(2003). https://doi.org/10.1017/S1431927603030174 1431-9276 Google Scholar
C. Batandier, E. Fontaine, C. Keriel, and X. M. Leverve,
“Determination of mitochondrial reactive oxygen species: methodological aspects,”
J. Cell. Mol. Med., 6
(2), 175
–187
(2002). https://doi.org/10.1111/j.1582-4934.2002.tb00185.x Google Scholar
M. S. Patterson, S. J. Madsen, and B. C. Wilson,
“Experimental tests of the feasibility of singlet oxygen luminescence monitoring in vivo during photodynamic therapy,”
J. Photochem. Photobiol., B, 5
(1), 69
–84
(1990). https://doi.org/10.1016/1011-1344(90)85006-I 1011-1344 Google Scholar
T. Samejima, M. Kamata, and K. Shibata,
“Dissociation of bovine liver catalase at low pH,”
J. Biochem. (Tokyo), 51
(3), 181
–187
(1962). 0021-924X Google Scholar
S. A. M. van Stroe-Blezen, F. M. Everaerts, L. J. J. Janssen, and R. A. Tacken,
“Diffusion coefficients of oxygen, hydrogen peroxide, and glucose in a hydrogel,”
Anal. Chim. Acta, 273
(2), 553
–560
(1993). https://doi.org/10.1016/0003-2670(93)80202-V 0003-2670 Google Scholar
E. Margoliash and A. Novogrodsky,
“A study of the inhibition of catalase by 3-amino-1-2-4-triazole,”
Biochem. J., 68
(3), 468
–475
(1958). 0264-6021 Google Scholar
|


