
|
|
1.IntroductionNear-IR diffuse optical spectroscopy (DOS) is commonly used to determine in vivo tissue absorption coefficient and reduced scattering coefficient , from which tissue functional information, such as hemoglobin concentration, oxygen saturation, water concentration, and averaged scatter size and density can be deduced.1, 2 Both of these parameters are important in noninvasive tissue diagnostics, since the scattering coefficient of tissue can provide information about the mean size of the tissue scatterers, while the absorption coefficient of tissue can be used to determine chromophore species and concentrations.3, 4 The interrogation depth of DOS measurements is generally proportional to the source-detector separation of the probe employed and it also depends on the optical properties of tissues under investigation. 5, 6 DOS methods with source-detector separation larger than have performed quite well in the spectral range for the purpose of determining optical properties and chromophore concentrations of thick tissues (depths greater than ) such as breast and brain.7, 8 DOS techniques have been applied to investigate optical properties of superficial tissues as well. Bevilacqua used a fiber probe having source-detector separations in the range from along with a Monte Carlo model to recover optical properties of a human skull and brain.9 Bays 10 employed spatially resolved reflectometry to determine optical properties of human esophageal wall with a probe having source-detector separations ranging from . Amelink developed differential path-length spectroscopy to investigate optical properties of bronchial mucosa.11 In all cases, DOS techniques require either a photon transport model or an empirical model to determine and from the reflectance. The photon transport model most often utilized for determining optical properties from DOS measurements is the standard diffusion model derived from the radiative transport theory. Because of its simplicity and computational efficiency, the standard diffusion model has been used widely and successfully to recover optical properties of deep tissues.12, 13 While the standard diffusion model is derived from the radiative transport theory with diffusion approximations, the model cannot be used reliably for recovering the optical properties of typical biological tissues when is smaller than 10, where is the source-detector separation and is14, 15, 16 the transport mean free path . To reliably determine optical properties of superficial tissue volumes lying between the tissue surface and deep using DOS, measurements with source-detector separation shorter than are necessary.6 This regime is of great interest for skin-cancer-oriented applications, oral cancer applications, and numerous applications accessible via endoscope in which functional characterization of tissue is desirable. Several alternative approaches to diffusion approximation such as Monte Carlo simulations, approximation, and approximation have been proposed for short source-detector separation DOS applications.17, 18, 19 Although methods based on Monte Carlo techniques have, in certain circumstances, been shown to provide the most accurate results among the aforementioned models, the need for intensive computation resources to build a data library in advance limits its applicability. Several researchers have developed the so-called “white Monte Carlo model,” which enables the calculation of optical properties based on a single Monte Carlo simulation to bring the computation time similar to the diffusion theory based models.17 However, it is shown that even with the white Monte Carlo method, a data library containing various single scattering phase functions still must be established in advance to properly recover optical properties of superficial tissues, since the single scattering phase function of tissue actively affects the measured reflectance especially when the source-detector separation is20 shorter than . By changing the scattering phase function used in the Monte Carlo model, Liu and Ramanujam reported the reflectance generated with different scattering phase functions could have deviation larger than 20% at source-detector separations shorter than . This deviation in calculated reflectance resulted in 31.4% error in the recovered absorption coefficient.21 In contrast, the diffusion-based models do not require a phase function to recover and . We demonstrated that using a novel optical probe to facilitate the usage of the diffusion model to recover the optical properties of superficial volume of a tissue phantom with less than 8% error.16 The diffusing probe we proposed employs a slab of highly scattering Spectralon (Labsphere, New Hampshire) ( , ) that is placed in contact with the surface of the sample under investigation (Fig. 1 ). This scattering layer causes photons emitted from the source optical fiber to undergo multiple scattering. This enables us to employ a modified two-layer (MTL) standard diffusion model to recover the sample optical properties, even under the condition that the source-detector separation is less than 3 transport mean free paths.16 We successfully applied the diffusing probe to study the optical properties of in vivo human skin. 22 We are planning to use the diffusing probe in many clinical applications. To correctly interpret in vivo measurement results obtained from the diffusing probe, it is critical to characterize and understand the effects of parameters of the diffusing probe that may impact the interrogation volume. The primary objective of this paper is to methodically examine the influence of sample optical properties and probe parameters on the depth of interrogation of the diffusing probe. In this paper, we first demonstrate the accuracy and the advantage of the MTL diffusion model over a standard diffusion approach. The performance of the diffusion model, in either MTL geometry or semiinfinite geometry, was evaluated by a benchmark Monte Carlo model. While the reflectance generated from the Monte Carlo model is sensitive to the choice of the scattering phase function when the source-detector separation is smaller than , the Monte Carlo model is usually employed23, 24 as the gold standard method to calculate diffuse reflectance when the source-detector separation is larger than . It was reported that when using different scattering phase functions in the Monte Carlo model, the difference in generated reflectance was less than 10% when the source-detector separation was21 larger than . Thus, in this study, to use the Monte Carlo model as a benchmark method, we limit the source-detector separations to be larger than in all simulations. We also conducted numerous Monte Carlo simulations with the objective of investigating the dependence of the probing depth of the diffusing probe on the optical properties of samples, scattering, absorption, and thickness of the diffusing layer of the probe, as well as dependence on the source-detector separation. The simulation results presented provide design guidelines for a diffusing probe having specific interrogation depth characteristics. 2.Materials and MethodsThe superficial diffusing probe employs a source fiber that is coupled to a high-scattering, low-absorption Spectralon slab having known optical properties. Light must pass from the fiber, through the diffusing slab, and into the tissue that is being measured. The detection fiber penetrates the slab and is in contact with the sample, as shown in Fig. 1. In this geometry, the measured reflectance is described using a MTL diffusion model derived from a standard two-layer diffusion model.16, 25 Previously, we demonstrated16, 22 that the diffusing probe can be used to accurately determine optical properties of homogeneous tissue phantoms at and human skin in the range from . To quantitatively evaluate the accuracy of the MTL diffusion model and estimate the effects of various parameters on the interrogation depth of the diffusing probe, we carried out a series of Monte Carlo simulations. The Monte Carlo code used here is an extension of the general multilayer, 3-D, weighted photon Monte Carlo code developed by Wang 26 Kienle and Patterson17 indicated that the asymmetry parameter of tissue is normally greater than 0.8, and an asymmetry parameter between 0.8 and 1 does not significantly influence the reflectance when is constant. Therefore, for all simulations, we employed a Henyey-Greenstein phase function and used an asymmetry parameter of 0.8 for all layers to speed up computation. In the simulations, the optical properties of the diffusing layer (Spectralon) was set at , and . The lateral dimensions of the diffusing layer and samples were set to to simulate infinite lateral dimensions of the diffusing layer and samples. Samples were assumed to be homogenous with a thickness of . In reality, the radius of the diffusing slab used in the -source-detector-separation diffusing probe is about , and this diffusing probe has been demonstrated to be able to precisely recover sample optical properties with a MTL diffusion model.27 In this paper, we will first evaluate the performance of the MTL diffusion model and compare it to the diffusion model in semiinfinite geometry. We utilize the Monte Carlo model, which is in either MTL geometry or semiinfinite geometry, to generate a benchmark frequency domain reflectance that contains phase and amplitude information. Therefore, we can quantitatively calculate the deviation of the frequency domain reflectance generated from the diffusion model, in either geometry, from the benchmark values. Second, we vary sample optical properties, source-detector separation, and the properties of the diffusing slab in the Monte Carlo model to understand their effect on the interrogation depth of the diffusing probe. We describe the interrogation depth of each Monte Carlo simulation in the following manner. Let , where is the final weight of a detected photon packet, and is the number of photon packets launched. The average interrogation depth of a simulation is determined as , where is the average penetration depth of a detected photon packet, is the depth at which a collision happens in the sample, and is the total collision number in the sample of the detected photon packet. The standard deviation of each simulation is also calculated, which represents the variance of the result. Moreover, to visualize the distribution of detected photon packets in the superficial diffusing probe geometry, we generate 2-D fluence distribution maps using Monte Carlo simulations. When a photon packet undergoes a collision, a fraction of energy of the photon packet, which is proportional to the weight of the photon packet and the absorption of the medium, is deposited to a local voxel in a 3-D Cartesian coordinate system.26 Voxel size is set to be or when the source-detector separation is 1 or , respectively, in our simulations. Local fluence (in joules per square millimeter) is calculated by dividing the deposited energy by the local absorption coefficient. A 3-D photon fluence distribution map is obtained by accumulating the fluence distribution of all photon packets arriving at the detector. The 3-D map is converted to a 2-D map by binning along the axis. The maps are normalized by the number of photon packets launched and the volume of a voxel. The photon fluence maps presented here are plotted as logarithm base 10 for greater ease of visualization. To achieve a relative standard deviation in the predicted reflectance of , a total of 50 million photons were launched in each Monte Carlo simulation for calculating the average interrogation depth unless noted otherwise. Depending on the input parameters, between were required to complete a single simulation on an AMD Athlon FX-60-based PC. On the other hand, 50 million photon packets were used in each Monte Carlo simulation for calculating the fluence distribution map, and each required about to complete on an AMD Athlon FX-60-based computer. The value of each pixel in the map represents the average fluence of a certain volume. 3.Results and Discussion3.1.Comparison between the Monte Carlo Model and the Diffusion ModelIn this section, we demonstrate the accuracy of reflectance generated from the MTL diffusion model. Results obtained from the Monte Carlo model were used here as a benchmark. In addition, the advantages of using the MTL diffusion model over the conventional diffusion model is discussed. The Monte Carlo method and the diffusion model were employed to calculate the frequency domain diffuse reflectance in both the MTL geometry and the conventional semiinfinite geometry. In the simulations, the source-detector separation and the thickness of the diffusing layer were 1 and , respectively. Tissue samples had optical properties of either light skin or dark skin. The optical properties of light skin and dark skin used here were extracted from the ex vivo study conducted by Simpson 24 The optical properties of light skin and dark skin were and and and , respectively, at a wavelength of . Note that these properties agree with those that we have measured in vivo using a probe based on the MTL geometry.22 Amplitude demodulation and phase delay were determined in the source modulation frequency range within since our frequency domain photon migration (FDPM) instrument is capable of operating over this range of frequencies.28 The amplitude demodulation and phase delay reported by Monte Carlo simulations and the diffusion model in the MTL geometry and semiinfinite geometry are shown in Figs. 2 and 3 , respectively. In Figs. 2 and 3, the maximum percentage deviations of amplitude demodulation and phase delay of the MTL diffusion model from the Monte Carlo simulation results are less than 0.3 and 1.3%, respectively. In contrast, the conventional semiinfinite diffusion model generated amplitude demodulation and phase delay deviate from the Monte Carlo simulation results within 0.1 and 6.3%, respectively. Fig. 2(a) Amplitude demodulation and (b) phase delay versus source modulation frequency in the MTL geometry with source-detector separation. The thickness of the diffusing layer is . The asymmetry factor is 0.8 for both layers. The sample optical properties are designed to simulate light skin ( and ) and dark skin ( and ). Solid squares and upward facing triangle were generated from Monte Carlo simulations for light skin and dark skin, respectively. Circles and downward facing triangle were generated from the MTL diffusion model for light skin and dark skin, respectively.  Fig. 3(a) Amplitude demodulation and (b) phase delay versus source modulation frequency in the semiinfinite geometry with source-detector separation. The sample optical properties are designed to simulate light skin ( and ) and dark skin ( and ). The asymmetry factor is 0.8. Solid squares and upward facing triangle were generated from Monte Carlo simulations for light skin and dark skin, respectively. Circles and downward facing triangle were generated from the standard diffusion model for light skin and dark skin, respectively.  The results obtained using the diffusion model in the MTL geometry deviate by a smaller amount from the Monte Carlo model than do the results obtained for the diffusion model in the semi-infinite geometry. In the MTL geometry, the Spectralon layer diffuses the photons emitted from the source fiber, the photons leaving Spectralon and entering tissue sample have a widely varying initial incident angle to the tissue sample surface (this phenomenon can be visually seen in the photon fluence distribution maps that will be shown and discussed shortly). In contrast, in the semiinfinite geometry, all photons from the source fiber have the same incident angle to the sample. Therefore the paths of photons from the source to the detector in these two geometries are much different. From Monte Carlo simulations, we determined that the mean of total path lengths in the sample volume (not including the Spectralon) were 6.1 and for the MTL geometry and the semiinfinite geometry, respectively, when the source-detector separation was and the sample had optical properties of light skin. A longer traveling distance in the sample layer when the MTL geometry is employed means that light propagation in this geometry more closely mimics diffusion. The difference in traveling distance is , which is equivalent to 5.5 transport mean free paths in a medium that has optical properties of and . This explains the reason for the diffusion model performing better in the MTL geometry than in the semiinfinite geometry at a certain source-detector separation. In addition, from our simulation results (which are shown in Fig. 10 and 11 in Sec. 3.5), we found that the interrogation depth of the MTL geometry is 25 to 30% smaller than that of the conventional semiinfinite geometry, at source-detector separations of either 1 or . From the Monte Carlo simulations, it was found that most of photons have oblique incidence angles from the diffusing layer to the tissue layer in the MTL geometry. Therefore, photons have shallower interrogation depths in the MTL geometry than in the conventional semiinfinite geometry. This property makes the MTL geometry very suitable for investigating superficial volume of tissues. Fig. 10Average interrogation depth versus numerical aperture of fibers. The source-detector separations are 1 (lower plot) and (upper plot). The optical properties of the slab are and . The scattering slab thickness is . The asymmetry factor is 0.8 for both layers. The error bars represent standard deviation. 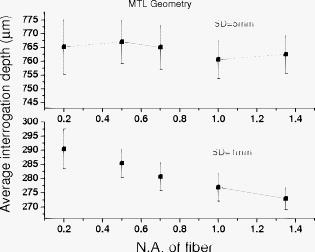 Fig. 11Average interrogation depth versus numerical aperture of fibers in the conventional semiinfinite geometry. The source-detector separations are 1 (lower plot) and (upper plot). The asymmetry factor is 0.8. The error bars represent standard deviation. 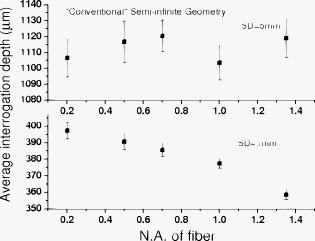 Although the MTL diffusion model results are more accurate than those for the conventional semiinfinite diffusion model results, the conventional semiinfinite diffusion model results deviate from the Monte Carlo results by less than 7%, which is not a large number for computing reflectance. Many researchers have also reported that the standard diffusion model deviates from Monte Carlo simulations by less than 5% even when the ratio of source-detector separation to transport mean free path is13, 15 close to 1. This means that, theoretically, a diffusion model in semiinfinite geometry can work properly in recovering sample optical properties even at the source-detector separation of . This also means that the MTL diffusion model may have similar performance compared to the diffusion model in semiinfinite geometry in recovering sample optical properties from experiment data. However, experimentally, we have found that the diffusion theory in the MTL geometry could accurately recover optical properties of tissue phantoms within 8% deviation with a source-detector separation, while the optical properties of the same phantoms recovered by diffusion theory in the semi-infinite geometry had maximum deviations of 60 to 100% when the source-detector separation was (Ref. 16). Yoo reported that, in the time-domain with smaller than 10, none of the theoretical data from the diffusion theory agrees with experimental results.14 Martelli 15 showed that the recovered from time-domain experiment data using the diffusion theory had about 8% error even when the is 10 and is 0. Both the model error resulting from the semiinfinite geometry diffusion theory and the measurement error resulting from the instruments contribute to the large deviation of experimentally recovered values from the true values. Thus, it can be concluded that the accuracy of applying the diffusion model to recover the experimental data is not commensurate with that predicted by computer simulations. Since the diffusion model in MTL geometry theoretically and experimentally performs better than the diffusion model in semiinfinite geometry at short source-detector separations, the diffusing probe is very suitable for studying in vivo superficial tissues. In the next few sections, we demonstrate the effect of several parameters on the interrogation depth of the diffusing probe. Our simulation results can provide a design guideline for a MTL geometry probe for a specific application. 3.2.Effects of Source-Detector SeparationBecause the MTL probe concept originates from a desire to rapidly measure local optical properties close to the source, we limit the analysis of source-detector separation to the range. A detailed analysis of this range follows. We have estimated the attenuation of light from source to detector in this geometry using Monte Carlo simulations of the MTL probe. The attenuation results as a function of source-detector separation are listed in Table 1 . In the simulations, the source-detector separation was either 1 or , the spectralon thickness was 1.5 or , and tissue samples were assigned optical properties corresponding to light skin or dark skin as defined in the Sec. 2. In our previous in vivo study, we employed a diffusing probe with thick Spectralon to successfully recover the optical properties of skin.22 Here, we have defined the Spectralon thicknesses to be 1.5 as well as to understand the influence of the thickness of the Spectralon on the signal attenuation. Table 1Light attenuation of the MTL geometry calculated with Monte Carlo simulations.
In the simulations, the source-detector (SD) separation was 1 or
5mm
, the Spectralon thickness was 1.5 or
3mm
, and tissue samples had optical properties of light skin (
μa=0.05∕mm
and
μs′=3∕mm
) or dark skin (
μa=0.3∕mm
and
μs′=3∕mm
). Simulation results shown in Table 1 indicate that when the Spectralon layer is thick, the attenuations are 22 and for light skin at 1 and source detector separations, respectively. In a typical frequency domain DOS system such as the one used in our lab, laser diodes deliver about of power into the sample. For such a system, with attenuation consistent with that estimated from Monte Carlo simulations, this means that the light intensities will be about and at the detector for source-detector separations of 1 and , respectively. If, on the other hand, the sample is similar to dark skin (as described in Sec. 2), the estimated attenuations will be in the range of 24 and at 1- and source-detector separations respectively. Using our frequency domain DOS system as an example, this will result in a light intensities of and at the detector, respectively. A typical detector used in the frequency domain DOS measurement is the Hamamatsu APD (model# C5658, Hamamatsu, New Jersey), which has noise level of around . Therefore, a source-detector separation is about the largest distance one can use in the frequency domain measurements with this probe design. This is in agreement with our experience in terms of using this probe to measure in vivo skin.22 Interestingly, at a source-detector separation of , the estimated attenuation is reduced when the Spectralon layer thickness is adjusted from for measuring dark skin. Because Spectralon essentially doesn’t absorb light ( and ), when it is thicker, more photons will travel in the Spectralon longer in terms of time, to take a “shortcut” of sorts, leaving the Spectralon at a location near the detector, passing through very little sample, and finally arriving at the detector. When photons travel in a sample having a high absorption coefficient, such as dark skin, such a “shortcut” can result in photons experiencing less absorption before they arrive at the detector than they would have experienced for a thinner slab of Spectralon. Hence, the estimated attenuation at a source-detector separation of is greater for -thick Spectralon than it is for -thick Spectralon (all other things being equal) when the sample under investigation has high absorption. On the other hand, the loss of photons introduced by the high scattering of the Spectralon is still significant to the system. Therefore, when the sample has moderate absorption, which is the case with light skin, the “shortcut” effect is not obvious, as demonstrated in Table 1. From Table 1, for skin applications and assuming the scattering coefficient for all skin phototypes is the same,24 the absorption coefficient of is the threshold point to observe this phenomenon. We show more simulation results to elaborate on this in a later section (and in Fig. 6 in Sec. 3.3 and Fig. 8 in Sec. 3.4). Fig. 6Photon fluence distribution maps for a diffusing probe having source-detector separations of (a) 1 or (b) . The sample optical properties are designed to simulate light color skin ( and ). The thickness of the diffusing slab is , and the optical properties of the slab are and . The asymmetry factor is 0.8 for both layers.  Fig. 8Photon fluence distribution maps for a superficial diffusing probe having source-detector separations of (a) 1 and (b) . The thickness of the diffusing slab is . The sample optical properties are designed to simulate light color skin ( and ). The optical properties of the slab are and . The asymmetry factor is 0.8 for both layers.  3.3.Interrogation Depth: Role of Sample Optical Properties and Source-Detector SeparationIt is known that the optical properties of tissue influence the interrogation depth of DOS techniques.6 Because the geometry that we have introduced is somewhat unusual, it is not necessarily obvious how the interrogation depth will be affected by sample optical properties. Hence, Monte Carlo simulations were carried out in an effort to determine the average interrogation depths of the superficial diffusing probe for near-IR optical properties corresponding to those of various biological tissues. The range of sample optical properties used in the simulations was carefully chosen based on a survey of the literature so as to be inclusive of superficial tissues optical properties in the wavelength range. Hornung 29 reported that the optical properties of cervical tissues are in the range from for and for at the wavelength of . Bays 10 determined the optical properties of human esophageal wall to be and at the wavelength of . Simpson 24 performed measurements on skin and showed that the optical properties are and and and for African and Caucasian skin, respectively, at a wavelength of . Based on these results, the range of optical properties used here was and . Indices of refraction of the scattering slab and the sample were taken to be 1.35 and 1.37, respectively. Figures 5a and 5b (in the next paragraph) illustrate variation in estimated average interrogation depth as a function of sample optical properties for the source-detector separations of 1 and , respectively. The circles shown in Fig. 4 are the data generated from Monte Carlo simulations. In general, the interrogation depth increases as absorption and reduced scattering coefficients decrease. When the source-detector separation is , the average interrogation depth varies from as the optical properties vary from and (low absorption, low scattering) to and (high absorption, high scattering). When the source-detector separation is , the average interrogation depth varies from as the optical properties vary from and (low absorption, low scattering) to and (high absorption, high scattering). We also employed the nonlinear surface fitting toolbox from OriginPro 8 (OriginLab Co., Massachusetts) to find two functions that best describe the data points shown in Figs. 4a and 4b. We found the following equation that well relates the interrogation depth to the optical properties ( and ) of samples: For the data shown in Fig. 4a we obtained the following fitting parameter values: , , , , , , , , , and . For the data shown in Fig. 4b, we obtained the following fitting parameter values: , , , , , , , , , . The surfaces demonstrated in Figs. 4a and 4b are the fitting results based on Eq. 1 and the parameter values listed in the preceding.Fig. 4Average interrogation depth of the superficial diffusing probe versus sample optical properties. Simulation results are depicted for probes having source-detector separations of (a) 1 and (b) . Sample optical properties are in the ranges of and . Other parameters used in the simulations include for the thickness of the diffusing layer and 0.8 for the asymmetry factor . Circles are the data generated from Monte Carlo simulations. Surfaces are obtained by using Eq. 1 to fit discrete data points. 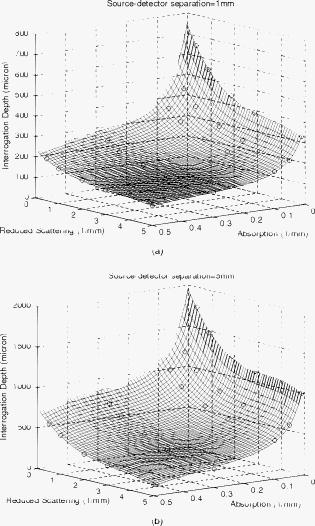 Fig. 5Average interrogation depth versus the source-detector separation. Triangles and circles represent the interrogation depth of the diffusing probe applied to dark skin ( and ) and light skin ( and ), respectively. The two straight lines are fit to the data. The thickness of the diffusing slab is , and the optical properties of the slab are and . The asymmetry factor is 0.8 for both layers. The error bars represent standard deviation.  Figure 5 shows Monte Carlo simulation results that illustrate average interrogation depth versus source-detector separation for samples having optical properties of light and dark skin as described earlier. The average interrogation depth increases linearly with source-detector separation in the range from , despite differences in optical properties of samples. Monte Carlo simulations were used by other groups to aid in probe design.30 In practice, Eq. 1 and Fig. 5 can be used to guide the design of the diffusing probe for a particular application. For example, to achieve similar interrogation depth when applying the diffusing probe to study light skin and dark skin, according to Fig. 5, one could use diffusing probes of 1 and source-detector separations to study light skin and dark skin, respectively, to obtain an interrogation depth of around . From Fig. 5, it can be clearly seen that the source-detector separation is a dominant factor that can modulate the interrogation depth of the diffusing probe. To visualize the effect of adjusting the source-detector separation on the sampling region, Fig. 6 illustrates Monte Carlo simulated photon fluence distribution maps for a sample having optical properties mimicking light skin ( and ) measured in the MTL geometry, which has a Spectralon thickness of and a source-detector separation of 1 or . Other parameters used in the simulations were consistent with those used to generate Fig. 4. In general, Fig. 6 shows that the interrogation region of a diffusing probe has the shape close to a semioval. The photon fluence distribution in the sample for a source-detector separation diffusing probe is wider and deeper than that for a source-detector separation diffusing probe. In Figs. 6a and 6b, the magnitude of the photon fluence beneath the detector of the source-detector separation probe is weaker than that of the source-detector separation probe by a factor of 100. The rapid decline in detected photon fluence as the source-detector separation increases limits the largest source-detector separation that can be employed in real measurements. 3.4.Interrogation Depth versus Absorption, Scattering, and Thickness of the Scattering LayerIn this section we investigate the influence of probe parameters related to the diffusing layer on the interrogation depth of the diffusing probe. Figure 7 shows the simulated dependence of the interrogation depth of the diffusing probe on the diffusing slab thickness and the absorption coefficient at source-detector separations of 1 and . The sample optical properties employed here are those of light and dark skin as detailed in the previous subsection. Fig. 7Average interrogation depth versus absorption coefficient of the diffusing slab when the source-detector separation is (a) 1 or (b) . The diffusing slab thicknesses of 1.5 (empty) and (solid) are employed in each plot. Simulated tissues have optical properties of dark skin ( and , triangles) and light skin ( and , circles). The asymmetry factor is 0.8 for both layers. The error bars represent standard deviation.  For the purposes of these simulations, the of the diffusing layer was varied from . In Figs. 8a and 8b, the simulation results illustrate that a variation of less than 0.1% in interrogation depths was introduced by varying the absorption coefficient of the scattering slab for different probe source-detector separations and sample optical properties. Absorption coefficients larger than were not considered here since the purpose of employing a scattering slab is to cause photons to undergo many scattering collisions at very short distances from the source. Increasing the absorption coefficient of the slab would increase competition between absorption and scattering and attenuate the detected signal. The absorption of the scattering slab in the range considered has almost no influence on the average interrogation depth of the diffusing probe. This suggests that the absorption of the scattering slab within this limited range of absorption values has a negligible effect on the fluence distribution of the detected photons in the scattering slab. Using a slab with an absorption coefficient as small as possible is beneficial for maximizing the detected reflectance signal. The results presented in Fig. 7 suggest that the interrogation depth of the diffusing probe can be affected by the thickness of the scattering slab. Figure 7a shows that when employing a source-detector separation diffusing probe to measure light skin and the thickness of the scattering slab is adjusted from , the average interrogation depth increases by . On the other hand, in Fig. 7b, the average interrogation depth decreases by when a source-detector separation diffusing probe is applied to measure light skin and the thickness of scattering slab is adjusted from . The range of variation of interrogation depth introduced by adjusting the scattering slab thickness is larger for the source-detector separation diffusing probe than that for the source-detector separation diffusing probe. In addition, the trends in the variation in the interrogation depths are opposite for these two cases. This is reinforced with two additional photon fluence distribution maps as shown in Fig. 8. Figures 8a and 8b depict simulated photon fluence distribution maps for probes having a -thick scattering slab and with source-detector separations of 1 and , respectively. Other parameters are identical to those used to generate Fig. 6. Comparing Fig. 6a and Fig. 8a, it is clear that the interrogation region is widened when the scattering slab thickness of a source-detector separation diffusing probe increases from . Increasing slab thickness results in greater lateral propagation of light. The positions of the detectors are fixed at from the source in both Fig. 6a and Fig. 8a. Thus, in Fig. 8a, as photons propagate laterally more than from the source in the scattering slab, photons have to travel in the sample at a average depth deeper than the average depth determined in the Fig. 6a before they arrive at the detector. Therefore, the interrogation depth of a source-detector separation diffusing probe increases as the thickness of the scattering slab increases from . In contrast, when the source-detector separation is , the magnitude of the photon fluence in the scattering slab at the lateral position of the detector is greater in Fig. 8b than that in Fig. 6b. As the thickness of the scattering slab increases, so does the number of photons that travel through the slab to positions near the detector before entering the sample. Those photons will be more likely to travel superficial trajectories in the sample prior to detection. Accordingly, the interrogation region becomes more concentrated near the top of the sample as the thickness of the scattering slab of a source-detector separation diffusing probe is increased from . The detailed dependence of the interrogation depth on the scattering slab thickness for various source-detector separations is shown in Fig. 9 . For this set of simulations, the thickness of the scattering slab is varied from while the source-detector separation is varied from . The reason for setting the lower bound and upper bound of the Spectralon thickness to 0.75 and , respectively, is to understand the effect of varying the Spectralon thickness of the currently working prototype, which has a Spectralon thickness. The optical properties of the scattering slab and the sample are and , and and , respectively. It can be seen that the thickness of the scattering slab has a relatively smaller influence on the interrogation depth of a source-detector separation diffusing probe compared to 3- and source-detector separation diffusing probes. For probes having source-detector separations of 3 and , the interrogation depth increases as the scattering layer thickness decreases, as shown in Figs. 6b and 8b. Fig. 9Average interrogation depth versus thickness of the diffusing slab. The source-detector separations employed in the simulations are 1 (square), 3 (circle), and (triangle). The optical properties of the slab and the sample are and and and , respectively. The asymmetry factor is 0.8 for both layers. The error bars represent standard deviation. 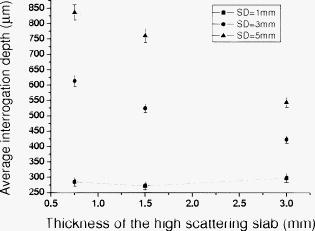 We also carried out a series of Monte Carlo simulations to study the dependence of the interrogation depths of the diffusing probe on the of the scattering slab. The absorption coefficient of the scattering slab is while other parameters are the same as those used to generate Fig. 7. When the of the scattering slab is adjusted from the interrogation depth varies less than 2%, which is smaller than the standard deviation of simulations, for a particular source-detector separation. Changing the optical properties of the sample or the thickness of the scattering slab used in the simulations does not alter this trend. This means that the of the scattering slab does not play a critical role in modulating the interrogation of the probe. Moreover, our simulation results reveal that the photon detection efficiency would become worse when employing a scattering slab of a certain thickness with a higher scattering coefficient. Therefore, the scattering coefficient of the diffusing layer should be chosen just high enough to make the diffusion approximation valid so that the photon detection efficiency would not be compromised. To make the diffusion approximation valid in the case where photons transmitting through a slab consist of scatters and absorbers, the slab must have the reduced scattering coefficient much greater than the absorption coefficient and the slab thickness should be larger than , where is the transport mean free path.31 Thus, when designing the probe, one must consider both the thickness and the of the diffusing layer to meet the requirements for validity of the diffusion approximation. The thinnest diffusing layer that satisfies the diffusion approximation can therefore be estimated to be when the of the slab (Spectralon) is at . Practically, when choosing the scattering slab thickness for a probe, in addition to the validity of the diffusion approximation, the limitations in fabrication and material, such as rigidity of the Spectralon slab and the robustness of the probe, should also be taken into account. We have found that a Spectralon slab with a thickness can be used to reliably fabricate a probe for skin measurements.27 In principle, any material with high scattering and low absorption properties can be used as the scattering slab in a diffusing probe. The thickness of the material should be determined based on the scattering property and the mechanical strength of the material, which affect the validity of the diffusion approximation and probe reliability, respectively. 3.5.Interrogation Depths versus Numerical Aperture and Phase Function of the Scattering LayerWe also investigated the influence of the numerical aperture (NA) of fibers on the interrogation depth. Simulations were carried out using 1- and source-detector separations for a scattering slab thickness. One hundred million photons were used in the simulations to achieve a standard deviation smaller than 3%. The optical properties of the scattering slab and the sample are and and and , respectively. The NA of detection and source fibers was varied from 0.2 to 1.35. Indices of refraction of the scattering slab and the sample were 1.35 and 1.37, respectively. The simulation results are shown in Fig. 10. The average interrogation depth decreases as the numerical aperture of detection fiber increases. This trend holds for but not for , where SD is source-detector separation. Note that when the NA of fiber decreases from 1.35 to 0.2 and source-detector separation is , the average interrogation depth increases by with standard deviation of 2 to 3%. With the same setup, the average interrogation depth of a semiinfinite geometry probe with source-detector separation versus the NA of detection fiber is shown in Fig. 11. The variation of the interrogation depth is about 10% when the NA of detection fiber is changed from 0.2 to 1.35. Compared to the semiinfinite geometry, the interrogation depth of the MTL geometry has a weak dependence on the NA of the detection fiber. Both the MTL geometry and the semiinfinite geometry lose the dependence of interrogation depth on the NA of detection fiber when the source detector separation is increased to . Although the NA has been shown to have moderate influence on the interrogation depth of the semiinfinite probing geometry, the weak influence of NA on the interrogation depth of the MTL geometry makes it a less effective parameter in modulating the probing depth compared to the source detector separation and the scattering layer thickness layer thickness. 32 Note again that, as shown in Figs. 10 and 11, the interrogation depth of the MTL geometry is, in general, 25 to 30% shallower than that of the semiinfinite geometry at the same source-detector separation. This result is caused by the oblique incidence angle of photons traveling from the diffusing layer to the tissue layer in the MTL geometry. Similar phenomenon has been reported by Wang 32 Finally, since the reduced scattering coefficient can be expressed as , where is the scattering coefficient, and is the asymmetry factor, one might wonder about the effect of of the scattering slab on the interrogation depth of the probe. We carried out Monte Carlo simulations to calculate the average interrogation depths for the asymmetry factor of the scattering slab ranging from 0.01 to 0.9. The scattering slab thickness was and the optical properties of the scattering slab and the sample were and and and , respectively. The average interrogation depth was determined as and for source-detector separations of 1 and , respectively. When the asymmetry factor is varied from 0.01 to 0.9, the interrogation depth is not affected by the asymmetry factor of the scattering slab despite using different source-detector separations. However, our simulation results indicate that the detection efficiency is decreased by a factor of 10 when the asymmetry factor is varied from 0.9 to 0.01. Thus, choosing a scattering material with high asymmetry factor number, such as Spectralon or white Delrin, as the diffusing layer of a diffusing probe is advantageous for promoting the photon detection efficiency. In addition, we also carried out a series of Monte Carlo simulations to investigate the effect of the asymmetry factor of tissue samples on the interrogation depth of the diffusing probe. In the simulations, we designed the tissue asymmetry factors to be in the range from 0.8 to 0.99. Other parameters were the same as those already mentioned. When the source-detector separation was , the interrogation depths were determined to be . Our simulation results infer that the influence of the tissue asymmetry factor on the interrogation depth of the diffusing probe is weak. Therefore the simulation results shown in this work can also apply to the cases where the asymmetry factor of superficial tissues is higher than 0.8. 4.ConclusionWe used the results of Monte Carlo simulations to characterize and illustrate the properties of the MTL geometry and contrast this to conventional semiinfinite geometry. We found that the diffusion theory performs better in the MTL geometry than in the conventional semiinfinite geometry at short source-detector separations. In addition, the probing depth of the MTL geometry is smaller than that of the semiinfinite geometry at a same source-detector separation. We then demonstrated the relationship between the interrogation depth and several parameters of the superficial diffusing probe in MTL geometry, including sample optical properties, source-detector separations, and the properties of the diffusing slab. The results from Monte Carlo simulations illustrate that the optical properties of the samples play a significant role in modulating the interrogation depth of the diffusing probe. The two dominant probe parameters that influence the interrogation depth of a diffusing probe are the source-detector separation and the thickness of the scattering layer. The average interrogation depth of the diffusing probe varies linearly with the source-detector separation in the range from . The diffusing probe generally has shallower interrogation depth than a conventional DOS probe at a same source-detector separation. In addition, as shown in Figs. 10 and 11, the dependence of the interrogation depths on the source-detector separation of the diffusing probe is weaker than that of a semiinfinite geometry probe. Although the thickness of the scattering layer has an effect on the interrogation depth, we illustrated that the magnitude of this effect depends on the source-detector separation. To choose a proper scattering layer thickness for a diffusing probe, both the validity of the diffusion approximation and the probe reliability should be taken into consideration. On the other hand, the dependence of the interrogation depths on the NA of detection fiber is much weaker than that of a semiinfinite geometry probe. Thus, the NA of the detection fiber is not an efficient parameter that can be used to control the interrogation depth. While the optical properties, including absorption coefficient, reduced scattering coefficient, and asymmetry factor, of the diffusing slab have a negligible influence on the interrogation depth, they can greatly affect the photon detection efficiency. Our simulation results provide guidelines for designing a diffusing probe with a specific average interrogation depth for various clinical applications, including skin hydration measurements, monitoring of the oral cavity, and optical characterization of skin cancer and precancer. AcknowledgmentsDr. Tseng would like to acknowledge the support provided by the National Science Council of Taiwan under Grant No. NSC-98-2218-E-006-013. Dr. Durkin is supported by the National Institutes of Health/National Center for Research Resources (NCRR) under Grant No. P41-RR01192 (Laser Microbeam and Medical Program: LAMMP). ReferencesR. Cubeddu, A. Pifferi, P. Taroni, A. Torricelli, and G. Valentini,
“Noninvasive absorption and scattering spectroscopy of bulk diffusive media: An application to the optical characterization of human breast,”
Appl. Phys. Lett., 74 874
–876
(1999). https://doi.org/10.1063/1.123395 0003-6951 Google Scholar
F. Bevilacqua, A. J. Berger, A. E. Cerussi, D. Jakubowski, and B. J. Tromberg,
“Broadband absorption spectroscopy in turbid media by combined frequency-domain and steady-state methods,”
Appl. Opt., 39 6498
–6507
(2000). https://doi.org/10.1364/AO.39.006498 0003-6935 Google Scholar
J. R. Mourant, J. P. Freyer, A. H. Hielscher, A. A. Eick, D. Shen, and T. M. Johnson,
“Mechanisms of light scattering from biological cells relevant to noninvasive optical-tissue diagnostics,”
Appl. Opt., 37 3586
–3593
(1998). https://doi.org/10.1364/AO.37.003586 0003-6935 Google Scholar
A. Cerussi, N. Shah, D. Hsiang, A. Durkin, J. Butler, and B. J. Tromberg,
“In vivo absorption, scattering, and physiologic properties of 58 malignant breast tumors determined by broadband diffuse optical spectroscopy,”
J. Biomed. Opt., 11 044005
(2006). https://doi.org/10.1117/1.2337546 1083-3668 Google Scholar
F. Bevilacqua and C. Depeursinge,
“Monte Carlo study of diffuse reflectance at source-detector separations close to one transport mean free path,”
J. Opt. Soc. Am. A Opt. Image Sci. Vis, 16 2935
–2945
(1999). https://doi.org/10.1364/JOSAA.16.002935 1084-7529 Google Scholar
F. Bevilacqua, J. S. You, C. K. Hayakawa, and V. Venugopalan,
“Sampling tissue volumes using frequency-domain photon migration,”
Phys. Rev. E, 69 051908
(2004). https://doi.org/10.1103/PhysRevE.69.051908 1063-651X Google Scholar
B. J. Tromberg, N. Shah, R. Lanning, A. Cerussi, J. Espinoza, T. Pham, L. Svaasand, and J. Butler,
“Non-invasive in vivo characterization of breast tumors using photon migration spectroscopy,”
Neoplasia, 2 26
–40
(2000). https://doi.org/10.1038/sj.neo.7900082 1522-8002 Google Scholar
J. C. Hebden, A. Gibson, T. Austin, R. M. Yusof, N. Everdell, D. T. Delpy, S. R. Arridge, J. H. Meek, and J. S. Wyatt,
“Imaging changes in blood volume and oxygenation in the newborn infant brain using three-dimensional optical tomography,”
Phys. Med. Biol., 49 1117
–1130
(2004). https://doi.org/10.1088/0031-9155/49/7/003 0031-9155 Google Scholar
F. Bevilacqua, D. Piguet, P. Marquet, J. D. Gross, B. J. Tromberg, and C. Depeursinge,
“In vivo local determination of tissue optical properties: applications to human brain,”
Appl. Opt., 38 4939
–4950
(1999). https://doi.org/10.1364/AO.38.004939 0003-6935 Google Scholar
R. Bays, G. Wagnieres, D. Robert, D. Braichotte, J. F. Savary, P. Monnier, and H. van den Bergh,
“Clinical determination of tissue optical properties by endoscopic spatially resolved reflectometry,”
Appl. Opt., 35 1756
–1766
(1996). https://doi.org/10.1364/AO.35.001756 0003-6935 Google Scholar
A. Amelink, H. J. C. M. Sterenborg, M. P. L. Bard, and S. A. Burgers,
“In vivo measurement of the local optical properties of tissue by use of differential path-length spectroscopy,”
Opt. Lett., 29 1087
–1089
(2004). https://doi.org/10.1364/OL.29.001087 0146-9592 Google Scholar
A. Ishimaru, Wave Propagation and Scattering in Random Media, Academic Press, New York (1978). Google Scholar
A. Kienle and M. S. Patterson,
“Improved solutions of the steady-state and the time-resolved diffusion equations for reflectance from a semi-infinite turbid medium,”
J. Opt. Soc. Am. A Opt. Image Sci. Vis, 14 246
–254
(1997). https://doi.org/10.1364/JOSAA.14.000246 1084-7529 Google Scholar
K. M. Yoo, F. Liu, and R. R. Alfano,
“When does the diffusion-approximation fail to describe photon transport in random-media,”
Phys. Rev. Lett., 64 2647
–2650
(1990). https://doi.org/10.1103/PhysRevLett.64.2647 0031-9007 Google Scholar
F. Martelli, M. Bassani, L. Alianelli, L. Zangheri, and G. Zaccanti,
“Accuracy of the diffusion equation to describe photon migration through an infinite medium: numerical and experimental investigation,”
Phys. Med. Biol., 45 1359
–1373
(2000). https://doi.org/10.1088/0031-9155/45/5/318 0031-9155 Google Scholar
S. H. Tseng, C. Hayakawa, B. J. Tromberg, J. Spanier, and A. J. Durkin,
“Quantitative spectroscopy of superficial turbid media,”
Opt. Lett., 30 3165
–3167
(2005). https://doi.org/10.1364/OL.30.003165 0146-9592 Google Scholar
A. Kienle and M. S. Patterson,
“Determination of the optical properties of turbid media from a single Monte Carlo simulation,”
Phys. Med. Biol., 41 2221
–2227
(1996). https://doi.org/10.1088/0031-9155/41/10/026 0031-9155 Google Scholar
S. A. Carp, S. A. Prahl, and V. Venugopalan,
“Radiative transport in the delta-P-1 approximation: accuracy of fluence rate and optical penetration depth predictions in turbid semi-infinite media,”
J. Biomed. Opt., 9 632
–647
(2004). https://doi.org/10.1117/1.1695412 1083-3668 Google Scholar
E. L. Hull and T. H. Foster,
“Steady-state reflectance spectroscopy in the P-3 approximation,”
J. Opt. Soc. Am. A Opt. Image Sci. Vis, 18 584
–599
(2001). https://doi.org/10.1364/JOSAA.18.000584 1084-7529 Google Scholar
P. Thueler, I. Charvet, F. Bevilacqua, M. St Ghislain, G. Ory, P. Marquet, P. Meda, B. Vermeulen, and C. Depeursinge,
“In vivo endoscopic tissue diagnostics based on spectroscopic absorption, scattering, and phase function properties,”
J. Biomed. Opt., 8 495
–503
(2003). https://doi.org/10.1117/1.1578494 1083-3668 Google Scholar
Q. Liu and N. Ramanujam,
“Scaling method for fast Monte Carlo simulation of diffuse reflectance spectra from multilayered turbid media,”
J. Opt. Soc. Am. A Opt. Image Sci. Vis, 24 1011
–1025
(2007). https://doi.org/10.1364/JOSAA.24.001011 1084-7529 Google Scholar
S. H. Tseng, A. Grant, and A. J. Durkin,
“In vivo determination of skin near-infrared optical properties using diffuse optical spectroscopy,”
J. Biomed. Opt., 13 014016
(2008). https://doi.org/10.1117/1.2829772 1083-3668 Google Scholar
G. M. Palmer, C. Zhu, T. M. Breslin, F. Xu, K. W. Gilchrist, and N. Ramanujam,
“Monte Carlo-based inverse model for calculating tissue optical properties. Part II: application to breast cancer diagnosis,”
Appl. Opt., 45 1072
–1078
(2006). https://doi.org/10.1364/AO.45.001072 0003-6935 Google Scholar
C. R. Simpson, M. Kohl, M. Essenpreis, and M. Cope,
“Near-infrared optical properties of ex vivo human skin and subcutaneous tissues measured using the Monte Carlo inversion technique,”
Phys. Med. Biol., 43 2465
–2478
(1998). https://doi.org/10.1088/0031-9155/43/9/003 0031-9155 Google Scholar
A. Kienle, M. S. Patterson, N. Dognitz, R. Bays, G. Wagnieres, and H. van den Bergh,
“Noninvasive determination of the optical properties of two-layered turbid media,”
Appl. Opt., 37 779
–791
(1998). https://doi.org/10.1364/AO.37.000779 0003-6935 Google Scholar
L. H. Wang, S. L. Jacques, and L. Q. Zheng,
“Mcml—Monte-Carlo modeling of light transport in multilayered tissues,”
Comput. Methods Programs Biomed., 47 131
–146
(1995). https://doi.org/10.1016/0169-2607(95)01640-F 0169-2607 Google Scholar
S. H. Tseng, C. K. Hayakawa, J. Spanier, and A. J. Durkin,
“Determination of optical properties of superficial volumes of layered tissue phantoms,”
IEEE Trans. Biomed. Eng., 55 335
–339
(2008). https://doi.org/10.1109/TBME.2007.910685 0018-9294 Google Scholar
T. H. Pham, O. Coquoz, J. B. Fishkin, E. Anderson, and B. J. Tromberg,
“Broad bandwidth frequency domain instrument for quantitative tissue optical spectroscopy,”
Rev. Sci. Instrum., 71 2500
–2513
(2000). https://doi.org/10.1063/1.1150665 0034-6748 Google Scholar
R. Hornung, T. H. Pham, K. A. Keefe, M. W. Berns, Y. Tadir, and B. J. Tromberg,
“Quantitative near-infrared spectroscopy of cervical dysplasia in vivo,”
Hum. Reprod., 14 2908
–2916
(1999). https://doi.org/10.1093/humrep/14.11.2908 0268-1161 Google Scholar
Q. Liu and N. Ramanujam,
“Sequential estimation of optical properties of a two-layered epithelial tissue model from depth-resolved ultraviolet-visible diffuse reflectance spectra,”
Appl. Opt., 45 4776
–4790
(2006). https://doi.org/10.1364/AO.45.004776 0003-6935 Google Scholar
R. Elaloufi, R. Carminati, and J. J. Greffet,
“Diffusive-to-ballistic transition in dynamic light transmission through thin scattering slabs: a radiative transfer approach,”
J. Opt. Soc. Am. A Opt. Image Sci. Vis, 21 1430
–1437
(2004). https://doi.org/10.1364/JOSAA.21.001430 1084-7529 Google Scholar
A. M. Wang, J. E. Bender, J. Pfefer, U. Utzinger, and R. A. Drezek,
“Depth-sensitive reflectance measurements using obliquely oriented fiber probes,”
J. Biomed. Opt., 10 44017
(2005). https://doi.org/10.1117/1.1989335 1083-3668 Google Scholar
|


