
|
|
|
Förster (or fluorescence) resonance energy transfer (FRET) can be used as an in vivo nanoscale ruler to detect the distance between fluorophores or interacting proteins with attached fluorophores.1 In intensity-based FRET detection, sophisticated calibration and correction procedures are usually required to cope with intensity variations, spectral bleedthrough,2 back-bleedthrough,3 and photobleaching.4 In addition, nonspecific FRET, arising from random collisions of donor and acceptor and/or other unexpected associations of donor and acceptor, affects FRET accuracy, and although it can be detected, it may not be easily removed.5 Fluorescence lifetime imaging microscopy (FLIM) retrieves fluorophore lifetime data from fluorescence emission, and can be used to detect FRET with some advantages over intensity-based FRET.6 Interest in FLIM-FRET is growing, especially as commercial FLIM modules become available for confocal and multiphoton microscopy. However, accurate, unambiguous detection of molecular interactions in living cells remains experimentally challenging due to the presence of nonspecific FRET. In this study, we develop and apply a physiological FLIM system with experimental controls for and temperature stabilization to create a physiological environment for live-cell FLIM studies. Our purpose was to investigate how physiological FLIM affects FRET detection in living cells. To accomplish this, we studied a live-cell system involving Ras Homology Protein C (RhoC) inactive-form interactions. RhoC has been identified as a specific oncogene marker of aggressive breast cancers.7 When active, it is anchored on the cell membrane, interacting with effectors. When inactive, it is bound to its inhibitor in the cytoplasm.8 Interactions between and RhoC caused FRET to occur from the donor (cerulean, attached to ) to the acceptor (citrine, attached to RhoC) in our experimental cellular group, as in Fig. 1a . In the positive control cellular group, Fig. 1b, cerulean was linked to citrine, and therefore FRET must occur. Two negative control cellular groups [Fig. 1c] were implemented: cerulean- alone, which had no FRET occurring, and cerulean- , which indicated nonspecific FRET. Living CV1 cells (monkey kidney epithelial cells) were either single- or double-transfected with the plasmids encoding corresponding fusion proteins using GeneJammer transfection reagent (Stratagene, La Jolla, California).8 Fig. 1Schematic depiction of FRET studies on RhoC and . (a) The experimental cellular group cerulean- -RhoC (with FRET). (b) The positive control cellular group cerulean-citrine (with FRET). (c) Two negative control cellular groups: cerulean- alone (no FRET) and cerulean- (nonspecific FRET). Fluorophore excitation and emission maxima are labeled. 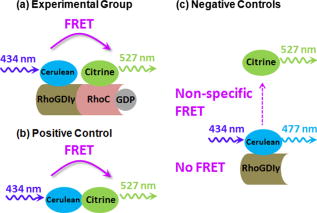 The time-domain FLIM system employed a tunable picosecond laser for excitation, an ultrafast gated, intensified charge-coupled device (CCD) camera for detection, and achieved lifetime discrimination.9 In this study, cerulean fluorescence was excited at using the laser dye Coumarin 440 and collected at . Because cerulean lifetime may decrease under prolonged irradiation,10 we eliminated this potential effect by exciting all cellular groups similarly and with short excitation times ( for each cell). In retrieving lifetime values, a four-gate protocol with a linearized least-square fitting method was used.8 The gate width was and the time interval between two consecutive gates was . Temperature control at was achieved by using Delta T dishes along with a plate heater and an objective heater (Bioptechs, Incorporated, Butler, Pennsylvania) for all studies reported here. The flow of into the Delta T dishes was controlled by a peristaltic pump (Model P720, Instech Laboratories, Incorporated, Plymouth Meeting, Pennsylvania) connected to the Delta T perfused heated lid (Bioptechs, Incorporated) enclosing the dishes. The heated lid had two ports, which could be used for perfusion. When the flow rate was approximately , the pH value in the cell culture media became stable at in and remained stable for at least . Physiological data were acquired under these conditions. The achieved stable pH value could be adjusted by increasing or decreasing the flow rate, while the absence of flow caused the pH value to reach in and to increase continuously for at least . To statistically compare the mean values of FRET donor lifetimes or intensities among cellular groups, pixel data were averaged per cell and two-tailed student’s t-tests were used. We employed a conventional significance level of 0.1, even though we always obtained much smaller -values for stronger confirmation of statistical significance. Figure 2 compares donor fluorescence lifetime versus intensity measurements for live-cell FRET. Both temperature and controls were implemented. The donor lifetime values of the experimental cellular group were significantly smaller than the two negative controls , indicating FRET. The positive control cellular group (data not shown) also exhibited a shorter lifetime than the two negative controls, as expected. Intensity images, however, exhibited many more inter- and intracellular variations, thereby obscuring the detection of any possible FRET (both specific and nonspecific) occurring in this system. Figure 3 compares the precision of donor fluorescence intensity versus lifetime measurements, as quantified by relative standard deviation (RSD) values obtained from the FRET data in Fig. 2, and reveals the multifold improvement in precision when fluorescence lifetime data were used rather than fluorescence intensity data. Fig. 2Comparison of donor fluorescence lifetime vs intensity measurements for live-cell FRET. Representative images (top) and box plots of extracted values after pixel data were averaged per cell (bottom) for the FRET experimental cellular group (left) and the two negative control cellular groups (middle and right). The donor lifetime values of the experimental cellular group were significantly smaller than the two negative controls ( -value ), indicating FRET. This distinction was not discernable from intensity measurements, due to large inter- and intracellular variations ( -value ). Scale .  Fig. 3Precision of donor fluorescence intensity (gray bars) vs lifetime (slash-shaded bars) measurements as quantified by relative standard deviation (RSD) values for the FRET experimental cellular group (left) and the two negative control cellular groups (middle and right). Precision improved roughly seven-fold when fluorescence lifetime data were used rather than fluorescence intensity data. deviation/mean. The number of cells measured in each group is labeled at the top.  Table 1 presents -values from t-test comparisons among cellular groups, and demonstrates that only physiological FLIM led to statistically significant FRET results without being influenced by nonspecific FRET. The temperature was fixed at , while control was varied and both intensity and FLIM data were acquired. With physiological FLIM, the experimental group versus either negative control comparison had very small -values , which suggested molecular interactions were detected by FRET, while the comparison of the two negative controls gave a large -value (0.93), which suggested that no nonspecific FRET between cerulean and citrine occurred. Without physiological conditions, significant nonspecific FRET did occur, as indicated by the statistically significant -value from the comparison of the two negative controls for both FLIM and intensity data ( and , respectively), and thus affected the accuracy of any FRET detected. Table 1The p -values from t-test comparisons among cellular groups. The temperature was fixed at 37°C , while CO2 control was either implemented (left column under p -values) or not implemented (right column under p -values). Only physiological FLIM led to statistically significant results without nonspecific FRET.
Due to their high variability, intensity-based measurements also led to inconclusive results regarding the detection of molecular interactions. Physiological intensity measurements showed no statistically significant differences between the experimental cellular group and either negative control. The large -values obtained (0.44 and 0.19) reflected the large distributions of intensities of the FRET donor (Fig. 2) that masked the presence of molecular interactions. We attribute the slightly significant -value for the negative control comparison to these large intensity variations. Since the fluorescence intensity-based data presented here were not acquired and processed with sophisticated FRET calibration and correction procedures,2, 3 the comparisons of intensity and lifetime measurements should not be regarded as comparisons of intensity-based FRET detection and lifetime-based FRET detection. Rather, the key point is that lifetime-based FRET detection is relatively simple to implement and accomplish, without complicated corrections, while still offering statistically significant evidence for FRET. Nonspecific FRET is thought to arise from random collisions and/or other unexpected associations of donor and acceptor.5 Here, control stabilized the pH value of the cell culture media surrounding the cells at physiological values, and was found to eliminate nonspecific FRET in the live-cell FRET-FLIM experiments. Significant nonspecific FRET was observed in experiments conducted without control, when media pH values rose to unphysiological levels. It has been reported that nonspecific FRET was absent in a live-cell system when physiological conditions were employed,11 and we further demonstrated that these physiological conditions could be responsible for the elimination of nonspecific FRET in live-cell systems. We also observed somewhat higher variability in donor lifetime distributions for all cellular groups when was uncontrolled (average ) versus when control was implemented (average ). Given the potential influence of pH on protein stability, enzyme and ion channel activity, molecular conformation, and many other cellular and molecular processes, careful regulation of the cellular environment through physiological FLIM offers a valuable tool for FRET studies in living cells. Implementing physiological FLIM significantly improved FRET detection, clearly and unambiguously indicating the presence of specific molecular interactions between and RhoC in the live CV1 cells studied. The approach described here is generally applicable and should improve FRET detection in a variety of live-cell systems. AcknowledgmentsThis work was supported in part by the National Institutes of Health (CA-112173 and CA-77612), the Breast Cancer Research Foundation, and the Department of Defense Breast Cancer Program. ReferencesJ. Lippincott-Schwartz, E. Snapp, and A. Kenworthy,
“Studying protein dynamics in living cells,”
Nat. Rev. Mol. Cell Biol., 2
(6), 444
–456
(2001). https://doi.org/10.1038/35073068 1471-0072 Google Scholar
D. W. Piston and G. J. Kremers,
“Fluorescent protein FRET: the good, the bad and the ugly,”
Trends Biochem. Sci., 32
(9), 407
–414
(2007). https://doi.org/10.1016/j.tibs.2007.08.003 0167-7640 Google Scholar
Y. Chen, M. Elangovan, and A. Periasamy,
“FRET data analysis: the algorithm,”
Molecular Imaging, 126
–145 Eds.Oxford University Press, New York
(2005). Google Scholar
T. Zal and N. R. Gascoigne,
“Photobleaching-corrected FRET efficiency imaging of live cells,”
Biophys. J., 86
(6), 3923
–3939
(2004). https://doi.org/10.1529/biophysj.103.022087 0006-3495 Google Scholar
C. L. Takanishi, E. A. Bykova, W. Cheng, and J. Zheng,
“GFP-based FRET analysis in live cells,”
Brain Res., 1091 132
–139
(2006). https://doi.org/10.1016/j.brainres.2006.01.119 0006-8993 Google Scholar
C. W. Chang, D. Sud, and M. A. Mycek,
“Fluorescence lifetime imaging microscopy,”
Methods Cell Biol., 81 495
–524
(2007). https://doi.org/10.1016/S0091-679X(06)81024-1 0091-679X Google Scholar
A. C. Ventura and S. D. Merajver,
“Genetic determinants of aggressive breast cancer,”
Annu. Rev. Med., 59 199
–212
(2008). https://doi.org/10.1146/annurev.med.59.060106.184830 0066-4219 Google Scholar
W. Zhong, M. Wu, C. W. Chang, K. A. Merrick, S. D. Merajver, and M. A. Mycek,
“Picosecond-resolution fluorescence lifetime imaging microscopy: a useful tool for sensing molecular interactions in vivo via FRET,”
Opt. Express, 15
(26), 18220
–18235
(2007). https://doi.org/10.1364/OE.15.018220 1094-4087 Google Scholar
P. Urayama, W. Zhong, J. A. Beamish, F. K. Minn, R. D. Sloboda, K. H. Dragnev, E. Dmitrovsky, and M. A. Mycek,
“A UV-visible-NIR fluorescence lifetime imaging microscope for laser-based biological sensing with picosecond resolution,”
Appl. Phys. B: Lasers Opt., 76
(5), 483
–496
(2003). https://doi.org/10.1007/s00340–003–1152–4 0946-2171 Google Scholar
B. Hoffmann, T. Zimmer, N. Klocker, L. Kelbauskas, K. Konig, K. Benndorf, and C. Biskup,
“Prolonged irradiation of enhanced cyan fluorescent protein or cerulean can invalidate Forster resonance energy transfer measurements,”
J. Biomed. Opt., 13
(3), 031205
(2008). https://doi.org/10.1117/1.2937829 1083-3668 Google Scholar
C. N. Medine, C. Rickman, L. H. Chamberlain, and R. R. Duncan,
“Munc18-1 prevents the formation of ectopic SNARE complexes in living cells,”
J. Cell. Sci., 120
(24), 4407
–4415
(2007). https://doi.org/10.1242/jcs.020230 0021-9533 Google Scholar
|
||||||||||||||||||||||||||||||||||||||||


