|
|
|
Optical coherence tomography (OCT) is a noninvasive, noncontact imaging modality used to obtain cross sectional images of tissue structures with high resolution. Broadly, OCT has been classified into two categories: time-domain (TD)-OCT and Fourier-domain (FD)-OCT. Conventional TD-OCT can detect the echo time delays of light by measuring the interference signal as a function of time during a depth scan (A-scan) in a reference arm at each position of a lateral probe beam. In FD-OCT, instead of a mechanical A-scan, depth information can be retrieved by detecting the interference signal as a function of wavelength. In spectral-domain (SD) OCT, this is achieved with a broadband source and a spectrometer on the detector arm.1 Optical frequency domain imaging (OFDI) uses a swept source and point detector to acquire the same information.2 The main advantage of these schemes over TD-OCT is a marked increase in sensitivity and imaging speed.3 Spectrometers with a linear array detector and swept source normally operate at tens of kHz, which allows data acquisitions at video rates [ , (fps)]. FD-OCT images require resampling of the axial data from wavelength space to wavenumber space, and the subsequent application of the inverse Fourier transform. Therefore, although data acquisitions of high-speed FD-OCT are achieved at a higher rate than that of video, the display rate of OCT images often occurs at a much slower rate than the acquisition, because this heavy signal processing must be performed by a computer. One example of real-time display has been demonstrated by digital signal processing (DSP) hardware using a single field programmable gate array (FPGA) integrated circuit (IC) and a custom electronics board.4 The display frame rate for processed OCT images (1024 axial lateral A-scans) was in the SD-OCT system. This type of equipment is expensive, and must be custom built for FPGA technology To avoid calculating a numerical -space resampling prior to Fourier transform, a linear-in-wave-number (linear- ) spectrometer and -space linear swept source have been designed.5, 6, 7, 8 A linear- spectrometer consisting of a grating and an optical glass prism in the region not only saved computing time but also improved SNR falloff.5 The FD-OCT systems based on linear- techniques still require high speed fast Fourier transform (FFT) processing to realize real-time display of OCT images. Recently, one approach to accelerating numerical calculations has been to use a graphics processing unit (GPU) instead of a central processing unit (CPU). A GPU with many stream processors allows us to use highly parallel processors. The advantage of GPU computing is the implementation of high speed computation at a low cost, and simple programming on the host computer. In the field of optics, GPU techniques have been applied to reconstruct digital holograms.9, 10 In this work, we demonstrated real-time display on a linear- SD OCT system using GPU programming. We estimated the optimal combination of a diffractive grating and a prism for the linear- spectrometer in the spectral region. The computing time using the GPU was for data size of 2048 FFT lateral A-scans, and was shorter than the frame interval time using a line scan camera at . A display rate of for processed images was achieved using a low cost GPU. Figure 1 shows a schematic of our SD-OCT system. The output light of a superluminescent diode [SLD-370-HP, Superlum, (County Cork, Ireland), center wavelength , full-width at half-maximum spectral width ] was split into a sample and reference arm, with the latter terminated by a mirror. A probe at the end of the sample arm delivered light to a sample and received backscattered light from within the sample. Achromatic lenses were inserted in both arms. The predicted lateral resolution was . The light returned from the two interferometer arms was recombined and directed to a linear- spectrometer consisting of a diffraction grating (Wasatch Photonics, Volume Phase Holographic Grating, ) and an optical glass prism. When the incident angle is the blaze angle, , which gives the best diffraction efficiency, the first-order diffraction angle of light at a wavelength is where is the groove number of the grating. The output angle of the prism is where is the refractive index determined by the material. The parameters and are the apex angle of the prism and the angle between the grating and the prism, respectively. The light from the prism was focused on a line scan CCD camera (e2v Aviiva SM2, , pixel size, resolution) using an achromatic lens . The location of the spectral component at the CCD camera is described aswhere is the output angle of the light at the central location . The output of the camera was transferred to a personal computer (PC) via a camera link board (National Instruments, Austin, Texas, PCIe-1427, resolution). The sampled data were transferred to a GPU on a graphics card [Nvidia (Santa Clara, California) GeForce GTX 280, processor clock of , memory clock of , 240 stream processors, and memory ]. We used Nvidia’s compute unified device architecture (CUDA),11 which could be programmed in only a C language environment to implement the processing power of the GPUs. We developed software that included image acquisitions, GPU programming, and a graphical user interface environment in Microsoft Visual C++, 2008 Express Edition.Fig. 1Schematic of spectral domain optical coherence tomography with a linear-in-wave-number spectrometer. SLD, superluminescent diode; BS, beamsplitter; L, achromatic lens; , diffraction angle; , incident angle; , output angle of prism; , apex angle of prism; , angle between grating and prism; , central location of CCD camera. 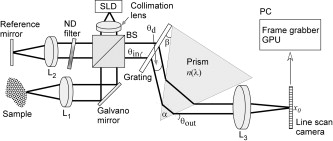 First we calculated the location of the spectral component at the focal plane in a wave number range between 7 and at each angle between the prism and the grating to optimize the linearity of the spectrometer. Here, the prism materials are BK7, F2, and SF10, with the angle . A comparison of the derivatives of the locations at the optimal angle with respect to wavenumber is shown in Fig. 2a . The optimal angle was estimated by the standard deviation of the derivatives, as shown in Fig. 2b. From these, the combination of the grating with and the F2 equilateral prism were suitable for the linear- spectrometer. Fig. 2Derivatives of the location of the spectral component at the optimal angle with respect to wave number. (b) Standard deviation of derivatives with respect to angle between the prism and the grating. 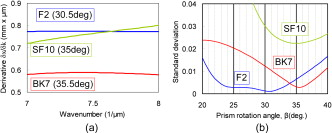 Next we estimated the computing time using a GPU, which operated in floating-point (single precision) mode. Figure 3 shows the flowchart of real-time OCT imaging. Initially, the reference intensity is measured for DC removal, and then stores in the memory on the GPU. In Fig. 3, the dash block shows the routine procedure in our system. First, a spectral interference image (2048 axial lateral pixels, resolution) is captured on the host computer and then is transferred to the GPU memory. Second, the type of data is converted from a integer to a floating point, and then the DC removal process is performed using the stored reference intensity. Here the real and imaginary parts of complex data are set to the processed data and zero, respectively. Third, the 2048-point FFT is performed for 1000 A-scans and then a log scaling process is performed to obtain an OCT image. We performed FFT processing using Nvidia’s CUDA FFT library (CUFFT).11 Finally, after converting the type of data from a floating point to a integer, the calculated result is transferred to the memory on the host computer and then is displayed on the monitor. The estimated computing time between the data transfer to the GPU memory and the data transfer from the GPU memory was and was shorter than the frame interval time using a line scan camera at . Consequently, the real-time display of the processed OCT images could be achieved using the GPU in our system. Fig. 3Flowchart of real-time OCT imaging. The dashed block shows the routine procedure in our system. 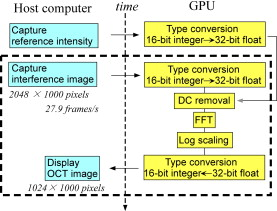 High performance computing can be achieved by Intel’s Math Kernel Library (MKL), which is a library of highly optimized, thread-safe, mathematical functions for an Intel CPU. Govindaraju have compared their novel algorithms of discrete Fourier transforms to CUFFT for the GPU and MKL on the CPU.12 Their algorithm was two times faster than the CUFFT on the GPU (Nvidia, GTX280) and 12 times faster than the MKL on the CPU (Intel QX9650 quad-core processor and memory) for computing the data size of 2048 FFT number of FFTs. From this comparison, we can understand that the CUFFT on the GPU was about six times faster than the MKL on the CPU. Finally, we measured the OCT images of a human finger pad in vivo. We used a commercial available F2 prism (Thorlabs Incorporated, Newton, New Jersey) for the linear- spectrometer. The spectrometer settings provided a spectral resolution of and a depth range of . With a probing power of and an integration time of , a sensitivity of was measured close to the zero delay and dropped to at depth. The probe beam was scanned at using the sawtooth waveform with a duty cycle of 90%, which was modified to reduce mechanical vibrations. Figure 4 and Videos 1 show the OCT images with an imaging range of a . We could obtain the OCT images without the resampling process, because the spectral linearity in the wave number was improved by a linear- spectrometer rather than a conventional spectrometer. Since it is not perfect linearity to achieve high precision OCT imaging, our OCT system needs to perform a resampling process using calibrated spectral data. The computing time on the GPU had a wide margin for the FFT process only in our SD-OCT system. Therefore, GPU programming has potential for implementing necessary signal processing such as resampling, spectral shaping of non-Gaussian spectral data, and dispersion compensation. The performance of a real-time display is very important for clinical applications that need immediate diagnosis for screening or biopsy/surgery. The GPU is an attractive tool for clinical and commercial systems because of its high performance computing and low cost. Fig. 4In vivo OCT images of a human finger pad at different positions. Imaging range: . E: epidermis. D: dermis. Scale bar: . 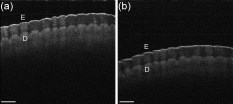 Video 1Human finger pad in vivo, consisting of 200 OCT images at the display rate of (QuickTime, 4 MB). . 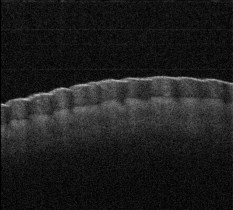 In conclusion, we demonstrate a real-time display on the linear- SD OCT system using GPU programming. We use the linear- spectrometer combined with a diffractive grating and a F2 equilateral prism at to avoid resampling of the axial data from wavelength to wave number. The calculation of the FFT is accelerated by the GPU. The computing time is for data of size lateral A-scans, and is shorter than the frame interval time of the interference frame. Our system can display processed OCT images in real time at . Since the GPUs are cost effective for real-time display of FD-OCT images, the potential applications for this technique are wide. AcknowledgmentsThis study was partially supported by Grant-in-Aid for Scientific Research (20700375) in the Japan Society for the Promotion of Science (JSPS) and Industrial Technology Research Grant Program in 2005 from New Energy and Industrial Technology Development Organization (NEDO) of Japan. ReferencesG. Häusler and M. W. Lindner,
“Coherence radar and spectral radar—new tools for dermatological diagnosis,”
J. Biomed. Opt., 3 21
–31
(1998). https://doi.org/10.1117/1.429899 1083-3668 Google Scholar
A. F. Fercher, C. K. Hitzenberger, G. Kamp, and S. Y. El-Zaiat,
“Measurement of intraocular distances by backscattering spectral interferometry,”
Opt. Commun., 117 43
–48
(1995). https://doi.org/10.1016/0030-4018(95)00119-S 0030-4018 Google Scholar
R. A. Leitgeb, C. K. Hitzenberger, and A. F. Fercher,
“Performance of Fourier domain vs. time domain optical coherence tomography,”
Opt. Express, 11 889
–894
(2003). 1094-4087 Google Scholar
T. E. Ustun, N. V. Iftimia, R. D. Ferguson, and D. X. Hammer,
“Real-time processing for Fourier domain optical coherence tomography using a field programmable gate array,”
Rev. Sci. Instrum., 79 114301
(2008). https://doi.org/10.1063/1.3005996 0034-6748 Google Scholar
Z. Hu and A. M. Rollins,
“Fourier domain optical coherence tomography with a linear-in-wavenumber spectrometer,”
Opt. Lett., 32 3525
–3527
(2007). https://doi.org/10.1364/OL.32.003525 0146-9592 Google Scholar
G. Y. Gelikonov, V. M. Gelikonov, and P. A. Shilyagin,
“Linear wave-number spectrometer for spectral domain optical coherence tomography,”
Proc. SPIE, 6847 68470N
(2008). https://doi.org/10.1117/12.763541 0277-786X Google Scholar
C. M. Eigenwillig, B. R. Biedermann, G. Palte, and R. Huber,
“K-space linear Fourier domain mode locked laser and applications for optical coherence tomography,”
Opt. Express, 16 8916
–8937
(2008). https://doi.org/10.1364/OE.16.008916 1094-4087 Google Scholar
C. Chong, A. Morosawa, and T. Sakai,
“High-speed wavelength-swept laser source with high-linearity sweep for optical coherence tomography,”
IEEE J. Sel. Top. Quantum Electron., 14 235
–242
(2008). https://doi.org/10.1109/JSTQE.2007.911766 1077-260X Google Scholar
N. Masuda, T. Ito, T. Tanaka, A. Shiraki, and T. Sugie,
“Computer generated holography using a graphics processing unit,”
Opt. Express, 14 587
–592
(2006). https://doi.org/10.1364/OPEX.14.000587 1094-4087 Google Scholar
T. Shimobaba, Y. Sato, J. Miura, M. Takenouchi, and T. Ito,
“Real-time digital holographic microscopy using the graphic processing unit,”
Opt. Express, 16 11776
–11781
(2008). https://doi.org/10.1364/OE.16.011776 1094-4087 Google Scholar
N. K. Govindaraju, B. Lloyd, Y. Dotsenko, B. Smith, and J. Manferdelli,
“High performance discrete Fourier transforms on graphics processors,”
1
–12
(2008). Google Scholar
|

