
|
|
1.IntroductionProstate cancer diagnosis is based on prostate specific antigen (PSA) dosage and digital rectal examination. If the test is positive, a biopsy is conducted and guided by ultrasound imaging. However, current ultrasound imaging techniques are unable to detect tumors of small and medium size, and biopsies are performed in the prostate by following a systematic sampling pattern. This pattern covers the areas having the highest rates of cancer occurrence but some tumors may nonetheless remain undetected. Consequently, the only way to improve detection is to increase the number of biopsies. But this number cannot be increased because it may lead to major complications (6.6% of patients) such as acute prostatitis (3.8%), acute urinary retention (2.1%), hematuria (1.9%), rectal bleeding (0.2%), epididymitis (0.2%), sepsis (0.05%), and vasovagal syncope (0.05%).1 Finding a way to guide biopsies to tumors may decrease the rate of false negative cases and improve patient well-being. Bimodal optical and ultrasound methods have already been proposed to solve this problem. The combined use of these complementary methods seems promising: ultrasound provides morphological information and optical detection may guide the biopsy needle to the tumor. As ultrasound probes are used in routine examinations, the addition of optics would not involve a drastic change in the clinical protocol, but would facilitate the penetration of this technology. Moreover, optical detection can be easily integrated in an ultrasound probe through the use of optical fibers. Last, the morphological information provided by ultrasound could be used to improve optical location of tumors, as shown in a simulation performed by Xu 2 To discriminate between cancerous and healthy tissues, some authors used the fact that tumors are more vascularized than the surrounding tissues to measure attenuation of the near-infrared (NIR) light.3 Optical characteristics (absorption and diffusion) of healthy and cancerous prostates were clinically measured.4 In order to design an optimized optical probe, simulations were conducted to evaluate the best distribution of optical fibers.5 A bimodal endorectal probe combining ultrasound and optical measurements, based on NIR absorption by intrinsic or endogenous chromophores, was proposed and successfully tested in preclinical trials on canine prostates with venereal tumors.6 Nevertheless, all of these methods are based on the intrinsic or endogenous contrast between tumoral and healthy tissues. Actually, to detect cancer cells at an early stage, a stronger contrast between cancerous and healthy cells is required. Agarwal 7 proposed enhancing the contrast by means of optoacoustic measurements on specifically functionalized gold nanoparticles which also act as thermotherapy agents. Using fluorescence for in vivo prostate cancer diagnosis seems to be another promising way to improve the specificity of detection. However, the time involved in developing these methods was lengthened by the absence of specific fluorescent markers. In 2008, Pu 8 showed the efficacy of Cytate, a fluorescence marker derivative of Indocyanine Green (ICG), which conjugates to receptors on prostate cancer cells. Although fluorescence has a huge potential to improve the specificity of detection, it has to contend with weaker signals than in NIR absorption measurements. This drawback implies the need for a high-power laser source and time-resolved detectors to locate the origins of fluorescence emissions more accurately. Fluorescence diffuse optical tomography (FDOT) techniques were successfully applied to the detection of tumors in small animals,9 enabling imaging through a greater thickness of breast tissue . The small-animal approach of FDOT was even applied to human breast cancer10 thanks to the weak light absorption coefficient of breasts , which compensates for the greater thickness . Applying these techniques to prostate cancer diagnosis is a real challenge given that the absorption coefficient of prostatic tissues is very high ( ; Ref. 4), with a diffusion coefficient equivalent to lungs of small animals . Moreover, the geometry of an endorectal cavity is very confined, thus limiting us to reflection measurements that generate a high level of background signal noise (autofluorescence). This article describes the first transrectal probe based on time-resolved FDOT. This probe was used to take measurements on fluorescent inclusions of various concentrations and located at fixed depths inside the prostate phantom. A reconstruction algorithm based on time-of-flight analysis was used to locate these inclusions accurately. Linearity experiments were also performed. Last, the system resolution was evaluated through simulation and the results discussed. 2.Materials and Methods2.1.Description of the Optical and Ultrasound SystemThe schematic diagram of the optical system is illustrated in Fig. 1 . It consists mainly of a pulsed titanium-sapphire laser, a transrectal optical probe, and a high rate imager (HRI). The laser (Spectra-Physics) was tuned to produce pulses at and frequency. The average laser power provides enough energy to penetrate deeply inside the phantom and to excite the inclusion. Its wavelength was chosen to fit the absorption peak of the fluorescing inclusion. The laser is filtered through a bandpass filter (Thorlabs FB770). The excitation fiber selection is performed by a magnifying lens (Zeiss NA: 0.2) mounted on a displacement plate and moved in front of the desired fiber. The excitation fiber bundle is composed of six standard -diam silica fibers. Fig. 1(a) Diagram of the time-resolved optical system. For simplicity’s sake, only three out of six excitation fibers and two out of four-detection fibers are represented. (b) Photo of the optical transrectal probe gently pressed against the prostate phantom. The fluorescing inclusion is located below the surface of the phantom.  Figure 2 shows the drawings of the optical probe. Its dimensions are . The axial ultrasound imaging transducer is located at the outer end of the probe. Both excitation and emission fibers are housed between the plastic shell of the probe and the transducer electronics. The optical head consists of 10 channels of fibers, 6 for excitation and 4 for fluorescence detection. The minimum source–detector separation distance of ensures a good compromise between fluorescence intensity collection and background signal reduction. The emission fiber bundle is composed of four plastic high-aperture fibers (inner , , ) to optimize fluorescence collection. The signals from the four detection fibers are collected by a macrolens (Zeiss ). To handle the high level of excitation of the signal collected by the detection fiber, both Notch and Razoredge filters were used (NF01-785U-25 and LP02-785RS-25 Semrock) Fig. 2Diagram of the transrectal probe. (a) Front view of the bimodal optical head, with source and detector indexes. (b) Side view of the transrectal probe showing optical fiber angles. (c) Perspective view of the probe with handle (1).  The fluorescence is detected by an intensified high-rate imager (Kentech). Inside the HRI, the photons are changed into electrons by a photocathode and amplified by a multichannel plate (MCP). The photons generated by the phosphorous screen are focused and acquired by a cooled CCD camera (Hamamatsu Orca-ER). An electronic gating system drives the high voltage of the MCP for time intervals of . The time-dependent distribution of the fluorescence signal was measured by the use of a programmable delay system (Kentech). To illustrate the feasibility of bimodal detection, auxiliary values were collected by combining time-resolved fluorescence and ultrasonic measurements. These experiments were not carried out with the transrectal probe but with a commercial system-[Ultrasonic 500RP by Ultrasonix Medical Corporation; Fig. 3d ], which gives a planar view of the prostate phantom and can be displaced above the phantom in a more convenient way than a transrectal probe. The ultrasound system is mounted on a displacement table and acquires one planar image every , in order to obtain a 3-D image of the prostate phantom. The ultrasound probe is positioned above the phantom, and several -spaced transverse scans are acquired. The acoustic probe has a central frequency. The acoustic beam is focused near the central part of the phantom. Optical measurements were taken with the same laser and detection system but without excitation and detection fiber networks and in planar geometry. This work was previously described in Ref. 11. After this bimodal acquisition, the optical and ultrasonic slices are superimposed by means of standard image processing software. Fig. 3(a) Ultrasonic image of a healthy prostate. This image shows the three different kinds of tissues simulated by the phantom: rectum wall, central zone, and surrounding tissues. (b) Diagram of the prostate phantom [rectum wall (R), central zone (P), and surrounding tissues (S)]. (c) Photo of a previous version of the prostate phantom with the fluorescent inclusion (fluorescent glass) inserted below the surface. (d) Photo of the prostate phantom placed inside the vat and being scanned by the Ultrasonic 500RP system. 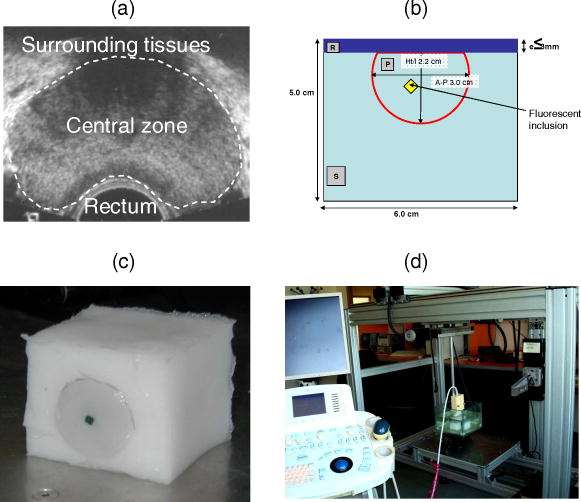 2.2.Acquisition ParametersIn this feasibility study, the excitation light source is injected successively into the six excitation fibers. For each position of the laser, 68 images of the detection fibers are acquired with a time delay varying between 6 and (in steps). The MCP voltage is , and the exposure time of the camera . The overall acquisition time was . After scanning, the stack of images is stored on the hard disk with all the scanning parameters (source index, exposure time of each image, time delay). This stack is then used by the reconstruction algorithm to locate the fluorescent inclusion. 2.3.Inclusion Locating MethodThe reconstruction principle is based on the model of the diffusion equation. For each excitation fiber , the time-dependent distribution of the fluorescence intensity detected by the fiber , in the presence of the inclusion and the background signal without the inclusion, are measured. The fluorescence signal emitted by the inclusion and the first and second moments of this signal are calculated: where is the total fluorescence intensity, and the time of flight of the photons.In reflection geometry, the mean intensity alone enables an accurate assessment of the transversal location of the fluorescent inclusion to be made but a poor depth value despite the tomographic acquisition. This is due to the fact that for a transrectal probe, the small distance between source and detectors leads to a reduced angle of view of the inclusion, which does not allow high-resolution -axis determinations. To improve the determination of inclusion location in the axis, the mean time of flight is used. Consider an infinite homogeneous medium. In such a case, the mean time of flight is simply related to the travel distance by , where is a mean speed of light inside the tissues, and is given by: where is the speed of light in vacuum, is the absorption coefficient, is the diffusion, and is the reduced scattering coefficient. Considering the properties of the prostate phantom ( and , ; Ref. 4), the mean speed of light inside the tissue is about . Given that the time step of the detection chain is (one fraction of the detection time gate), the time of flight of the photons can be used to determine the depth of the inclusion with an uncertainty of , which is sufficiently accurate for our application. Here, the forward model was computed using analytical formulas in an infinite medium.2.4.Accuracy of the Mean Time of FlightConsider a temporal response acquired for a particular source–detector couple. This signal consists of photon counts in temporal channels centred around the times . From this signal, the total number of counts, , the mean time of flight , and the response width are extracted. As the values are corrupted by noise , differs from its expected value by . As the values are uncorrelated random variables and assuming that follows a Poisson distribution, the variance of is . Therefore, the accuracy of the measurement can be as high as desired, provided the number of counts is high enough. For example, considering typical figures of a fluorescence half-life of , a detection response of , and a time transit widening of , the response width will be . Therefore, the time of flight measurement is accurate to within with a 3600-count measurement, which is easily achievable. 2.5.Prostate Mimicking PhantomTo validate this system, a tissue-mimicking phantom representative of the prostate tissues both on its optical (absorption and diffusion ) and ultrasound properties was developed. This phantom represents the three different kinds of tissues comprising the prostate area: central zone, peripheral zone, and rectal tissue. This phantom is based on polyvinyl alcohol (PVA), silica, titanium dioxide, and ink. The dosage of the components was fine-tuned to fit the average prostate absorption and diffusion coefficient given by Svensson 4 ( , ). Silica powder was previously used in several studies12, 13 for adjusting acoustic scattering properties of tissue mimicking phantoms. A cylinder was drilled and then filled with a capillary tube containing various concentrations of a fluorescent emulsion. This emulsion is based on Indocyanine Green (ICG) encapsulated in lipid nanodroplets. Its fluorescence yield (8.6%) is twice that of unmodified ICG (4.2%) and also has in vivo stealth properties.14 The capillary tube was positioned inside the phantom, at a depth of under its surface [Figs. 3b and 3c]. 3.ResultsFigure 4 shows the reconstructed fluorescent yield of a capillary tube obtained with the transrectal probe (six excitation and four detection fibers). Its position was correctly recovered. Fig. 4(a) Reconstruction results are represented by a series of slices in the plane, each image representing a slice at a given height inside the phantom. (b) 3-D view of the previous reconstruction. Source (red dots) and detection (blue dots) fibers are also plotted. The reconstruction fluorescent inclusion was found at . The difference between the real and reconstructed position of the inclusion can be explained by the phantom surface deformation due to the probe. (Color online only.)  Location sensitivity of the system was determined by simulations. The time-dependent fluorescence signal due to an inclusion located at a depth of was simulated by using an analytical propagation model and an exponential decay for the fluorophore. The background signal was taken to be leakage from the excitation signal. The magnitude of this leak was chosen so that it fitted the experimental data. These two signals were convolved with a Gaussian impulse response function (IRF) of FWHM. Photonic noise was added to the signal. The noise amplitude was chosen so that it had the same level as the noise of the experimental data. For each source position and each detector fiber, it corresponds to about 10,000 photons per acquisition (integral of the time-dependent distribution of the signal). Table 1 shows the impact of the photonic noise on the theoretical accuracy of the location of the inclusion. The standard deviation values obtained show a theoretical submillimetric resolution of the system. However, in clinical conditions, prostate tissue heterogeneities, fiber-tissue coupling efficiency, and rectum wall surface conditions may impair the accuracy of reconstruction. Table 1Impact of the photonic noise on the theoretical accuracy of the x,y,z location of the inclusion.
This good theoretical resolution can be explained by the high dependence of time of flight on inclusion depth in reflection geometry. For instance, a depth difference of will lead to a time of flight of , which is compatible with the steps measured with the experimental acquisition chain. As a comparison, intensity measurements (such as those obtained by a continuous wave acquisition system) in a similar geometry would not be capable of achieving a resolution better than , which is not sufficient for efficient biopsy driving. It can therefore be concluded that time-resolved measurements are required to lower the rate of false negative biopsies, which is an important quality factor for prostate cancer diagnostic. Probe linearity was tested through several acquisitions and reconstructions of capillary tubes containing various encapsulated ICG concentrations . The system was able to detect and accurately locate all these inclusions. Table 2 shows the average location and intensity of the reconstructed fluorescence intensity. Table 2Average location and intensity of the reconstructed fluorescence intensity.
The reconstructed fluorescence intensity was found to be closely correlated to the capillary tube concentration, as shown in Fig. 5 . This correlation factor reaches when the position is fixed at , which shows the influence of the reconstructed depth location on the recovered fluorescence intensity. Fig. 5Reconstructed fluorescence intensity as a function of the capillary tube concentration with a depth fixed at .  Figure 6 shows the time-dependent distribution of fluorescence and background signal from the different source–detector indexes (for a capillary tube). The ratio between signal and background noise before reconstruction depends on the relative position of the excitation and emission fiber considered. The fluorescence signal decreases exponentially with the source–inclusion–detection distance, whereas the background signal depends only on the distance between source and detector. This explains why the best configuration was obtained for the source 5 and detector 3 [numbering is defined on Fig. 2a] with a signal to background ratio of 93. The least informative channel was the source 3 and detector 2 with a signal to background ratio of 0.2. Fig. 6Time-dependent distribution of fluorescence (blue) and background (red) signal from the different source detector pairs (for a capillary tube). Source and detector indexes are shown on Fig. 2a. (Color online only.) 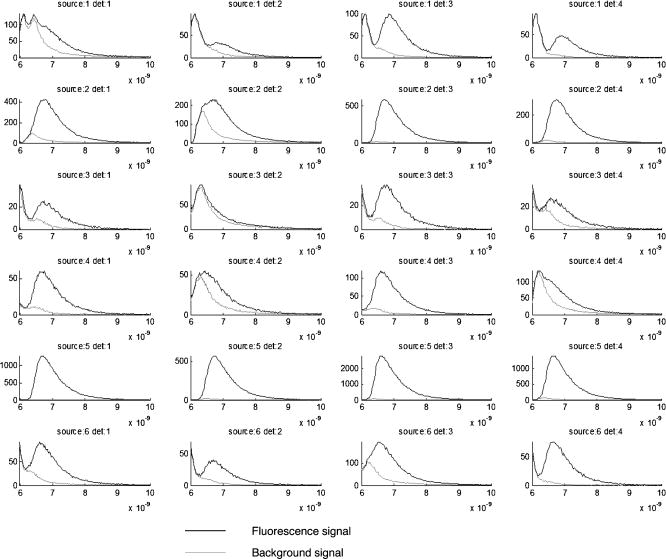 Experiments indicated that the current acquisition chain is able to detect the inclusion of down to a depth of . To improve this detection limit and to decrease the overall acquisition time, it is planned to replace the current acquisition chain based on the HRI by four photomultiplier tubes connected to a 4-channel time-correlated single-photon counting (TCSPC) chain. The reconstructed fluorescence map and the ultrasound image obtained with the bimodal auxiliary acquisition system described in Ref. 11 superimposed accurately [Figs. 7a and 7b ], and this gives confidence in our ability to improve the sensitivity of endorectal prostate cancer diagnoses. Fig. 7(a) This figure shows a central slice of the prostate phantom in the plane given by ultrasounds. This image shows the inclusion, which is more echogenous than the surrounding materials. The darker area under the inclusion corresponds to the shadow cone left by the inclusion. (b) Superimposition of the fluorescence map (in green) obtained after reconstruction on the ultrasound slice (gray scale). The high spatial heterogeneity between water and the phantom creates acoustic noise through multiple scattering known as pulse reverberations. The reverberations produce a tail added to the propagating pulse, and this tail is observed as additional noise at the top of the images. (Color online only.)  4.ConclusionAn integrated endorectal optical probe based on time-resolved FDOT was developed. It was designed to remain compatible with ultrasound measurements. Thanks to reconstruction based on an analysis of the time-dependent distribution of the fluorescence photons, it was possible to locate an inclusion at fixed depths inside a prostate-mimicking phantom. A capillary tube was reconstructed at a depth of . The reconstructed fluorescence intensity was found to be closely correlated to the capillary tube concentration. One of the aims of future research will be to obtain better understanding of the origin of the background signal. It will also be necessary to address the problem of reconstructing multiple tumors and the possible presence of heterogeneities in the prostate tissues. AcknowledgmentsThis work has been partly funded by the CARNOT Institute and the French Agence Nationale pour la Recherche (ANR). Dimensional information and ultrasonic images of prostate and endorectal probes were provided by Professor Nicolas Grenier of the Centre Hospitalier Universitaire de Bordeaux and by An Nguyen-Dinh (VERMON). ReferencesI. N. Chiang, S. J. Chang, Y. S. Pu, K. H. Huang, H. J. Yu, and C. Y. Huang,
“Major complications and associated risk factors of trans-rectal ultrasound guided prostate needle biopsy: a retrospective study of 1875 cases in Taiwan,”
J. Formos Med. Assoc., 106
(11), 929
–934
(2007). https://doi.org/10.1016/S0929-6646(08)60063-7 0929-6646 Google Scholar
G. Xu, D. Piao, C. Musgrove, C. Bunting, and H. Dehghani,
“Trans-rectal ultrasound-coupled near-infrared optical tomography of the prostate Part I: simulation,”
Opt. Express, 16 17484
–17504
(2008). https://doi.org/10.1364/OE.16.017484 1094-4087 Google Scholar
D. Piao, H. Xie, W. Zhang, J. S. Krasisnski, G. Zhang, H. Dehghani, B. W. Pogue,
“Endoscopic, rapid near-infrared optical tomography,”
Opt. Lett., 31
(19), 2876
–2878
(2006). https://doi.org/10.1364/OL.31.002876 0146-9592 Google Scholar
T. Svensson, S. Andersson-Engels, M. Einarsdóttír, and K. Svanberg,
“In vivo optical characterization of human prostate tissue using near-infrared time-resolved spectroscopy,”
J. Biomed. Opt., 12
(1), 014022
(2007). https://doi.org/10.1117/1.2435175 1083-3668 Google Scholar
M. E. Eames, D. Piao, and H. Dehghani,
“Source and detector fiber optimization for depth sensitivity in endoscopic near infrared tomography,”
BSuE30
(2008). Google Scholar
Z. Jiang, D. Piao, G. Xu, J. Ritchey, G. Holyoak, K. Bartels, C. Bunting, G. Slobodov, and J. Krasinski,
“Trans-rectal ultrasound-coupled near-infrared optical tomography of the prostate Part II: experimental demonstration,”
Opt. Express, 16 17505
–17520
(2008). https://doi.org/10.1364/OE.16.017505 1094-4087 Google Scholar
A. Agarwal, S. W. Huang, M. O’Donnell, K. C. Day, M. Day, N. Kotov, and S. Ashkenazi,
“Targeted gold nano-rod contrast agent for prostate cancer detection by photoacoustic imaging,”
J. Appl. Phys., 102 064701
(2007). https://doi.org/10.1063/1.2777127 0021-8979 Google Scholar
Y. Pu, W. B. Wang, B. B. Das, S. Achilefu, and R. R. Alfano,
“Time-resolved fluorescence polarization dynamics and optical imaging of Cytate: a prostate cancer receptor-targeted contrast agent,”
Appl. Opt., 47
(13), 2281
–2289
(2008). https://doi.org/10.1364/AO.47.002281 0003-6935 Google Scholar
A. Koenig, L. Hervé, V. Josserand, M. Berger, J. Boutet, A. Da Silva, J.-M. Dinten, P. Peltié, J.-L. Coll, and P. Rizo,
“In vivo mice lung tumor follow-up with fluorescence diffuse optical tomography,”
J. Biomed. Opt., 13
(1), 011008
(2008). https://doi.org/10.1117/1.2884505 1083-3668 Google Scholar
A. Corlu, R. Choe, T. Durduran, M. A. Rosen, M. Schweiger, S. R. Arridge, M. D. Schnall, and A. G. Yodh,
“Three-dimensional in vivo fluorescence diffuse optical tomography of breast cancer in humans,”
Opt. Express, 15
(11), 6696
–6716
(2007). https://doi.org/10.1364/OE.15.006696 1094-4087 Google Scholar
J. Boutet, M. Debourdeau, L. Herve, L. Guyon, J. M. Dinten, and P. Rizo,
“Advances in bi-modal optical and ultrasound detection of prostate cancer,”
Proc. SPIE, 7171 71710E
(2009). https://doi.org/10.1117/12.807703 0277-786X Google Scholar
C. L. de Korte, G. Pasterkamp, A. F. van Der Steen, H. A. Woutman, and N. Bom,
“Characterization of plaque components with intravascular ultrasound elastography in human femoral and coronary arteries in vitro,”
Circulation, 102
(6), 617
–623
(2000). 0009-7322 Google Scholar
L. K. Ryan and F. S. Foster,
“Tissue equivalent vessel phantoms for intravascular ultrasound,”
Ultrasound Med. Biol., 23
(2), 261
–273
(1997). https://doi.org/10.1016/S0301-5629(96)00206-2 0301-5629 Google Scholar
F. Navarro, M. Berger, M. Goutayer, S. Guillermet, V. Josserand, and I. T. Nogues,
“A novel indocyanine green nanoparticle probe for noninvasive fluorescence imaging in vivo,”
Proc. SPIE, 7190 71900L
(2009). https://doi.org/10.1117/12.808195 0277-786X Google Scholar
|


