|
|
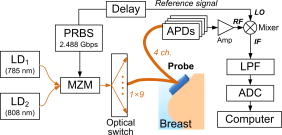
1.IntroductionNear-infrared (NIR) diffuse optical spectroscopy (DOS) have been proven in the last decades as a viable noninvasive optical instrument for human breast tissue examination.1, 2, 3, 4 In comparison to conventional breast cancer diagnostic modalities such as x-ray mammography,5 breast magnetic resonance imaging (MRI),6 and breast ultrasonography,7, 8 DOS differentiates normal and diseased breast tissues by quantifying the temporal or spatial changes of tissue intrinsic properties.9 This unique feature makes DOS a useful supplementary tool to the conventional diagnosis modalities. Other system merits, such as noninvasiveness, nonionization hazard, and noncompression of breast are also favorable for routine clinical breast examination.4, 10 Women with high breast cancer risk or dense breast tissue who may not suitable for conventional diagnostic modalities can benefit from DOS in breast tissue abnormalities examination.3, 11 One promising DOS instrument currently under development is the time-resolved DOS, which has shown advantages on high temporal resolution, high temporal linearity, and full-spectrum information.12 Complete spectroscopy characterization can be achieved by analyzing the time-resolved photon migration data, known as the temporal point spread functions (TPSF).13 For system implementation, spread spectrum correlation technique is an attractive approach because it offers faster data acquisition speed as well as lightweight system structure compared to the classic time-resolved techniques, which normally involve ultrashort pulse laser and time-correlated photon count (TCSPC) devices.13, 14, 15 Breast cancer is the most common cancer among Singapore women. Early detection of breast cancer is crucial to reduce mortality rates. This research aims to explore the applicability of time-resolved spectroscopy for breast tissue characterization. In this article, we report the quantitative measurements of breast optical properties and physiological parameters from 19 healthy Singapore women. To the best of our knowledge, this is the first characterization of human breasts in vivo in this demographic population. The time-resolved DOS instrument is developed using the pseudorandom bit sequence (PRBS) correlation technique, which can acquire TPSF signals in a fast speed. Two types of information are obtained from the time-resolved measurements. The first type is optical properties, specifically the absorption coefficient and the reduced scattering coefficient . The second type is physiological parameters, specifically, the concentrations of oxyhemoglobin (HbO) and deoxyhemoglobin (Hb), the total hemoglobin concentration , and the oxygenation saturation . This study examines the parameter characterization in association with the menopausal states and ages. We found that the value of breast optical properties (especially the ) and physiological parameters ( and ) varied significantly between premenopausal and postmenopausal women. Meanwhile, we observed a conspicuous contrast in optical and physiological parameters between young (below old) and older women (above old). Quantitative analysis showed a high correlation between these optical/physiological parameters and the age, body mass index (BMI), and menopausal states of women. 2.Materials and Methods2.1.InstrumentIn our previous studies, we reported a viable time-domain diffuse optical tomography (DOT) system using PRBS correlation technique.16 To obtain time-resolved DOS functionality, the DOT system was reconfigured and optimized. Figure 1 shows the schematic of the time-resolved DOS instrument. Briefly, two NIR laser beams at and alternatively went through a Mach-Zehnder modulator (MZM), in which their intensities were modulated by a train of PRBS signal. An optical switch multiplexed the modulated light into nine source fibers. A handheld probe, which mounted all of these source fibers along with an additional four detection fiber bundles, was placed on the breast surface for probing. The optical power of and at the tips of the source fibers were approximately . The source fibers sequentially delivered the excited light into the tissue and the optical reflectance from the breast was fiber-coupled to four avalanche photodiodes (APDs) through four fiber bundles. The optoelectronic conversion signals were amplified and eventually correlated with the reference PRBS signals at the mixer. The TPSF signals were extracted from the down-conversion and acquired by computer via analog-to-digital converters (ADCs). Figure 2 shows the handheld probe, which mounts nine source fibers and four fiber bundles in a centrosymmetric pattern. The source-to-detector separations range from . In order to acquire system impulse response functions (IRFs) for each source–detector pair, a diffuse white paper was placed at in front of the probe. The optical reflectance acquired by each source–detector pair was regarded as the IRFs. To figure out the fiber-coupling coefficients between fiber bundles and the corresponding APDs, phantom-based experiments were conducted to calibrate the system. The procedures for system IRF acquisition, system calibration and data accuracy assessments of TPSF have been described in detail in the previous studies.16, 17 2.2.Models and AssumptionsFor in vivo breast tissue probing, the diffusion equation is valid for modeling photon migration behaviors in the breast tissues.18, 19 Using Green’s function as the analytical solution to the diffusion equation, we need to consider the boundary conditions.20 In this study, the probe works in a reflective mode. Hence the semi-infinite boundary condition should be taken into account. The time-resolved TPSF measurements from the breast can be approximated using the difference between the Green’s functions respectively induced by an interpolated real light source and an extrapolated image light source.18, 19, 20 To calculate the optical properties ( and ) from the TPSF measurements, the fitting procedure starts with a reasonable initial estimate for wavelength and (Ref. 4). The TPSF prediction was computed from these given estimates. Meanwhile, the TPSF measurements were acquired from the breast tissue. A merit function, defined by , is iteratively computed until it meets the convergence criteria , where is a predefined convergence threshold, and is the iteration number. The initial estimate was iteratively updated in a step of , where is a step size, and is the difference between two consecutive iterations. The optical properties of human breast tissues are governed by its constituents such as lipid, water, as well as the significant chromophores, HbO and Hb. In this study, we assumed the wavelength-dependent absorption coefficients of the bulky breast tissue were solely contributed by these four types of chromophores: water, lipid, HbO, and Hb. Then, we have where and are absorption coefficients of overall breast tissue at wavelength and , respectively. , , and are molar extinction coefficients of Hb and HbO at and . and are molar extinction coefficients of water at and . and are molar extinction coefficients of lipid at and . Their values can be found in the literature.21 and stand for the unknown concentrations of Hb and HbO, respectively. and stand for the concentrations of water and lipid, respectively. In this study, we assumed and maintained typical values for the relative concentration of lipid (56%) and the water concentrations of postmenopausal (11%) and premenopausal women (26%).4, 11 Given the time-resolved TPSF measurements at and , values of and can be resolved by curve-fitting processing. The physiological parameters and can be resolved simultaneously by inverting Eq. 1. Value of total hemoglobin concentration can be obtained by11, 22 and value of blood oxygenation saturation can be obtained byParameter has a unit of micromole per liter . It can be interpreted as the blood volume in the breast tissue, from which one can assess the tissue’s blood supply. Parameter can be interpreted as the degree of oxygen consumption by the breast tissue. Cancerous tissue normally requires much more blood and oxygen supply, which significantly alters the positional optical properties and the physiological parameters of breast tissue. Thus, positional inhomogeneities of , , , and may indicate the presence of breast tissue abnormities. 2.3.Measurement ProtocolThe in vivo breast tissue measurements using the time-resolved DOS instrument have been approved by the Institute Review Board of National University of Singapore. Consent from all volunteer subjects was obtained. Subjects were measured in a sitting posture without any compressions on the breast. The handheld probe was placed on the left and right breasts, respectively, and the positions on each breast are at 3, 6, 9, and 12 o’clock, as shown in Fig. 3 . For each wavelength at each position, 36 TPSF measurements were acquired by scanning nine source fibers and four detectors. Each scan took approximately . In this period, the volunteer was asked to hold her breath. To minimize measurement error caused by heart beating effects of subjects, scanning at each position was repeated 5 times. Thus for each subject, the time-resolved measurements contained TPSFs, which can be obtained in . 2.4.SubjectsA total number of 19 Singapore women were recruited for this spectroscopy research. All subjects were healthy without known breast diseases. They were divided into groups according to their menopausal states and age because both aging and menopause states are strongly associated with the replacement of glandular tissue with fatty tissue. The ages of 3 postmenopausal (Post) women were 44, 48, and . The ages of the remaining 16 premenopausal (Pre) women ranged from five women were younger than , and the remaining 14 women were older than . The youngest and oldest women subjects were 23 and old, respectively. Table 1 summarizes the statistics of women subjects by ages and menopausal states. The averaged (Mean) age of all subjects was , and the standard deviation (SD) was . Table 1Statistics of 19 volunteer women subjects.
3.Results and DiscussionsThe TPSFs obtained from source-to-detector separation of were selected to calculate the optical properties ( and ), because this separation allows the incident photons to reach as deep as centimeters into the breast tissue.11 The calculation of , , , and were conducted in MATLAB. For each subject, the optical and physiological results at 8 probing positions were averaged to minimize the interposition variations. Results were expressed by (mean deviations). The mean values of , , , and were regarded as the representative parameters of the entire breast, and the standard deviations were regarded as the interposition variations. Table 2 summarizes the optical properties and physiological parameters of 19 subjects. The mean of 19 subjects was found to be , with a standard deviation of when a laser wavelength of was used while that was at . The reduced scattering coefficient showed similarly close results between two different laser wavelengths, with showing and showing . The blood oxygenation saturation of 19 subjects was found to be , while the total hemoglobin concentration was . Table 2Optical properties and physiological parameters of 19 healthy subjects.
In order to investigate the relationship between menopausal states and the optical/physiological parameter, 3 postmenopausal (Post) women and the 16 premenopausal (Pre) women were examined sequentially. Figure 4 shows a scatter plot of versus of 16 premenopausal women (solid blue circles for and open blue circles for ) and 3 postmenopausal women (solid red squares for and open red squares for ) at two wavelengths. The 2-D error bars show the standard deviations of two optical parameters. It was found that and of postmenopausal women are generally smaller than that of premenopausal women, which agreed with the observations in the literature.22 Statistical results in Table 3 show that the averaged of premenopausal women was at —approximately 60% larger than that of premenopausal women at . At , shows a similar trend of being larger in premenopausal women at —and approximately 61% higher than that of postmenopausal women, which was found to be . The difference of between and is not significant. At , the of premenopausal women was found to be on average, which was approximately 12% larger than that of postmenopausal women at . At , the contrast is similar. The of premenopausal women is about 12% larger than that of postmenopausal women. Fig. 4vs for 19 subjects at two wavelengths. Solid and open red squares represent the results of postmenopausal women subjects at 785 and , respectively. Solid and open blue circles represent the results of premenopausal women subjects at and , respectively. 2-D error bars represent the standard deviation among eight probing positions of each subject. (Color online only.)  Table 3Statistics of optical properties and physiological parameters of postmenopausal women and premenopausal women.
Figure 5 shows a scatter plot of versus , which was derived from according to Eq. 2 and Eq. 3. It is also clear that the of premenopausal women, in general, is higher than that of postmenopausal women. Table 3 shows that the of premenopausal women is , which is approximately 69% larger than that of postmenopausal women, which is . The difference between the postmenopausal women and premenopausal women is not significant. Fig. 5vs for all 19 subjects. Red squares represent the results of postmenopausal women subjects. Blue circles represent the results of premenopausal women subjects. 2-D error bars represent standard deviation among eight probing positions of each subject. (Color online only.)  The age of all 19 subjects in this study was old. To analyze the relationship between age and optical/physiological alterations, subjects are divided into two groups by age over or below 40 (see Table 1). The young women group has 5 women subjects, with ages of old. The older women group has 14 women subjects, with ages of old. Table 4 summarizes the averaged optical properties and physiological parameters in terms of age. Significant contrast between two groups can be found in absorption coefficient and total hemoglobin concentration . The of the young women group at was found to be , which is approximately 38% larger than the older women group, in which the averaged was found to be . At , the of the young women group is , which is approximately 36% larger than that of the older women group at . The higher values associated with the young women group may be explained by the greater content of fibroglandular tissue in the mammographically dense breasts. Similar difference can also be found in the physiological parameter . The young women group shows at , while the older women group shows at . The former is approximately 42% larger than the latter. The difference of reduced scattering coefficients between the two groups is not significant. The young women group shows an average of at and at . Both are approximately 11% larger than that of the older women group. The parameter of between the young women group and older women group is versus . Values are almost same. Figure 6 shows a scatter plot of among young and older women groups. Figure 7 shows a scatter plot of among young and older women. For easy comparison, data of the young women group are shown in red squares, and data of the older women group are plotted as blue circles. The error bar shows the standard deviation on corresponding parameters. Fig. 6Scatter plot of vs ages among all 19 subjects. Red squares represent data of young women, while blue circles represent data of older women groups. Error bars represent the standard deviation of . (Color online only.)  Fig. 7Scatter plot of parameter vs ages among all 19 subjects. Red squares represent data of young women, while blue circles represent data of older women groups. Error bars represent the standard deviation of . (Color online only.)  Table 4Mean and standard deviation (SD) of optical properties and physiological parameters of 19 subjects. The parameters are compared by age above 40 and below 40years old.
In order to examine the correlation between the optical and physiological parameters and women’s age, menopausal states, and BMI, correlation analysis using Pearson’s correlation coefficients and the Student’s -test was conducted. The results in Table 5 show that there is a high and significant correlation between the optical properties of and and women’s age, BMI, and menopausal states in a sequence from high to low. The physiological parameter also shows close relationship with women’s age, BMI, and menopausal state as well. The correlation between age, BMI, and menopausal states and the parameter is low and not significant. Table 5Pearson’s correlation coefficient between optical and physiological parameters and subject characteristics. The in vivo optical spectroscopy on bulk breast tissues has been investigated worldwide. However, there are subtle differences between results reported from each research group. The differences can be ascribed to the constitutional difference of women subjects (ages, menopausal states, races, and so on), different methodologies and apparatus, and different laser wavelengths used. Table 6 compiles some recent research results on healthy breast tissue using different spectroscopy techniques.23 All data are rounded properly for comparison. For example, for examinations on Caucasian women, Durduran 4 reported the of and of at from in vivo experiments on 52 healthy women. Results reported by Pogue 24 showed a slight difference. The averaged and were and , respectively. Besides the difference in optical parameters, the physiological parameter results between each group are also slightly different. The average value of ranges from 61% to 77% and the ranges from . For the study on Asian women, few reports have been published so far. Suzuki25 reported that the average from 30 Japanese women was and the average was . In our study, only Southeast Asian women were examined, and the mean values of the optical properties and physiological parameters, as shown in Table 6, showed a good agreement with the data of Caucasian women as well as other regional Asian women. Table 6Comparison of optical/physiological parameters from this study and recent literatures. N refers to the number of subjects involved in different studies, while μs′ and μa are rounded properly for consistency. 4.ConclusionsIn conclusion, we investigated the range of the optical properties and physiological parameters of breast tissues from 19 healthy Singapore women for the first time. The experiments results show a high correlation between the optical properties ( and ), physiological parameters , and the ages, menopausal states, and BMI of women. The results can serve as a benchmark for diseased breast tissue study in near future. AcknowledgmentsThis work was supported by Office of Life Science (R397-000-615-712), National University of Singapore, and research funding support from (P-052 101 0098), Singapore. ReferencesB. Chance, S. Nioka, J. Kent, K. McCully, M. Fountain, R. Greenfeld, and G. Holtom,
“Time-resolved spectroscopy of hemoglobin and myoglobin in resting and ischemic muscle,”
Anal. Biochem., 174
(2), 698
–707
(1988). https://doi.org/10.1016/0003-2697(88)90076-0 0003-2697 Google Scholar
B. J. Tromberg, N. Shah, R. Lanning, A. Cerussi, J. Espinoza, T. Pham, L. Svaasand, and J. Butler,
“Non-invasive in vivo characterization of breast tumors using photon migration spectroscopy,”
Neoplasia, 2 26
–40
(2000). https://doi.org/10.1038/sj.neo.7900082 1522-8002 Google Scholar
A. Cerussi, N. Shah, D. Hsiang, A. Durkin, J. Butler, and B. J. Tromberg,
“In vivo absorption, scattering, and physiologic properties of 58 malignant breast tumors determined by broadband diffuse optical spectroscopy,”
J. Biomed. Opt., 11
(4), 044005
–044016
(2006). https://doi.org/10.1117/1.2337546 1083-3668 Google Scholar
T. Durduran, R. Choe, J. Culver, L. Zubkov, M. Holboke, J. Giammarco, B. Chance, and A. Yodh,
“Bulk optical properties of healthy female breast tissue,”
Phys. Med. Biol., 47 2847
–2861
(2002). https://doi.org/10.1088/0031-9155/47/16/302 0031-9155 Google Scholar
S. J. Glick,
“Breast CT,”
Annu. Rev. Biomed. Eng., 9
(1), 501
–526
(2007). https://doi.org/10.1146/annurev.bioeng.9.060906.151924 1523-9829 Google Scholar
V. Ntziachristos, A. G. Yodh, M. D. Schnall, and B. Chance,
“MRI-guided diffuse optical spectroscopy of malignant and benign breast lesions,”
Neoplasia, 4
(4), 347
–354
(2002). https://doi.org/10.1038/sj.neo.7900244 1522-8002 Google Scholar
Q. Zhu, N. Chen, and S. H. Kurtzman,
“Imaging tumor angiogenesis by use of combined near-infrared diffusive light and ultrasound,”
Opt. Lett., 28
(5), 337
–339
(2003). https://doi.org/10.1364/OL.28.000337 0146-9592 Google Scholar
M. J. Holboke, B. J. Tromberg, X. Li, N. Shah, J. Fishkin, D. Kidney, J. Butler, B. Chance, and A. G. Yodh,
“Three-dimensional diffuse optical mammography with ultrasound localization in a human subject,”
J. Biomed. Opt., 5
(2), 237
–247
(2000). https://doi.org/10.1117/1.429992 1083-3668 Google Scholar
N. Ghosh, S. K. Mohanty, S. K. Majumder, and P. K. Gupta,
“Measurement of optical transport properties of normal and malignant human breast tissue,”
Appl. Opt., 40
(1), 176
–184
(2001). https://doi.org/10.1364/AO.40.000176 0003-6935 Google Scholar
L. C. Enfield, A. P. Gibson, N. L. Everdell, D. T. Delpy, M. Schweiger, S. R. Arridge, C. Richardson, M. Keshtgar, M. Douek, and J. C. Hebden,
“Three-dimensional time-resolved optical mammography of the uncompressed breast,”
Appl. Opt., 46
(17), 3628
–3638
(2007). https://doi.org/10.1364/AO.46.003628 0003-6935 Google Scholar
B. Tromberg, A. Cerussi, N. Shah, M. Compton, A. Durkin, D. Hsiang, J. Butler, and R. Mehta,
“Diffuse optics in breast cancer: detecting tumors in pre-menopausal women and monitoring neoadjuvant chemotherapy,”
Breast Cancer Res., 7
(6), 279
–285
(2005). https://doi.org/10.1186/bcr1358 Google Scholar
F. Gao, H. Zhao, and Y. Yamada,
“Improvement of image quality in diffuse optical tomography by use of full time-resolved data,”
Appl. Opt., 41
(4), 778
–791
(2002). https://doi.org/10.1364/AO.41.000778 0003-6935 Google Scholar
J. C. Hebden, S. R. Arridge, and A. P. Gibson,
“Recent advances in diffuse optical imaging,”
Phys. Med. Biol., 50 R1
–R43
(2005). https://doi.org/10.1088/0031-9155/50/11/E01 0031-9155 Google Scholar
F. E. W. Schmidt, M. E. Fry, E. M. C. Hillman, J. C. Hebden, and D. T. Delpy,
“A 32-channel time-resolved instrument for medical optical tomography,”
Rev. Sci. Instrum., 71
(1), 256
–265
(2000). https://doi.org/10.1063/1.1150191 0034-6748 Google Scholar
S. R. Arridge, J. C. Hebden, and T. D. David,
“Optical imaging in medicine: I. Experimental techniques,”
Phys. Med. Biol., 42 825
–840
(1997). https://doi.org/10.1088/0031-9155/42/5/007 0031-9155 Google Scholar
W. Mo and N. Chen,
“Fast time-domain diffuse optical tomography using pseudorandom bit sequences,”
Opt. Express, 16
(18), 13643
–13650
(2008). https://doi.org/10.1364/OE.16.013643 1094-4087 Google Scholar
W. Mo and N. Chen,
“Source stabilization for high quality time-domain diffuse optical tomography,”
Proc. SPIE, 7170 71700N
(2009). 0277-786X Google Scholar
R. C. Haskell, L. O. Svaasand, T. T. Tsay, T. C. Feng, M. S. McAdams, and B. J. Tromberg,
“Boundary conditions for the diffusion equation in radiative transfer,”
J. Opt. Soc. Am. A, 11
(10), 2727
–2741
(1994). https://doi.org/10.1364/JOSAA.11.002727 0740-3232 Google Scholar
M. S. Patterson, B. Chance, and B. C. Wilson,
“Time-resolved reflectance and transmittance for the noninvasive measurement of tissue optical properties,”
Appl. Opt., 28
(12), 2331
–2336
(1989). https://doi.org/10.1364/AO.28.002331 0003-6935 Google Scholar
N. G. Chen and J. Bai,
“Monte Carlo approach to modeling of boundary conditions for the diffusion equation,”
Phys. Rev. Lett., 80 5321
–5324
(1998). https://doi.org/10.1103/PhysRevLett.80.5321 0031-9007 Google Scholar
S. Prahl,
“Optical properties spectra,”
(2001) http://omlc.ogi.edu/spectra/hemoglobin/index.html Google Scholar
N. Shah, A. Cerussi, C. Eker, J. Espinoza, J. Butler, J. Fishkin, R. Hornung, and B. Tromberg,
“Noninvasive functional optical spectroscopy of human breast tissue,”
Proc. Natl. Acad. Sci. U.S.A., 98
(8), 4420
–4425
(2001). https://doi.org/10.1073/pnas.071511098 0027-8424 Google Scholar
D. R. Leff, O. J. Warren, L. C. Enfield, A. Gibson, T. Athanasiou, D. K. Patten, J. Hebden, G. Z. Yang, and A. Darzi,
“Diffuse optical imaging of the healthy and diseased breast: A systematic review,”
Breast Cancer Res. Treat., 108
(1), 9
–22
(2008). https://doi.org/10.1007/s10549-007-9582-z 0167-6806 Google Scholar
D. Grosenick, K. T. Moesta, H. Wabnitz, J. Mucke, C. Stroszczynski, R. Macdonald, P. M. Schlag, and H. Rinneberg,
“Time-domain optical mammography: initial clinical results on detection and characterization of breast tumors,”
Appl. Opt., 42
(16), 3170
–3186
(2003). https://doi.org/10.1364/AO.42.003170 0003-6935 Google Scholar
K. Suzuki, Y. Yamashita, K. Ohta, M. Kaneko, M. Yoshida, and B. Chance,
“Quantitative measurement of optical parameters in normal breasts using time-resolved spectroscopy: in vivo results of 30 Japanese women,”
J. Biomed. Opt., 1 330
–334
(1996). https://doi.org/10.1117/12.239902 1083-3668 Google Scholar
S. Tomas, J. Swartling, P. Taroni, A. Torricelli, P. Lindblom, C. Ingvar, and S. A. Engels,
“Characterization of normal breast tissue heterogeneity using time-resolved near-infrared spectroscopy,”
Phys. Med. Biol., 50 2559
–2571
(2005). https://doi.org/10.1088/0031-9155/50/11/008 0031-9155 Google Scholar
L. Spinelli, A. Torricelli, A. Pifferi, P. Taroni, G. M. Danesini, and R. Cubeddu,
“Bulk optical properties and tissue components in the female breast from multiwavelength time-resolved optical mammography,”
J. Biomed. Opt., 9 1137
–1142
(2004). https://doi.org/10.1117/1.1803546 1083-3668 Google Scholar
P. Taroni, G. Danesini, A. Torricelli, A. Pifferi, L. Spinelli, and R. Cubeddu,
“Clinical trial of time-resolved scanning optical mammography at 4 wavelengths between 683 and ,”
J. Biomed. Opt., 9
(3), 464
–473
(2004). https://doi.org/10.1117/1.1695561 1083-3668 Google Scholar
B. W. Pogue, S. Jiang, H. Dehghani, C. Kogel, S. Soho, S. Srinivasan, X. Song, T. D. Tosteson, S. P. Poplack, and K. D. Paulsen,
“Characterization of hemoglobin, water, and NIR scattering in breast tissue: analysis of intersubject variability and menstrual cycle changes,”
J. Biomed. Opt., 9
(3), 541
–552
(2004). https://doi.org/10.1117/1.1691028 1083-3668 Google Scholar
S. P. Poplack, K. D. Paulsen, A. Hartov, P. M. Meaney, B. W. Pogue, T. D. Tosteson, M. R. Grove, S. K. Soho, and W. A. Wells,
“Electromagnetic breast imaging: average tissue property values in women with negative clinical findings,”
Radiology, 231 571
–580
(2004). https://doi.org/10.1148/radiol.2312030606 0033-8419 Google Scholar
|
|||||||||||||||||||||||||||||||||||||||||||||||||||||||||||||||||||||||||||||||||||||||||||||||||||||||||||||||||||||||||||||||