
|
|
1.IntroductionTumor cells can be characterized by different states, reflecting the potential for rapid growth and metastasis. These properties are essential for a disease prognosis and a selection of treatment options. Usually, tumor cells from surgery specimens or biopsies are characterized by microscopy after cell staining. Recent developments also use molecular or physical cell properties. One group of such methods is the in vitro microscopic analysis of small amounts of living cells, isolated from tumor samples. Different criteria can then be used to distinguish between, for example, malignant and benign cancer cells. A recent addition to the spectrum of microscopic in vitro techniques is the characterization of cancer cells via their mechanical properties.1, 2, 3 This new direction in cancer research connects well to the emerging fields of mechanobiology and nanomechanical medicine. Especially the latter field capitalizes on the strong relation between the health state of the cell and properties like its elastic stiffness or its viscoelastic spectrum. Recent studies have indicated that besides cancer, also a variety of other diseases are linked to the changes of cell mechanical properties.4 An excellent example of a nanomechanical technique is atomic force microscopy (AFM). This technique was successfully used by Cross 5, 6 on populations of individual cells, to distinguish between healthy and malignant tissue from the lung, breast, and pancreas. Significant differences in elastic modulus were found also for (populations of) cells that were not distinguishable by morphology. Also Li 7 used AFM to distinguish between benign and malignant breast cancer cells. They reported a viscoelastic response with different magnitude for the two types. However, in spite of these proven capabilities, AFM remains a time-consuming and complex technique. The main experimental challenges are the alignment of the tip with respect to the cell,8 the softness of the cell,9 and the lack of control over local strain.10 In this paper, we will explore an alternative microscopic technique, which we will call intracellular particle tracking (IPT) for the sake of convenience. IPT is not generally known under this name, but it captures the study of either endogenous or ballistically injected particles (BIPs) inside living cells.11, 12, 13, 14, 15, 16, 17, 18 The use of BIPs was introduced by the Wirtz group and is known as ballistic intracellular nanorheology (BIN).11, 15, 16 In IPT, video microscopy is used to track the motions of particles residing in the cytoplasm. Quantification of these motions via the time-dependent mean-squared displacement (MSD) then allows to study the type of dynamic behavior (from sub- to superdiffusive) as well as the amplitude of the motions. The precise interpretation of these motions may differ from case to case. Several papers15, 16, 19 reported on BIN as a tool to measure intracellular viscoelasticity, while other studies20, 21 showed evidence that also molecular motors may contribute to particle motion. In anticipation of the latter, also a method of eliminating the ATP driven processes has been proposed.13 These various findings indicate that IPT should not be regarded as a nanomechanical tool by default. However, one would still expect that a change in the cytoskeletal mechanics (like the softening of a cancer cell) also becomes manifest as a change in the MSD. Then, having MSD curves for reference states (e.g., healthy cell, benign or malignant tumor cell) might allow us to characterize the cellular state from the MSD. To explore this potential, we studied cancer cells of different origin (breast and pancreas cancer) with IPT. Comparisons between the MSDs of benign and malignant cancer cells were made for both cell types, using two kinds of probe particles: (1) endogenous granules (EGs), which can be visualized with phase contrast microscopy, and (2) ballistically injected latex particles (BIPs) with carboxylate groups at their surface and a fluorescent core to facilitate visualization. Both probes are attractive candidates for IPT applications and have been used in previous IPT studies.12, 14, 17 To assess the utility of IPT in comparison to other methods for mechanical diagnosis, we also performed elasticity measurements on the same cells using AFM in force-distance mode. We here show that for both breast and pancreas cancer cells, and for both EGs and BIPs as probes, strong differences in MSD are found for benign and malignant tumor cells. Also, we can demonstrate that AFM and IPT inherently measure different biomechanical aspects of the same cell, and could hence serve as complementary techniques. 2.Materials and Methods2.1.Cell CultureHuman pancreas adenocarcinoma PaTu8988S (PA-S) and PaTu8988T (PA-T) cells were established from the same pancreatic tumor22 and obtained from DSMZ (Germany). Cells were cultured in Dulbecco’s Modified Eagle Medium (DMEM) containing 5% fetal bovine serum, 5% horse serum, and 1% L-glutamine (DSMZ, Germany). Human breast epithelial adenocarcinoma MCF-7 cells were cultured in RPMI1640 (Lonza) containing 10% FCS, 1% L-glutamine, insulin, sodium pyruvate, and nonessential amino acids. Human breast fibrocystic epithelial cells MCF-10A were cultured in Endothelial Growth Medium 2 (EGM-2; Lonza). Cells to be analyzed with AFM and intracellular particle tracking (IPT) were grown on a Delta-T culture disk (Bioptechs, Butler, Pennsylvania) until they reached 80 to 100% confluency and were kept under physiological conditions ( , 5% ) until the measurements were completed. 2.2.Nanomechanical Measurements with AFMForce-distance (F-D) curves were obtained using a home-built AFM head. This AFM, described in Ref. 23, uses the reflection of a laser beam for detection and contains a goggle for liquid operation. To extend the ( , , ) translation ranges to in each direction, it was mounted on a piezostage (Physik Instrumente) that in turn was mounted on the table of an inverted microscope (Nikon Eclipse TE300). In our application, displacements of the cantilever base were controlled by a Nanoscope III controller (Veeco). Cells were prestained with DiI (Invitrogen, Breda, The Netherlands) to enable clear distinction of nuclei and membrane, as needed for the vertical and lateral positioning of the tip with respect to the cell. The latter was achieved using a combination of transmission, reflection, and epifluorescent imaging mode [see Fig. 1 for an impression]. Fig. 1Phase contrast images of pancreatic and breast tumor cells. (1) Image demonstrating the AFM tip aligned over the central (nuclear) region of a cell. The insets show the pyramidal tip in reflective imaging mode and MCF-7cells in epifluorescent imaging mode. (2), (3), (5), and (6) Typical morphology of a confluent monolayer of MCF-7, MCF-10A, PA-T, and PA-S cells. (4) Illustration of the intracellular locations of BIPs (here highlighted as black solid circles) in a monolayer of MCF-10A cells. The scale bar applies to all images and measures .  All experiments were done using silicon nitride cantilevers (Microlevers) having an experimentally determined spring constant24 of and a pyramidal tip with a half opening angle of . For each cell line, 3 to 4 different cells were studied, measuring 50 to 100 F-D curves per cell. Measurements were always done on top of the nuclear area. The typical force was , corresponding to a typical indentation of , which is small compared to the height of the cells. The F-D curves were also measured as a function of loading rate, covering 0.05, 0.1, 0.5, 1.0, and , with each half-cycle corresponding to a travel of by the cantilever base. Apparent Young’s moduli were obtained by fitting a modified Hertz model 25 to the data. Here, the Poisson ratio of the cell was assumed to be 0.5, and the finite thickness of the cytoplasm between the membrane and the nucleus was not taken into account. 2.3.Intracellular ProbesWe used two probes—ballistically injected particles and endogenous granules. The EGs were confirmed to be predominantly lipid droplets as proven by staining with Nile Red (Invitrogen). These granules have a mean diameter and appear as dark objects under phase contrast microscopy. The typical number of EGs per movie recorded was 20 to 50, which was sufficiently high for getting MSDs with a good signal-to-noise ratio (SNR). The particles were generally distributed evenly over the perinuclear cytoplasm. BIPs can be chosen in different sizes and surface chemistries. Our BIPs were red-fluorescent carboxylated polystyrene particles with a diameter of (Invitrogen). These particles appear as bright spots in confocal fluorescent imaging and as black spots in brightfield mode. Ballistic injection is needed to obtain enough particles per cell. In this case, homogeneous spreading of the probes is ensured by the injection method. We followed the procedure developed by Panorchan 15 and adopted for our case as described in Ref. 14. Briefly, a particle suspension at 2% weight concentration (Invitrogen) was diluted in pure ethanol and centrifuged at for in a Micromax RF microcentrifuge (IEC), after which the sediment was resuspended to reach again 2% weight concentration in ethanol. For efficient injection, the particles were first spin-coated onto a macrocarrier disk of the Biolistic gun (He/PS 1000, BioRad). Ballistic bombardments were performed using optimized injection parameters (vacuum level, Helium pressure, carrier disk–cell sample distance). To prevent endocytosis of noninjected particles, samples were flushed with growth medium extensively after bombardment, replated, and incubated for at least before the particle tracking experiments. This procedure yielded typically 5 to 20 particles per cell. 2.4.Particle Tracking Using Optical MicroscopyProbe particles were visualized using the UltraView LCI10 system (Perkin Elmer), in which a Yokogawa spinning-disk confocal unit is combined with a Nikon Eclipse TE-300 microscope. A (NA 1.3) oil immersion objective was used. BIPs were visualized in confocal fluorescence mode, while endogenous granules were imaged in phase contrast mode. In a typical movie, 2500 images were recorded with a CCD camera (Hamamatsu) at for a typical duration of . The image size was , which typically included 10 to 20 individual cells. The spatial resolution corresponding to the images was , and the focal plane in which particles could be detected had a width of . For each cell line, 10 to 20 measurements were done as visible in the field of view of the microscope. Particle tracking was performed using the available particle-tracking code written in IDL26 and described in Ref. 27. Excellent descriptions of the theoretical background and the methodology of particle tracking can be found in Refs. 18, 28, 29. Briefly, the particles were localized per individual frame (typical accuracy: ) after which the in-plane (i.e., , ) displacements of the same particle were combined into a trajectory. From these trajectories the mean squared displacement (MSD) versus lagtime function is calculated by averaging over particles and time steps: where and correspond to the position of particle at time , the brackets ⟨ ⟩ indicate an averaging over all times , and { } represents averaging over all particles . More details on averaging issues and SNR can be found in Ref. 12. In our case, the probe particles were compartmentalized in cells, which in principle allow us to calculate average MSDs per cell. In this study, averaging was done over all 10 to 20 measurements that were recorded per cell line unless mentioned otherwise.3.Results and Discussion3.1.Intracellular Particle TrackingIn Fig. 1, phase contrast microscopy images are shown for each of the studied cell lines. In all cases, the degree of confluency was between 80 and 100%. For cell densities significantly below 100%, benign cells could be recognized by their tendency to form tightly bound colonies, while the malignant pancreas tumor cells could be recognized by their relatively high growth rate. However, once the cells had reached the (near) confluent state, they could no longer be distinguished by cell morphology. Figure 1 shows the morphologies of the benign and malignant cells in the (near) confluent state. The results of the IPT experiments with the four cell lines are summarized in Fig. 2 . Each subfigure shows the total average MSD obtained by subaveraging first over all particles in the same image-time series (capturing 10 to 20 cells simultaneously), and subsequently over 10 to 20 such movies taken at different locations in the culture dish. In Fig. 2a, the subaverage results are also shown (for BIPs in MCF cells). Importantly, in some cell lines, not only the total average MSDs of benign and malignant cells are strongly different, but also the subaverage MSDs clearly reveal to which family of curves (i.e., benign or malignant) they belong—for example, the dynamics of BIPs in breast tumor cells and the dynamics of EGs in pancreas tumor cells. The same observation was made for the other cell/probe combinations (not shown). Taken together, these findings suggest that only a few cells could be sufficient to determine whether the sampled tissue contains benign or malignant cells. Moreover, since the amplitude difference between the MSDs of malignant and benign cells is very large (up to an order of magnitude) and also persists over a large range of lagtimes (two decades), the outcome of such a test would not critically depend on the precise time scale (range) of the experiment. Fig. 2Mean square displacement vs lagtime functions of EGs and BIPs in two pairs of tumor cells under physiological conditions. Solid symbols: malignant tumor cells; open symbols: benign tumor cells. Results are averaged over 10 to 20 measurements in each cell line. Error bars reflect standard errors. (a) Dashed/solid lines: single-movie measurements of MCF-7/MCF-10A. 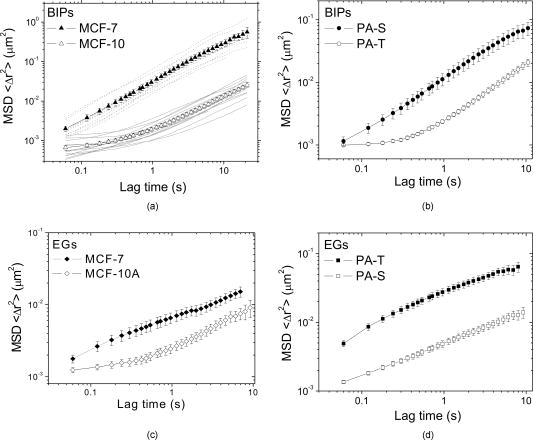 The results of Fig. 2 raise two questions: (1) what could be the physical origin of the different MSDs found for the same type of probe particles in the benign and malignant cells, and (2) why the MSDs for EGs and BIPs inside the same cell are so different. Regarding the first question, it is clear from the literature on IPT and BIN15, 16, 19 that intracellular particles of colloidal size probe the constraints presented by the viscoelastic polymer network that embeds them or that binds to them. Then the erratic motions of the particles can be seen as the result of a driving force that excites the particle motion, and a viscoelastic response force that provides damping. In case the driving forces would be purely thermal collisions, the MSD would represent local viscoelastic properties. However, in a living cell, it cannot be ruled out that also molecular motor–driven processes are responsible for particle motion. This means that (in the absence of additional information) one can not in principle say to what extent the larger MSDs for the malignant cells (found for both probes and both cell types) are due to a lower viscoelastic resistance or due to stronger driving forces. As a note, we add here that in a recent study,21 it was found that for lagtimes , nonthermal contributions were negligible. In that light, our MSD measurements at short lagtimes would suggest that (except for BIPs in pancreatic tumor cells) for malignant cells, the viscoelastic resistance to deformation is smaller. This is also what would be expected from the physiological argument that malignant cells are more deformable because of their metastatic nature. Concerning the second question, the answer has to be that the two probes occur in rather different local microenvironments (i.e., polymer network surroundings). This is not surprising, considering that the surface chemistry (i.e., the groups that are exposed to the cytoplasm) of EGs and BIPs is expectedly also very different: for EGs, this is the least known but most probably a variety of (surface active) proteins,30 while for BIPs it is known to be carboxylate groups only. Moreover, in previous studies,14, 17 we also found that while the dynamics of EGs is closely linked to that of the microtubules, the motions of BIPs are strongly correlated to the actin network. Due to these different microenvironments, the driving forces and/or viscoelastic resistance are very different. The foregoing analysis raises an additional question; how measurements of intracellular MSDs could be connected to the viscoelastic properties of the whole cell. It is generally believed that the mechanics of the cell is dominated by the cytoskeleton. Taken together with the notions that BIPs are embedded in the actin network, and that BIPs are not very obviously driven by ATP (unlike EGs),14, 16 it is then suggested that the MSDs of the BIPs should give the closest representation of the cell’s viscoelastic properties. From the shapes of the MSD curves for BIPs, it seems that the benign cells behave like a viscoelastic liquid (similar to a Maxwell fluid, see Ref. 31 for examples), whereas the malignant cells appear more fluid like. 3.2.Atomic Force MicroscopyConsidering the expected relative softness for the malignant cells and the findings with IPT, it is interesting to examine measurements made on the same cells with AFM in force-distance mode. Anticipating a viscoelastic response, we measured the curves as a function of loading rate. A typical series of force-indentation curves is given in the inset of Fig. 3 . All curves are fairly well described by a parabolic equation, even though this is expected only for quasistatic indentation of an elastic material with a pyramidal tip.8 Fitting the modified Hertz model25 allowed us to obtain an apparent Young’s modulus from each of the force-indentation curves. The results are summarized in Fig. 3. Fig. 3Loading rate–dependent apparent elastic Young’s modulus of two pairs of tumor cells under physiological conditions. Left: breast cancer cells, MCF-10A vs MCF-7. Right: Pancreatic tumor cells, PA-S vs PA-T. The inset shows the indentation force vs indentation depth curve of a single PA-T cell at different loading rates.  First, we note that the difference between the values of for the malignant and benign cells (at the same loading rate) is large for the breast cancer cells, but insignificant for the pancreatic cancer cells. This is all the more remarkable, considering that the values for the malignant breast and pancreatic cells are very similar. This circumstance should make the measurements very comparable, and make it unlikely that differences in the AFM experiment (rate and range of indentation, local strain fields) play a role. We thus believe that the data do capture the presence or absence of differences in cell stiffness. To what extent the measurements are truly quantitative will be discussed later. We conclude that at least under the conditions that we used, AFM is able to distinguish the MCF-7 from the MCF-10A cells, but not the PA-S cells from the PA-T cells. It is also observed in Fig. 3 that for all cell types, the apparent elastic modulus shows an increase with loading rate. Considering that the loading rate varies over almost two decades, the factor 2 increase in seems modest. To examine the possibility that the loading rate dependence is due to hydrodynamic forces, we also performed measurements on hard substrates in water. Even close to the hard surface, no forces with a magnitude comparable to the experiments with cells could be found. This suggests that the trends in Fig. 3 are indeed due to the viscoelastic nature of the cells. We now compare our results with literature findings. It is interesting to note that qualitatively similar results were obtained for the MCF-7 and MCF-10A cells by Li 7 While their loading rate dependence of was very similar, the magnitudes of found by them are a factor 5 lower than ours. It is not evident where this difference originates from. Most probably they are due to differences in measurement. Li used a colloidal tip and limited the indentation range to or less. This implies a larger contact surface and lower strains in their experiments. Also the finite thickness effect32 could have affected their measurements less than ours. Each of these differences could cause significant effects on the values obtained for . Moreover, besides these aspects, which would already apply for homogeneous viscoelastic bodies, there is also the fact that mammalian cells are composite bodies, which in the simplest case should consist of a mechanically distinct cortex and cytoplasm.31 To which extent these two elements are probed depends on the strain field, which is not easy to assess in a composite body. Hence, the difference between the two measurements (i.e., Li 7 versus ours) may also be due to different relative contributions of the cortex and cytoplasm. On the basis of these considerations, it cannot be entirely ruled out that under different conditions, it might still be possible to distinguish between PA-S and PA-T with AFM. On the other hand, it can also be concluded that also with AFM, it is challenging to obtain a quantitative mechanical characterization of the tumor cells. 4.Further Considerations4.1.Comparison of IPT and AFMAlthough both intracellular particle dynamics as measured with IPT and the apparent Young’s modulus as measured with AFM are related to mechanical properties of the cell, it has also become clear that a direct comparison of the IPT and AFM results at the level of viscoelastic properties is not feasible. This is further illustrated by a comparison of the apparent elastic modulus of the MCF10A cells as obtained from an (over)simplistic interpretation. Using AFM in the limit of small loading rates, an of is obtained (see Fig. 3). In contrast, application of the generalized Stokes-Einstein relation (that assumes thermal driving forces)29 to the MSD plateau found with BIPs (Fig. 2), yields an apparent ( for incompressible materials) of . This enormous difference suggests that even if the conditions for the IPT and AFM experiments could be chosen such that well-defined mechanical properties would be measured, different viscoelastic behaviors would still be found with the two techniques. Considering the complex mechanical architecture of the cell, this is also not surprising. While IPT probes the dynamics of the intracellular cytoskeleton, AFM probably probes a combination of the elastic shell and the viscoelastic interior of the cell. This means that even under conditions optimized for measuring purely mechanical properties, different mechanical aspects of the same cell are measured. In this respect, the two techniques could be seen as complementary to each other. Another aspect is the degree of biochemical selectivity that can be achieved with the two techniques. Most AFM studies have used an inert pyramidal tip9 or colloidal particle7, 10 to probe the cell just like it would probe any other viscoelastic body. However, also measurements that are more specifically aimed at the cytoskeleton are possible, e.g., by using a functionalized tip that binds to integrin receptors on the cell surface.33 With IPT, possibilities for studying (processes related to) cell mechanics with or without molecular sensitivity seem even larger. This is illustrated by several previous BIN studies using (weakly interacting) carboxylate, (strongly binding) amino 16 and (inert) PEG34 surface coatings, and by our earlier studies on EGs and BIPs in Hmec-1 cells, which gave qualitatively different MSDs that were ascribed to different components of the cytoskeleton.14, 17. On the technical level, AFM is clearly a more demanding technique than IPT, when applied to living cells. Alignment of the tip with respect to the cell requires a good optical access of both tip and cell, and an accurate positional control combined with a large range. Since cells are soft objects, they require soft cantilevers, and hence the sensitivity to acoustic noise is high.9 And last, the transmission of the laser beam (used for measuring cantilever deflection) can also be compromised by liquid turbidity caused by either the cell medium or cell debris. In contrast, IPT requires only that the cells adhere to a transparent substrate, that the probe particles are visible with a microscope, and that they show enough motion to obtain an MSD. In the case of BIPs, an extra bombardment step is needed, in return for a very well defined particle size and surface chemistry. 4.2.Implementation Perspectives for IPTThe present study is, as far as we know, the first application of IPT to characterize benign and malignant cancer cells. We applied it to cell lines originating from two different tissues, breast and pancreas, and found clear differences between the respective MSDs. In the case of isogenic pancreas cells, IPT was even able to distinguish malignant from benign cell lines, whereas this was not possible with our AFM measurement. Whether IPT would be more broadly applicable for cell characterization would require additional experiments with tumor and healthy cells and tissues from the same donor, but the perspectives seem good, for different reasons:
5.SummaryThe mean squared displacement function measured with intracellular particle tracking cannot be generally linked to a well-defined mechanical property of the cell, but was found to be very sensitive to differentiation state of cancer cells, for two tissue types and for two different kinds of probe particles. Cell state could be simply identified by comparison with reference MSD curves for the same probe. This indicates a good potential for using IPT to diagnose cells whose health state is reflected in their mechanical properties. As such, IPT appears to be a valuable nanomechanical tool that is complementary to AFM. AcknowledgmentsThis research was supported by the Cell Stress Program of the Institute of Nanotechnology and BMBF Grants Cell@Nano and NanoCare. We are grateful to Denis Wirtz and Liesbeth Pierson for advice on ballistic particle injection. We thank Cock Harteveld and Mariska van der Weide for technical support and Istvan Vermes, Andries van der Meer, and Frieder Mugele for discussions. ReferencesS. Suresh,
“Biomechanics and biophysics of cancer cells,”
Acta Biomater., 3 413
–438
(2007). https://doi.org/10.1016/j.actbio.2007.04.002 1742-7061 Google Scholar
S. Suresh,
“Elastic clues in cancer detection,”
Nat. Nanotechnol., 2 748
–749
(2007). 1748-3387 Google Scholar
S. Suresh, J. Spatz, J. P. Mills, A. Micoulet, M. Dao, C. T. Lim, M. Beil, and T. Seufferlein,
“Connection between single-cell biomechanics and human disease states: gastrointestinal cancer and malaria,”
Acta Biomater., 1 15
–30
(2005). https://doi.org/10.1016/j.actbio.2004.09.001 1742-7061 Google Scholar
G. Y. H. Lee and C. T. Lim,
“Biomechanical approaches to studying human diseases,”
Trends Biotechnol., 25
(3), 111
–118
(2007). https://doi.org/10.1016/j.tibtech.2007.01.005 0167-7799 Google Scholar
S. E. Cross, Y. S. Jin, J. Y. Rao, and J. K. Gimzewski,
“Nanomechanical analysis of cells from cancer patients,”
Nat. Nanotechnol., 2 780
–783
(2007). https://doi.org/10.1038/nnano.2007.388 1748-3387 Google Scholar
S. E. Cross, Y. S. Jin, J. Tondre, R. Wong, J. Y. Rao, and J. K. Gimzewski,
“AFM-based analysis of human metastatic cancer cells,”
Nanotechnology, 19 384003
(2008). https://doi.org/10.1088/0957-4484/19/38/384003 0957-4484 Google Scholar
Q. S. Li, G. Y. H. Lee, C. N. Ong, and C. T. Lim,
“AFM indentation study of breast cancer cells,”
Biochem. Biophys. Res. Commun., 374 609
–613
(2008). https://doi.org/10.1016/j.bbrc.2008.07.078 0006-291X Google Scholar
H. J. Butt, B. Cappella, and M. Kappl,
“Force measurements with the atomic force microscope: technique, interpretation and applications,”
Surf. Sci. Rep., 59
(1–6), 105
–110
(2005). https://doi.org/10.1016/j.surfrep.2005.08.003 0167-5729 Google Scholar
M. Radmacher, Y. Wang and D. E. Discher,
“Studying the mechanics of cellular processes by atomic force microscopy,”
Cell Mechanics, 83 348
–369 Academic Press, Burlington, MA (2007). Google Scholar
G. T. Charras and M. A. Horton,
“Determination of cellular strains by combined atomic force microscopy and finite element modeling,”
Biophys. J., 83
(2), 858
–879
(2002). https://doi.org/10.1016/S0006-3495(02)75214-4 0006-3495 Google Scholar
T. P. Kole, Y. Tseng, I. Jiang, J. L. Katz, and D. Wirtz,
“Intracellular mechanics of migrating fibroblast,”
Mol. Biol. Cell, 16 328
–338
(2005). 1059-1524 Google Scholar
M. H. G. Duits, Y. Li, S. A. Vanapalli, and F. Mugele,
“Mapping of spatiotemporal heterogeneous particle dynamics in living cells,”
Phys. Rev. E, 79 051910
(2009). https://doi.org/10.1103/PhysRevE.79.051910 1063-651X Google Scholar
B. D. Hoffman, G. Massiera, K. M. V. Citters, and J. C. Crocker,
“The consensus mechanics of cultured mammalian cells,”
Proc. Natl. Acad. Sci. U.S.A., 103
(27), 10259
–10264
(2006). https://doi.org/10.1073/pnas.0510348103 0027-8424 Google Scholar
Y. Li, S. A. Vanapalli, and M. H. G. Duits,
“Dynamics of ballistically injected latex particles in living human endothelial cells,”
Biorheology, 46
(4), 309
–321
(2009). 0006-355X Google Scholar
P. Panorchan, J. S. Lee, B. R. Daniels, T. P. Kole, Y. Tseng, and D. Wirtz, Y. Wang and D. E. Discher,
“Probing cellular mechanical responses to stimuli using ballistic intracellular nanorheology,”
Cell Mechanics, 83 117
–141 Academic Press, Burlington, MA (2007). Google Scholar
Y. Tseng, T. P. Kole, and D. Wirtz,
“Micromechanical mapping of live cells by multiple-particle-tracking microrheology,”
Biophys. J., 83
(6), 3162
–3176
(2002). https://doi.org/10.1016/S0006-3495(02)75319-8 0006-3495 Google Scholar
S. A. Vanapalli, Y. Li, F. Mugele, and M. H. G. Duits,
“On the origins of the universal dynamics of endogenous granules in mammalian cells,”
Mol. Cell. Biomech., 150 1
–16
(2009). Google Scholar
D. Weihs, T. G. Mason, and M. A. Teitell,
“Bio-microrheology: a frontier in microrheology,”
Biophys. J., 91
(11), 4296
–4305
(2006). https://doi.org/10.1529/biophysj.106.081109 0006-3495 Google Scholar
S. R. Heidemann and D. Wirtz,
“Towards a regional approach to cell mechanics,”
Trends Cell Biol., 14
(4), 160
–166
(2004). https://doi.org/10.1016/j.tcb.2004.02.003 0962-8924 Google Scholar
A. W. C. Lau, B. D. Hoffman, A. Davies, J. C. Crocker, and T. C. Lubensky,
“Microrheology, stress fluctuations, and active behavior of living cells,”
Phys. Rev. Lett., 91
(19), 198101
(2003). https://doi.org/10.1103/PhysRevLett.91.198101 0031-9007 Google Scholar
D. Mizuno, C. Tardin, C. F. Schmidt, and F. C. MacKintosh,
“Nonequilibrium mechanics of active cytoskeletal networks,”
Science, 315
(5810), 370
–373
(2007). https://doi.org/10.1126/science.1134404 0036-8075 Google Scholar
H. P. Elsasser, U. Lehr, B. Agricola, and H. F. Kern,
“Establishment and characterisation of two cell lines with different grade of differentiation derived from one primary human pancreatic adenocarcinoma,”
Virchows Arch., 61
(5), 295
–306
(1992). https://doi.org/10.1007/BF02890431 0945-6317 Google Scholar
K. O. Van der Werf, C. A. J. Putman, B. G. Degrooth, F. B. Segerink, E. H. Schipper, H. F. V. Hulst, and J. Greve,
“Compact stand-alone atomic-force microscope,”
Rev. Sci. Instrum., 64
(10), 2892
–2897
(1993). https://doi.org/10.1063/1.1144378 0034-6748 Google Scholar
R. Levy and M. Maaloum,
“Measuring the spring constant of atomic force microscope cantilevers: thermal fluctuations and other methods,”
Nanotechnology, 13 33
–37
(2002). https://doi.org/10.1088/0957-4484/13/1/307 0957-4484 Google Scholar
I. N. Sneddon,
“The relation between load and penetration in the axisymmetric Boussinesq problem for a punch of arbitrary profile,”
Int. J. Eng. Sci., 3 47
–57
(1965). https://doi.org/10.1016/0020-7225(65)90019-4 0020-7225 Google Scholar
J. C. Crocker and D. G. Grier,
“Methods of digital video microscopy for colloidal studies,”
J. Colloid Interface Sci., 179 298
–310
(1996). https://doi.org/10.1006/jcis.1996.0217 0021-9797 Google Scholar
T. G. Mason,
“Estimating the viscoelastic moduli of complex fluids using the generalized Stokes-Einstein equation,”
Rheol. Acta, 39
(4), 371
–378
(2000). https://doi.org/10.1007/s003970000094 0035-4511 Google Scholar
T. A. Waigh,
“Microrheology of complex fluids,”
Rep. Prog. Phys., 68 685
–742
(2005). https://doi.org/10.1088/0034-4885/68/3/R04 0034-4885 Google Scholar
R. Bartz, W.-H. Li, B. Venables, J. K. Zehmer, M. R. Roth, R. Welti, R. G. W. Anderson, P. Liu, and K. D. Chapman,
“Lipidomics reveals that adiposomes store ether lipids and mediate phospholipid traffic,”
J. Lipid Res., 48 837
–847
(2007). https://doi.org/10.1194/jlr.M600413-JLR200 0022-2275 Google Scholar
C. T. Lim, E. H. Zhou, and S. T. Quek,
“Mechanical models for living cells—a review,”
J. Biomech., 39
(2), 195
–216
(2006). https://doi.org/10.1016/j.jbiomech.2004.12.008 0021-9290 Google Scholar
R. E. Mahaffy, S. Park, E. Gerde, J. Kas, and C. K. Shin,
“Quantitative analysis of the viscoelastic properties of thin regions of fibroblasts using atomic force microscopy,”
Biophys. J., 86
(3), 1777
–1793
(2004). https://doi.org/10.1016/S0006-3495(04)74245-9 0006-3495 Google Scholar
Y. Verdier and B. Penke,
“Binding sites of amyloid beta-peptide in cell plasma membrane and implications for Alzheimer’s disease,”
Curr. Protein Pept. Sci., 5
(1), 19
–31
(2004). https://doi.org/10.2174/1389203043486937 1389-2037 Google Scholar
B. R. Daniels, B. C. Masi, and D. Wirtz,
“Probing single-cell micromechanics in vivo: the microrheology of C. elegans developing embryos,”
Biophys. J., 90
(12), 4712
–4719
(2006). https://doi.org/10.1529/biophysj.105.080606 0006-3495 Google Scholar
C. Rotsch and M. Radmacher,
“Drug-induced changes of cytoskeletal structure and mechanics in fibroblasts: an atomic force microscopy study,”
Biophys. J., 78 520
–535
(2000). https://doi.org/10.1016/S0006-3495(00)76614-8 0006-3495 Google Scholar
|


