
|
|
1.Introduction1.1.Apoptosis1.1.1.SignificanceApoptosis is a highly organized form of cell death, exhibiting distinct biochemical and morphological features. It is often referred to as “programmed cell death,” as all cells contain machinery that, once activated, leads to the cell’s self-destruction. Apoptosis is responsible for the deletion of cells in normal tissue to maintain homeostasis, as well as cell death in a number of pathological conditions. Recently, emphasis has been placed on the role of apoptosis in cancer. Apoptosis can occur spontaneously in malignant tumors and can often slow their growth.1, 2, 3 It is also clear that apoptosis is enhanced by most cancer treatment modalities,3, 4, 5 and an understanding of the relative roles of apoptosis versus other cell death mechanisms is crucial to the development of successful treatments.6 In fact, the initial response to successful cancer treatment is often massive apoptosis.3, 4 1.1.2.Morphological features of apoptosisSince elastic scattering spectroscopy (ESS) is sensitive to micromorphology changes at the subcellular level, the method presents an opportunity to monitor such changes in viable cells without the need for fixation or dyes. The changes associated with apoptosis—both biochemical and morphological—are unique and different from those of necrosis.7 While necrotic cells swell and lyse, affecting neighboring cells, apoptotic cells undergo a series of subcellular alterations leading to cell shrinkage and fragmentation of the cell into membrane-encompassed bodies that are neatly phagocytosed by neighboring cells. Very early in the apoptotic process, the cell begins to lose water in a phenomenon called apoptotic volume decrease (AVD). AVD results in the crowding of organelles and the formation of vacuoles. Ultimately, the cell membrane becomes convoluted and pinches off roughly spherical apoptotic bodies, which may or may not contain organelles and nuclear fragments.1, 2, 3 Dramatic morphological alterations occur in the nucleus. The chromatin condenses and segregates, forming well-defined masses inside the nucleus that either collect along the inner surface of the nuclear membrane or remain interspersed throughout the nucleus. As condensation progresses, the nuclear membrane may become convoluted and, in most cases, culminates with the fragmentation of the nucleus into discrete bodies where segregation of the chromatin is maintained.1, 2, 3 Within these nuclear fragments, the condensed chromatin may form crescent-shaped caps or cover the whole surface.1 Along with nuclear alterations, there are also ultrastructural changes in a cell’s mitochondria during apoptosis. These can comprise mitochondrial swelling,8, 9 a reduction of mitochondrial size with a corresponding increase in matrix density,10 fragmentation of mitochondrial network and christae remodeling, 11, 12, 13 progression of change in mitochondrial structure from normal to vesicular,14 and fragmentation of the mitochondria.15 An understanding of the early morphological changes that a cell undergoes during apoptosis can provide the opportunity to monitor apoptosis in tissue, yielding diagnostic and prognostic information.16 1.2.Current Assay Methods for ApoptosisApoptosis measurements are the primary method for anticancer drug evaluation in vitro. A number of assay methods currently exist that exploit either the morphological or biochemical features of apoptosis. Due to the dynamic nature of the apoptotic process, detection can be challenging. Apoptotic events can occur in as little as a few hours and can go undetected depending on the screening technique and sampling time.17, 18 Current “gold standard” assays include multiple-color fluorescence microscopy and flow cytometry. Microscopy allows for a qualitative observation of morphological features and is used to confirm the occurrence of apoptosis, whereas flow cytometry can quantify the percentage of apoptotic cells in a sample at a particular time after treatment. All current methods for apoptosis detection require either the addition of an exogenous agent to fix and stain the cells and/or physical or chemical disruption of the culture itself.7, 19 These methods can be tedious, labor intensive, and expensive, and are limited to assessment at a specific time point. Moreover, current apoptosis assays are often inadequately quantitative, leading to difficulties when quantitative information about disease pathways is desired. 20, 21, 22 1.3.Elastic Scattering SpectroscopyAn ideal detection method for apoptosis would allow for assessment of the apoptotic state of a population of cells without altering the cells’ environment or perturbing them in any way. The measurement should be fast, avoid significant temperature or pH changes in the sample, and allow the cell or tissue culture to be returned to the incubator following a measurement. No exogenous agent should be added to ensure the assay is not altering the biochemistry or time course of the apoptotic process. Such a method would also enable monitoring of a single cell sample over time, rather than requiring a new culture at each time point, thereby allowing for a more accurate assessment of cellular response by avoiding culture-to-culture biological variability. In addition, it would be ideal for this detection method to be sensitive to apoptotic changes as early in the process as possible, and with information that could elucidate the specific apoptotic pathways. These criteria would allow for more efficient testing for apoptosis in cell cultures during studies of new anticancer agents. With these criteria in mind, we are developing instrumentation to use elastic scattering spectroscopy (ESS) as a detection tool for apoptosis in cell cultures. ESS is an ideal method to probe cell morphology due to its inherent noninvasiveness. In cell cultures the measurements can be made within seconds, with the cells kept in standard culture conditions, and they can then be returned to the incubator between measurements. Alternatively, measurements can be made in situ on cell cultures in an incubator. With appropriate analysis algorithms, a quantitative determination of the cellular state can be achieved in real time. Given a reflectance geometry, the technique could even be extended to use in vivo, allowing assessment of tumor treatment efficacy within hours to days instead of the days to weeks required to observe shrinkage of a tumor. ESS is based on photons scattering elastically due to gradients and discontinuities of the index of refraction in cells. While the cell’s components are not perfectly spherical, the qualitative features of Mie theory can still be applied. Quantitative information can also be obtained for spheroidal particles.23 A common model used when describing scattering from cells is the homogeneous sphere model, in which each organelle is treated as two separate components—the scattering center and the surrounding cytoplasm. As an application of Mie theory, the scatterers are modeled as homogeneous spheres.24, 25, 26, 27, 28, 29, 30 The probability of scattering from a spherical particle illuminated by a plane wave depends on the “size parameter,” , a unitless parameter that relates the size of the particle to the wavelength of the light. The amount of scattering that occurs depends on multiple parameters: the radius of the scatterer , the wavelength of the light , the index of refraction of the scatterer , the index of the medium surrounding the scatterer , the scattering angle, and the polarization state of the light. By measuring the wavelength-dependent scattering of a particle at a known scattering angle, ESS can infer quantitative information, i.e., the size distribution and/or density, of the underlying scatterers in a cell sample by means of solving the inverse problem.24, 26, 29 The changes in morphology between apoptotic and normally propagating cells should produce a detectable difference in scattering spectra; and, by using a Mie theory-based method to extract a size distribution, this approach can yield quantitative information about how the cell’s morphology has changed. Moreover, ESS can assess morphology changes that correspond to particles smaller than the resolution limit of optical microscopy.29 1.4.Previous Studies1.4.1.Other approaches to optically monitor apoptosisWhile several groups have used scattering spectroscopy or angle-dependent scattering, usually in conjunction with Mie theory, to extract information about organelles (often nuclei or mitochondria), these studies generally have not dealt with dynamic processes such as apoptosis. 24, 25, 26, 29, 30, 31, 32, 33, 34, 35 To our knowledge, only Boustany and Chalut have directly addressed the scattering changes occurring in cell cultures on induction of apoptosis. 36, 37, 38 The technique of Boustany is microscopy-based, measuring the ratio of large-numerical-aperture scattering to small-numerical-aperture scattering with narrowband illumination. They are able to correlate changes in the scattering ratio with assumptions about changes in the size of the scatterers, but they do not extract quantitative size information. Chalut uses angle-resolved low coherence interferometry along with an inverse light scattering analysis based on T-matrix predictions. They observe no change in nuclear diameter or eccentricity, but the measurements reveal a change in organization of subcellular structures as interpreted with fractal dimension. 1.4.2.Relation of the current work to our previous workIn a recent publication, our group showed that the morphology differences between apoptotic and normal populations of cells produce detectable differences in scattering in both angularly resolved and wavelength-resolved measurements.39 Because scattering from cells, particularly from larger organelles, is much stronger in the near-forward direction than at large scattering angles,24, 25, 31, 40 our preliminary system for measuring wavelength-dependent scattering was set up to take measurements in the near-forward direction from suspensions or plated cell cultures. Since the nucleus is a large organelle, and it undergoes significant morphology changes during apoptosis, that system was able to measure these scattering differences. The setup was sensitive to changes in apoptotic morphology as early as one hour post-treatment, with progressive scattering changes that became maximal at six hours. While it was encouraging that the scattering differences between apoptotic and normal cells increased over time, suggesting a progressing cellular process, the spectra exhibited only subtle wavelength variation, and no attempt was made to extract size information from those collected spectra. The main purpose of that report was to demonstrate proof of principle that ESS can be sensitive to apoptotic changes in cell cultures. In this work we report the enhanced sensitivity to morphology changes for measurements in the backscattering direction, we report much earlier sensing of apoptotic changes, and we extract quantitative size distributions from the spectra. 2.Experiment Design2.1.BackscatteringMie theory predicts that light scattered from a particle in the backward direction will exhibit stronger wavelength-dependent features than it will in the forward direction.35 These wavelength-dependent features are key to monitoring subtle morphology changes and extracting size information from the collected spectra. Spectra that comprise various spectral features should provide better opportunity for fitting to Mie theory predictions than spectra with few features or those that only exhibit an overall slope change. The Mie scattering efficiency for backscattering is orders of magnitude weaker than for near-forward scattering, necessitating careful experimentation to achieve adequate signal-to-noise ratio (SNR). Nonetheless, with more spectral features in the backward direction, a relatively small change in the distribution of effective particle sizes should produce a significant difference in scattering pattern, which should therefore increase sensitivity earlier in the apoptotic process. The probe-based geometry of backscattering measurements employed here may also allow for better translation to in-vivo studies. 2.2.Instrument DesignA system for measuring the wavelength-dependent scattering from either suspensions or plated cell cultures in the near-backward direction has been developed. A simplified schematic is shown in Fig. 1 . A cw xenon arc lamp, operating at , was used as the light source to achieve adequate signal from a weakly backscattering monolayer of cells. Light was carried to and from the cell sample by a fiber optic probe. Limiting the range of angles collected by the probe was critical in obtaining accurate spectra, particularly from large particles. Even over a relatively small range of angles, the small shifts in the fast wavelength-dependent oscillations at a given angle can cause the oscillations to average out, leaving poor comparisons to Mie theory. To restrict the angle range collected, fibers were used, and distances such that the angular range of collected light was about . The small fibers drastically limited the light collected, so to increase the intensity, a probe was fabricated with six illumination fibers surrounding a single detection fiber. A cross section of the fiber probe can be found in Fig. 1a. The center of each illumination fiber was positioned about from the center of the collection fiber in a circularly symmetrical pattern. This geometry does prevent polarization analysis, but at scattering angles near , scattering from orthogonal polarization states varies very little, and such analysis would yield little additional information. Fig. 1(a) Schematic of the optical setup for ESS measurements in the backward direction. (b) Cross section of the fiber optic probe for backscattering measurements. The six outer fibers are illumination fibers. The center fiber is the collection fiber. 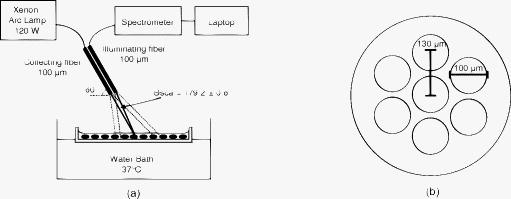 The cell samples were grown on two-well glass chamber slides (Lab-Tek® II Chamber Slide™ System, Nalge Nunc International, Rochester, New York). The fiber optic probe was positioned above the chamber slide at to normal to prevent collection of any specularly reflected light from the fluid or slide surfaces. In this configuration, the fibers were located approximately from the slide surface, resulting in a median scattering angle of . Scattered light was collected where the cones of the illumination and collection fibers overlapped on the sample plate, a spot size approximately in diameter, illuminating approximately cells. For clarity, only one pair of fibers and their acceptance cones are depicted in the schematic in Fig. 1. Given the inherently small scattering signal from cells in the backward direction, noise reduction is critical. To help eliminate background scattering, the cell chamber was placed in a water bath to minimize the index mismatch at the slide’s bottom surface. The basin was painted flat black to reduce any reflections from its sides and bottom. Additionally, the water bath was held at to help hold the cell’s environment at culture conditions. The scattered light collected by the center fiber was passed to a spectrometer (Ocean Optics USB4000, Dunedin, Florida), with the fiber acting as an angle-limiting aperture. When collecting measurements, the integration time was set to limit the integrated signal to approximately 70% of the detector’s dynamic range to avoid any nonlinearity. 2.3.Data Collection and AnalysisFor each sample, three separate measurements were required: the raw spectrum from the sample , a background measurement , and the system’s spectral response . The spectrum acquired from the sample contained all elements of the optical setup, including the scatterers and medium. Next, a background measurement was made invoking all elements of the optical setup with exception of the scatterers. The probe was placed in the same position as for the sample measurement to account for any background scattering from the slide, medium, or water bath. The measurement time was the same for the sample measurement and the background measurement, allowing direct subtraction. Lastly, a measurement was made with a spectrally flat reflectance standard (Spectralon, Labsphere, Incorporated, North Sutton, New Hampshire), to account for the spectral shape of the overall system response. To reduce noise, each measurement was first smoothed using a boxcar with a width corresponding to (the resolution of the spectrometer). Thus the scattering spectrum for each sample was calculated with the following formula: To obtain a result that was independent of the number of scatterers in the illuminated sample space or the intensity of the illuminating light, the resulting spectrum was normalized to the area under the curve. During these experiments, measurements were made for the spectral range .2.4.Extraction of Quantitative InformationThe most important phase of developing ESS as a detection tool for apoptosis is to relate the collected spectra to the underlying morphological features causing them. This involves extracting relevant features from the data and matching them to candidates for scattering centers. In this way, we hope to be able to determine the state of the cell’s organelles, and thus the cell’s progress in the apoptotic process. The most common approach to the inverse problem has been to fit experimental data to test functions computed using Mie theory over a reasonable range of values, while minimizing a particular parameter. Some groups assume a particular size distribution—Gaussian, 26, 31, 33 log normal,30, 32, 33 or exponential33—while others assume only that the size distribution must be non-negative.29 Minimization may be carried out using least-squares 29, 31 or 30, 32, 33 minimization. Another option for solving the inverse problem is one proposed by Perelman, in which they argue that cell nuclei introduce a periodic fine structure to reflectance measurements, with a periodicity that is approximately proportional to nuclear diameter. 34 The nuclear size distribution can then be obtained from the Fourier transform of the periodic component. As a first attempt at solving the inverse problem, we have implemented a Mie-theory-based computer algorithm to determine the size distribution of scatterers within a given sample. The algorithm generates a look-up table of Mie theory spectra for a range of particle sizes, given the indices of refraction for the particles and the medium, the scattering angle, and the polarization. Since the principle of superposition applies to elastic scattering, the algorithm solves the inverse problem by finding a size distribution of scatterers whose combined spectra provide the best fit to the experimental spectrum. This size distribution is expressed as the percentage contribution of each size to the overall optical signal. To determine the best fit, the algorithm performs a least-squares minimization with a non-negative constraint. For the phantom studies, we noted that for larger particles, the assumption of fixed indices of refraction caused a slight shift in scattering pattern far from the wavelength where the index was specified, resulting in poor fitting. To correct this, we have assumed the following functional form for wavelength-dependence (dispersion) of the index: where is expressed in nanometers. For water, , , and ,41 and for polystryrene, , , and .42 When considering cells, constant indices were assumed for both the organelles and the cytoplasm ( , ), yielding a relative index of refraction , which is a reasonable value for the scatterers in cells.25, 29, 43 Wavelength-dependence was not included in this case, since the values are already approximated, and the ratio is expected to vary little with wavelength, given a comparable dispersion rate for both the organelles and cytoplasm (mainly water).For phantom measurements, the Mie matrix was calculated using a broad range of sizes: in increments, giving 200 possible particle sizes. We note that our measured spectra contain about 240 independent data points corresponding to the number of resolution elements of the spectrometer. Thus, the upper limit on the number of sizes present in the matrix should be 240 to ensure a valid fit. While cells (in a culture with a single cell type) contain scatterers in the aforementioned range of sizes, these sizes are distributed in a punctate manner, with large gaps between sizes. It is also important to limit the number of sizes present in the matrix to minimize the possibility of a nonunique solution resulting from a highly multiparameter fit. Therefore, a modified Mie matrix was set up, including sizes representing specific size classes of organelles: Rayleigh scatterers (structures smaller than ), representing cytoskeleton, ribosomes,29 and other small structures; lysosomes and peroxisomes ;25 mitochondrial widths ;25 mitochondrial lengths ;25 and nuclei .25 When choosing the specific sizes for each organelle class, we initially set up the matrix with only one size in each range, yielding a matrix with five sizes: , , , , and .28 To determine which of these organelle classes contributed the most to the change in ESS signal, two sizes were added to the matrix, one class at a time, and the quality of the resulting fits were assessed by comparing them to those using the original five sizes. Addition of sizes in the lysosome class (150 and ) produced the best fits to the experimental data. Therefore, the analysis that is presented here invokes use of a Mie matrix with the following diameters: , , , , , , and . With only seven sizes, there are enough independent data points present in the measured spectra to ensure a valid fit while retaining high confidence that the resulting distribution will be unique. 2.5.Phantom Measurements for System ValidationTo validate both the instrument and the size extraction algorithm, measurements were performed on scattering phantoms of polystyrene spheres (Duke Scientific, Thermo Fisher Scientific, Waltham, Massachusetts), with NIST-traceable size distributions, in water. To ensure that collected light was limited to mostly single-scattering events, Mie theory was used to determine the concentration at which of the photons would undergo more than one scattering event at any angle. Given that backscattering is much weaker than near-forward scattering, although photons do have a non-negligible probability of undergoing multiple scattering events at this concentration, the majority of these multiple scattering events occur in the forward direction and are not collected by our backscattering system, leaving only those that have undergone a single, near- scattering event. Each sample was prepared by diluting a stock sphere suspension in deionized water, which was passed through a syringe filter to remove any possible dust particulate contamination. Three measurements were acquired for each sample, with measurement times ranging from depending on sphere size, to maximize use of the detector’s dynamic range. The spectra for each sample were analyzed according to Eq. 1. Each processed spectrum was then analyzed with the size-extraction algorithm, yielding the experimentally determined size distribution in the sample and its corresponding spectrum of best fit. Because it is important to verify operation over a large range of particle sizes, similar to what is found in cells, measurements were made with a range of particle sizes from . A representative sample of these measurements and their extracted size distributions are shown in Fig. 2, including an example of a size mixture. These verify that the system and fitting algorithm perform as expected. We note that the limited spectral and angular resolution of the system does not capture the fast Mie oscillations exhibited by large particles at wavelengths less that , as evidenced by the particle data in Fig. 2c. Nevertheless, the extracted size distribution is still in good agreement with the manufacturer’s specified diameters. Fig. 2Scattering from polystyrene sphere phantoms. The left panel contains the experimental spectrum and the spectrum of best fit, and the right panel shows the size distribution corresponding to that best fit spectrum for (a) particle suspension, (b) particle suspension, (c) particle suspension, and (d) a mixture of 0.3- and suspensions. 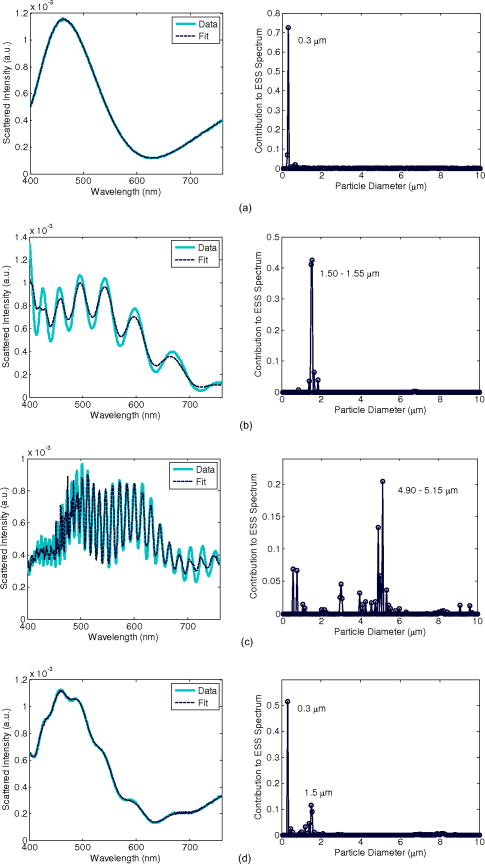 2.6.Apoptosis InductionTo determine how sensitive ESS backscattering measurements are to the morphology changes associated with apoptosis, we measured scattering from samples of Chinese hamster ovary (CHO) cells induced to undergo apoptosis, and compared them to measurements taken from normally propagating cells. Using standard cell culture technique, CHO cells were routinely cultured on polystyrene culture dishes in Dulbecco’s Modified Eagle’s Medium (DMEM) supplemented with 10% fetal bovine serum (FBS) and 1% penicillin and streptomycin (PAS), constituting a complete medium. Atmosphere was held at and 5% . To induce apoptosis in CHO cells, they were incubated in complete medium supplemented with staurosporine, a common apoptosis induction agent, for periods up to . Since the staurosporine is carried in solution in dimethyl sulfoxide (DMSO), a control volume of DMSO was added to the control samples to compensate for any effect it might have on the cells. We have previously verified that staurosporine induces apoptosis in these cell cultures through two gold-standard apoptosis assays.39 For a qualitative assessment of morphology, we stained treated and control populations of cells with Hoechst 33342, revealing that nuclear condensation manifests only in the treated cells, starting around post-treatment and is prevalent at . For a more quantitative assessment of the apoptotic population, we also performed a flow cytometer assay with Annexin V-fluorescein isothiocynate (FITC) versus propidium iodide (PI), on treated and control samples. This method senses an early apoptotic biochemical membrane event and provides cell counts. Results of this assay indicate that approximately 20% of the treated cells are apoptotic after , and the apoptotic population increases over time to about 40% at post-treatment, while the control cells exhibit a constant low percentage of apoptotic cells throughout the experiment. 2.7.Elastic Scattering Spectroscopy Measurements of ApoptosisTo prepare the cells for ESS measurements, individual samples were made by plating them in each of two wells of glass-bottom chamber slides and grown to confluence. No attempt was made to synchronize the cell cycle. The growth medium was aspirated and replaced with F-12 nutrient mixture supplemented with either staurosporine/DMSO or an equivalent volume of DMSO. F-12 was chosen for the optical measurements because it contains about ten-fold less riboflavin than does DMEM, which fluoresces when exposed to the high intensity of short wavelength light from the arc lamp. HEPES buffer was also added to help regulate the pH of the samples, eliminating the need to flow over the samples for the optical measurements. Thus, each slide held a pair of samples, one treated and the other control, so that any environmental factors would be identical for both. The three scattering measurements described in Sec. 2.3 were made starting post-treatment for every thereafter until , then at times 1-, 2-, 4-, and post-treatment to capture the onset and progression of changes in the optical signal. The measurement integration time was , and the slides were returned back to the incubator between measurements, so that the slides were not exposed to room conditions for longer than at a time. The data were processed as described earlier, and size distributions were extracted from the resulting spectra with the Mie-fitting algorithm. 3.Results3.1.Cell Data: SpectraScattering measurements were taken from 19 pairs of cell cultures. For each pair, one was treated to undergo apoptosis and the other treated with DMSO only. Scattering measurements were conducted for after treatment. Figure 3 shows a representative set of scattering data from one of these trials. Initial time points reveal little difference in scattering spectra between the treated and control samples. The spectra from the treated and control samples begin to diverge, consistently, between 10- and post-treatment for all 19 pairs of cell cultures in this study. The spectra continue to diverge, with the difference becoming maximal around post-treatment. After this, the spectra remain relatively stable (up to the maximum time in this study). These trends were consistent over all trials, though some biological variability was observed. Fig. 3A representative set of data from one trial during an apoptosis experiment. Each plot represents the elastic scattering data from two separate samples of CHO cells, one treated with staurosporine carried in DMSO (red), and the other with DMSO only (blue). Data were taken at times after treatment ranging from immediately following (top left) to (bottom right). (Color online only.)  To observe any effect the DMSO alone might have on the cells, we also plotted all treated and control spectra of the various time points for one (representative) trial as two grouped plots (see Fig. 4 ). The left panel shows the control sample over time, while the right panel shows the treated sample. The spectra taken from the control sample are all tightly grouped, indicating that the addition of DMSO, in the administered concentration, has little effect on the scattering properties of the cells. Therefore, we can conclude that the major differences in scattering between the treated and control samples are due to the effects of staurosporine, a known apoptosis inducer. Fig. 4The treated and untreated spectra from a representative trial of the apoptosis experiment plotted over time. Data plotted here are the same as in Fig. 3. Spectra from the untreated sample are plotted on the left, and those from the treated sample on the right. The early time points are represented in darker colors, whereas the later time points are lighter colors.  To assess changes in the backscattered spectrum for the entire group of samples measured, we calculated the ratio of scattered intensity at to that at for each sample and statistically analyzed them. The results of this analysis are shown in Fig. 5, which plots the mean ratio (± one standard deviation) of cells treated with staurosporine and those treated only with DMSO at each time point. A paired student’s t-test comparing the ratio from the DMSO- and staurosporine-treated cells revealed that the ratios were not significantly different at the 1-, 5-, and time points. The statistical differences were significant to for all time points from , respectively. Fig. 5Comparison of the scattering intensity ratios for cells treated with DMSO only (blue) and cells treated with staurosporine carried in DMSO (red) at various times post-treatment. The ratios of the staurosporine-treated cells are significantly different from the DMSO-treated cells at all but the 1-, 5-, and time points with # . (Color online only.)  These data indicate that our system is capable of capturing changes in the scattering spectra of apoptotic cells relative to those of control cells over time. The scattering differences captured here are more pronounced than those we previously measured in the forward direction,39 and are detectable much earlier in the apoptotic process. These results suggest that backscattering provides a more robust assessment of apoptosis in cell culture scattering measurements performed in the forward direction. Regardless of the specific biological mechanism, the consistent change in scattering spectra between the treated and control samples clearly indicates that the addition of stauropsorine is responsible. Therefore, it is likely that ESS is sensitive to some aspect of the apoptotic process, since staurosporine is a known apoptosis inducer, and we have previously shown that it induces apoptosis in CHO cells.39 Because an ideal detection tool should be sensitive to apoptosis as early in the process as possible, it is important to focus on the source of ESS signal at early time points. The only understood apoptotic effect known to manifest as early as the changes observed in our ESS signal is apoptotic volume decrease. 44 It is unlikely, however, that the obvious shrinkage of the cells due to water loss is the source of the ESS signal, given that the cell membrane is very thin and the index mismatch between the intra- and extracellular fluids is very small. Despite this, it is plausible that AVD is causing an organelle scattering change by increasing the index of refraction of the cytoplasm through water loss, thereby reducing the index mismatch between the organelles and the surrounding cytoplasm. It is more likely that the changes in scattering are due to one of the major morphological apoptotic events, as they are considerably more dramatic than AVD, though it is surprising that scattering differences between the apoptotic and control samples appear so early in the apoptotic process. Nuclear changes associated with apoptosis are the most dramatic, but nuclear condensation is not observable by fluorescence microscopy in these cells until post-treatment (data not shown), 39 and nuclear fragmentation does not occur until later. These nuclear changes are downstream of the caspase cascade45 (the series of proteases responsible for cleaving various proteins and ultimately the morphological features of apoptosis), therefore they are considered to be late apoptotic changes, and are likely not the source of our early ESS signal. The scattering changes observed by ESS could also be mitochondrial, as mitochondria are implicated relatively early in the apoptotic process. Some reports indicate that mitochondria swell during early apoptosis, 8, 9 while others indicate that the mitochondrial matrix condenses,10 depending on circumstances. A precise time scale is not clear (from the literature) for these changes, though either morphology change should be detectable by ESS. Mitochondria are also reported to fragment during apoptosis, but the exact timing in the process is unclear in the literature. Some suggest that mitochondrial fragmentation occurs in parallel with the formation of apoptotic bodies and an increase in DNA fragmentation,11 both of which are later-stage apoptotic events. In this case, mitochondrial fragmentation, if it occurs in CHO cells, would be too late to account for the early changes in scattering. Others indicate, however, that mitochondria fragment into multiple small units prior to, or simultaneous with, cytochrome c release and upstream of caspase activation,15 making mitochondrial fragmentation an early apoptotic event. If this is true, mitochondrial fragmentation could account for early scattering changes. Furthermore, condensation of the mitochondrial matrix is accompanied by dramatic christae remodeling11, 12, 13 and has been observed in vivo in apoptotic cells.11 The individual christae fuse into either a single or a few large compartments, and this remodeling can occur without mitochondrial swelling.13 The time scale for these changes is also promising. The mitochondrial stage of apoptotsis is upstream to the caspase cascade, making it an early apoptotic event.15 Scorrano have shown that after the addition of tBID (a molecule upstream of mitochondria in the apoptotic pathway), christae remodeling and subsequent cytochrome c release can occur quickly, in as little as .13 Therefore, if tBID is introduced to mitochondria soon after the addition of staurosporine, the remodeling of mitochondrial christae may occur on a time scale similar to the onset of our optical signal and would likely contribute to it. Further studies are needed to definitively determine the source of the ESS signal changes for early time points, and these will be the subject of a future publication. Nonetheless, we note that changes are detected by ESS much earlier than can be sensed by any of the standard apoptosis assay methods, and long before any change can be noted under optical microscopy, regardless of labeling. This suggests that the dominant early changes relate to an ultrastructure that is smaller than the resolution limit of standard optical microscopy. Electron microscopy will be necessary to observe subtle changes in ultrastructure, which may include early chromatin condensation, mitochondrial fragmentation, and mitochondrial christae remodeling. 3.2.Cell Data: Extracted Size DistributionsIn an effort to quantify the morphology changes that occur in apoptotic cells in this study, and to offer clues as to the origins of the spectral changes, we also performed size extraction analyses on all spectra collected from cell samples with the least-squares algorithm as described in Sec. 2.4. For illustrative purposes, the predicted Mie spectra of the particle sizes included in the matrix are shown in Fig. 6 . A set of best-fit spectra and their corresponding percentages for each size at relevant time points from the representative trial that was shown in Fig. 3 are presented in Fig. 7 . In each case, the fits to the experimental data are good, with the features of the experimental spectra well captured by the fitting algorithm. Furthermore, the majority of the ESS spectrum is due to the smallest sizes, with the Rayleigh, , and comprising approximately 90% of the overall signal. Fig. 6Wavelength-dependent spectra as predicted by Mie theory of the possible particle sizes considered for fitting to the cell data.  Fig. 7A representative set of best-fit curves to the experimental data presented in Fig. 3 (left panel) and the resulting size distributions (right panel) for relevant time points. The size distributions of the sample treated with DMSO only remains relatively constant. In the staurosporine-treated sample, there is a progressive decrease in the contribution of both the Rayleigh and scatterers, with a corresponding increase in contribution for the scatterers in the through time points.  We note that we do not remove the Rayleigh component of scattering before performing size extraction analysis, as has been done by other groups, 29 resulting in a seemingly larger percentage of small scatterers. It is not surprising that smaller structures dominate cellular scattering in the backward direction, as larger particles scatter predominantly in the forward direction, often by several orders of magnitude.24, 25 Mitochondria have previously been reported to significantly contribute to cellular scattering, but these studies were conducted using angularly resolved measurements with a forward-to-side scattering geometry.30, 33, 46 If the scattering changes are due to mitochondrial alterations, they may be ultrastructural and therefore not represented by the mitochondrial lengths in the matrix but by the smaller classes. This would be consistent with the early changes relating to structures that are beneath the resolution limit of optical microscopy. Also, the small percentage of the signal that is due to nuclear sizes in the backward direction is consistent with the small nuclear contribution to backscattering found by Perelman, where the analysis of nuclear size entailed extraction of nuclear scattering from a large background.34 We note that in the measurements immediately following treatment , the size distributions extracted from the treated and control spectra are quite similar, though not identical in some trials. We attribute this difference to a slight overall difference in spectral shape. The treated sample exhibits a slight decrease in scattering in the range when compared to the control sample. This feature is present in six of the 19 trials and contributes to the variability of our results. The source of this feature is unknown at this time, and will be investigated in future work. It is also encouraging that the extracted size distribution, like the measured spectrum, varies little over time in the control samples treated only with DMSO. This is contrasted with the staurosporine-treated samples, for which significant differences appear after treatment. For staurosporine-treated samples, at the through time points, there is a progressive decrease in the contributions of both Rayleigh and scatterers, with a corresponding increase in contribution from the scatterers. To determine whether these changes were consistent across all 19 cultures, we examined the extracted percentages of each size over time for both the cells treated with staurosporine and those treated only with DMSO. A paired student’s t-test comparing the mean percentage contributions of particle sizes in the staurosporine- and DMSO-treated cells was performed for each size present in the Mie matrix. These results are presented in Fig. 8 in the form of mean extracted percentages along with the standard error of them mean of all trials. This analysis revealed significant changes over time in the percentage contributions of the three smallest particle sizes. In the case of Rayleigh scatterers, the percentage in the control cells remained relatively constant, while the percentage decreased in the staurosporine-treated samples over time. The extracted contributions were not significantly different at the 1-, 5-, and timepoints, whereas the statistical differences were significant to , , and for the 15- and , the and , and the , , and time points, respectively. The scatterers exhibited a similar, though less dramatic, trend, like that of the Rayleigh scatterers, showing significant differences in extracted percentage of optical signal at the later time points. The statistical differences were significant to and and for the and , and the 2 through time points, respectively. The scatterers also exhibited a strong trend. Their contribution remained relatively constant in the cells treated only with DMSO, while it steadily increased in those treated with staurosporine. The difference was significant with in all but the 1- and time points. Interestingly, the overall shift from smaller to larger particles in the samples treated to undergo apoptosis is, perhaps, counter to the view that early apoptosis is generally regarded as a shrinkage phenomenon. As was discussed in the previous section, the biological mechanisms responsible for the changes in the ESS signal are currently under study, and our efforts to determine the mechanisms and correlate the underlying biology with extracted size distributions will be the subject of a future publication. Fig. 8Comparison of the average percentage of each size’s contribution to the ESS spectrum for cells treated with DMSO only (blue) and cells treated with staurosporine carried in DMSO (red) at various times post-treatment. The error bars represent the standard error of the mean percentage at each time point. The percentages of the staurosporine-treated cells are significantly different from the DMSO-treated cells at the indicated time points with ; ‡ ; # . (Color online only.) 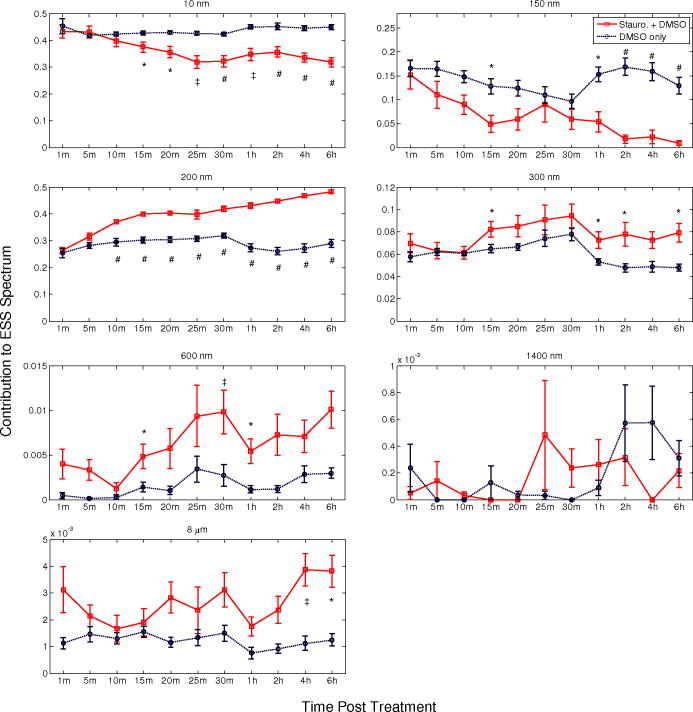 4.Conclusions and Future StudiesWe note that with the current fitting scheme, the resultant distributions are dependent on the assumptions made in providing the possible particle sizes. To achieve optimal quantification during size extraction, the sizes chosen to represent each class of organelle must be optimized. When determining the specific sizes to include, as was discussed in Sec. 2.4, the addition of sizes in the range of mitochondrial lengths did not significantly improve the fits, nor did the addition of sizes in the nuclear range. These analyses suggest that neither mitochondria nor nuclei are primarily responsible for the change in ESS signal in this study, although changes in the ultrastructure of these organelles on a scale of cannot be ruled out. In continuing studies, we plan to explore alternatives and enhancements to the fitting scheme, and to conduct biochemical studies that manipulate specific pathways. The results from the apoptosis time course experiments demonstrate that the method we have implemented for measuring wavelength-dependent elastic scattering from cell cultures in the backward direction is capable of capturing changes in spectra acquired from apoptotic cell cultures relative to control cultures over time, and that changes are seen at time points earlier than observed by any standard assays for apoptosis. The accompanying size extraction algorithm can accurately size particles from scattering phantoms in the size range of interest, and this algorithm has also been applied to the scattering spectra of cell cultures and employed to extract size distributions. These size distributions reveal a decrease in contribution of Rayleigh and scatterers, with a corresponding increase in contribution from scatterers in cells treated to undergo apoptosis. We are currently investigating the biological origins for the difference in scattering signal. To the best of our knowledge, this work represents the first report of the successful use of spectral backscattering measurements to quantitatively monitor apoptosis in vitro. Work continues to develop the method into a reliable quantitative technique. AcknowledgmentsThis work was supported in part by the NIH/National Cancer Institute (U54 CA104677), by the NIH/NIBIB (R21 EB009543), and by the Boston University Photonics Center. ReferencesA. H. Wylie, J. F. R. Kerr, and A. R. Currie,
“Cell death: the significance of apoptosis,”
Int. Rev. Cytol., 68 251
–306
(1980). https://doi.org/10.1016/S0074-7696(08)62312-8 0074-7696 Google Scholar
J. F. R. Kerr, J. Searle, B. V. Harmon, and C. J. Bishop,
“Apoptosis,”
Perspectives on Mammalian Cell Death, 93
–128 Oxford University Press, Oxford, UK
(1987). Google Scholar
J. F. R. Kerr, C. M. Winterford, and B. V. Harmon,
“Apoptosis—its significance in cancer and cancer therapy,”
Cancer, 73 2013
–2026
(1994). https://doi.org/10.1002/1097-0142(19940415)73:8<2013::AID-CNCR2820730802>3.0.CO;2-J 0008-543X Google Scholar
S. W. Lowe and A. W. Lin,
“Apoptosis in cancer,”
Carcinogenesis, 21 485
–495
(2000). https://doi.org/10.1093/carcin/21.3.485 0143-3334 Google Scholar
D. J. Waxman and P. S. Schwartz,
“Harnessing apoptosis for improved anticancer gene therapy,”
Cancer Res., 63 8563
–8572
(2003). 0008-5472 Google Scholar
J. M. Brown and L. D. Attardi,
“The role of apoptosis in cancer development and treatment response,”
Cancer, 5 231
–237
(2005). 0008-543X Google Scholar
M. C. Willingham,
“Cytochemical methods for the detection of apoptosis,”
J. Histochem. Cytochem., 47 1101
–1109
(1999). 0022-1554 Google Scholar
D. R. Green and J. C. Reed,
“Mitochondria and apoptosis,”
Science, 281 1309
–1312
(1998). https://doi.org/10.1126/science.281.5381.1309 0036-8075 Google Scholar
M. G. Vander Heiden, N. S. Chandel, E. K. Williamson, P. T. Schumacker, and C. B. Thompson,
“Bcl- regulates the membrane potential and volume homeostasis of mitochondria,”
Cell, 91 627
–637
(1997). https://doi.org/10.1016/S0092-8674(00)80450-X 0092-8674 Google Scholar
S. Desagher and J. C. Martinou,
“Mitochondria as the central control point of apoptosis,”
Trends Cell Biol., 10 369
–377
(2000). https://doi.org/10.1016/S0962-8924(00)01803-1 0962-8924 Google Scholar
M. Karbowski, and R. J. Youle,
“Dynamics of mitochondrial morphology in healthy cells and during apoptosis,”
Cell Death Differ, 10 870
–880
(2003). https://doi.org/10.1038/sj.cdd.4401260 1350-9047 Google Scholar
S. Cipolat, T. Rudka, D. Hartmann, V. Costa, L. Serneels, K. Craessaerts, K. Metzger, C. Frezza, W. Annaert, L. D’Adamio, C. Derks, T. Dejaegere, L. Pellegrini, R. D’Hooge, L. Scorrano, and B. De Strooper,
“Mitochondrial rhomboid PARL regulates cytochrome c release during apoptosis via OPA1-dependent cristae remodeling,”
Cell, 126
(1), 163
–175
(2006). https://doi.org/10.1016/j.cell.2006.06.021 0092-8674 Google Scholar
L. Scorrano, M. Ashiya, K. Buttle, S. Weiler, S. A. Oakes, C. A. Mannella, and S. J. Korsmeyer,
“A distinct pathway remodels mitochondrial cristae and mobilizes cytochrome c during apoptosis,”
Dev. Cell, 2 55
–67
(2002). https://doi.org/10.1016/S1534-5807(01)00116-2 1534-5807 Google Scholar
M. G. Sun, J. Williams, C. Munoz-Pinedo, G. A. Perkins, J. M. Brown, M. H. Ellisman, D. R. Green, and T. G. Frey,
“Correlated three-dimensional light and electron microscopy reveals transformation of mitochondria during apoptosis,”
Nat. Cell Biol., 9
(9), 1057
–2065
(2007). https://doi.org/10.1038/ncb1630 1465-7392 Google Scholar
D. Suen, K. L. Norris, and R. J. Youle,
“Mitochondrial dynamics and apoptosis,”
Genes Dev., 22 1577
–1590
(2008). https://doi.org/10.1101/gad.1658508 0890-9369 Google Scholar
M. Brauer,
“In vivo monitoring of apoptosis,”
Prog. Neuropsychopharmacol Biol. Psychiatry, 27 323
–331
(2003). https://doi.org/10.1016/S0278-5846(03)00026-5 0278-5846 Google Scholar
P. J. M. Best, D. Hasdai, G. Sangiorgi, R. S. Schwartz, D. R.. Holmes Jr., R. D. Simari, and A. Lerman,
“Apoptosis: basic concepts and implications in coronary artery disease,”
Arterioscler., Thromb., Vasc. Biol., 19 14
–22
(1999). 1079-5642 Google Scholar
A. Saraste, and K. Pulkki,
“Morphologic and biochemical hallmarks of apoptosis,”
Cardiovasc. Res., 45 528
–537
(2000). https://doi.org/10.1016/S0008-6363(99)00384-3 0008-6363 Google Scholar
R. Sgonc, and J. Gruber,
“Apoptosis detection: an overview,”
Exp. Gerontol., 33 525
–533
(1998). https://doi.org/10.1016/S0531-5565(98)00031-X 0531-5565 Google Scholar
B. Freude, T. N. Masters, S. Kostin, F. Robicsek, and J. Schaper,
“Cardiomyocite apoptosis in acute and chronic conditions,”
Basic Res. Cardiol., 93 85
–89
(1998). https://doi.org/10.1007/s003950050066 0300-8428 Google Scholar
M. Watanabe, M. Hitomi, K. van der Wee, F. Rothenberg, S. A. Fisher, R. Zucker, K. K. H. Svoboda, E. C. Goldsmith, K. M. Heiskanen, and A. L. Nieminen,
“The pros and cons of apoptosis assays for use in the study of cells, tissues, and organs,”
Microsc. Microanal., 8 375
–391
(2002). https://doi.org/10.1017/S1431927602010346 1431-9276 Google Scholar
K. J. Donner, K. M. Becker, B. D. Hissong, and S. A. Ahmed,
“Comparison of multiple assays for kinetic detection of apoptosis in thymocytes exposed to dexamethasone or diethylstilbesterol,”
Cytometry, 35 80
–90
(1999). https://doi.org/10.1002/(SICI)1097-0320(19990101)35:1<80::AID-CYTO11>3.0.CO;2-8 0196-4763 Google Scholar
J. D. Keener, K. J. Chalut, J. W. Pyhtila, and A. Wax,
“Application of Mie theory to determine the structure of spheroidal scatterers in biological materials,”
Opt. Lett., 32 1326
–1328
(2007). https://doi.org/10.1364/OL.32.001326 0146-9592 Google Scholar
J. R. Mourant, M. Canpolat, C. Brocker, O. Esponda-Ramos, T. M. Johnson, A. Matanock, K. Stetter, and J. P. Freyer,
“Light scattering from cells: the contribution of the nucleus and the effects of proliferative status,”
J. Biomed. Opt., 5
(2), 131
–137
(2000). https://doi.org/10.1117/1.429979 1083-3668 Google Scholar
J. R. Mourant, J. P. Freyer, A. H. Hielscher, A. A. Eick, D. Shen, and T. M. Johnson,
“Mechanisms of light scattering from biological cells relevant to noninvasive optical-diagnostics,”
Appl. Opt., 37
(16), 3586
–3593
(1998). https://doi.org/10.1364/AO.37.003586 0003-6935 Google Scholar
V. Backman, R. Gurjar, K. Badizadegan, I. Itzkan, R. R. Dasari, L. T. Perelman, and M. S. Feld,
“Polarized light scattering spectroscopy for quantitative measurement of epithelial cellular structures in situ,”
IEEE J. Sel. Top. Quantum Electron., 9
(2), 1019
–1026
(2003). 1077-260X Google Scholar
K. Sokolov, R. Drezek, K. Gossage, and R. Richards-Kortum,
“Reflective spectroscopy with polarized light: is it sensitive to nuclear morphology,”
Opt. Express, 5
(13), 302
–317
(1999). https://doi.org/10.1364/OE.5.000302 1094-4087 Google Scholar
A. Brunsting and P. F. Mullaney,
“Differential light scattering from spherical mammalian cells,”
Biophys. J., 14 439
–453
(1974). https://doi.org/10.1016/S0006-3495(74)85925-4 0006-3495 Google Scholar
H. Fang, M. Ollero, E. Vitkin, L. M. Kimerer, P. B. Cipolloni, M. M. Zaman, S. D. Freedman, I. J. Bigio, I. Itzkan, E. B. Hanlon, and L. T. Perelman,
“Noninvasive sizing of subcellular organelles with light scattering spectroscopy,”
IEEE J. Sel. Top. Quantum Electron., 9
(2), 267
–276
(2003). https://doi.org/10.1109/JSTQE.2003.812515 1077-260X Google Scholar
J. D. Wilson, C. E. Bigelow, D. J. Calkins, and T. H. Foster,
“Light scattering from intact cells reports oxidative-stress-induced mitochondrial swelling,”
Biophys. J., 88 2929
–2938
(2005). https://doi.org/10.1529/biophysj.104.054528 0006-3495 Google Scholar
V. Backman, V. Gopal, M. Kalashnikov, K. Badizadegan, R. Gurjar, A. Wax, I. Georgakoudi, M. Mueller, C. W. Boone, R. R. Dasari, and M. S. Feld,
“Measuring cellular structure at submicrometer scale with light scattering spectroscopy,”
IEEE J. Sel. Top. Quantum Electron., 7
(6), 887
–893
(2001). https://doi.org/10.1109/2944.983289 1077-260X Google Scholar
J. R. Mourant, T. M. Johnson, S. Carpenter, A. Guerra, T. Aida, and J. P. Freyer,
“Polarized angular dependent spectroscopy of epithelial cell nuclei to determine the size scale of scattering structures,”
J. Biomed. Opt., 7
(3), 378
–387
(2002). https://doi.org/10.1117/1.1483317 1083-3668 Google Scholar
J. D. Wilson and T. H. Foster,
“Mie theory interpretations of light scattering from intact cells,”
Opt. Lett., 30
(18), 2442
–2444
(2005). https://doi.org/10.1364/OL.30.002442 0146-9592 Google Scholar
L. T. Perelman, V. Backman, M. Wallace, G. Zonios, R. Manoharan, A. Nusrat, S. Shields, M. Seiler, C. Lima, T. Hamano, I. Itzkan, J. Van Dam, J. M. Crawford, and M. S. Feld,
“Observation of periodic fine structure in reflectance from biological tissue: a new technique for measuring nuclear size distribution,”
Phys. Rev. Lett., 80
(3), 627
–630
(1998). https://doi.org/10.1103/PhysRevLett.80.627 0031-9007 Google Scholar
J. R. Mourant, T. Fuselier, J. Boyer, T. M. Johnson, and I. J. Bigio,
“Predictions and measurements of scattering and absorption over broad wavelength ranges in tissue phantoms,”
Appl. Opt., 36 949
–957
(1997). https://doi.org/10.1364/AO.36.000949 0003-6935 Google Scholar
N. N. Boustany, S. C. Kuo, and N. V. Thakor,
“Optical scatter imaging: subcellular morphometry in situ with Fourier filtering,”
Opt. Lett., 26
(14), 1063
–1065
(2001). https://doi.org/10.1364/OL.26.001063 0146-9592 Google Scholar
N. N. Boustany, Y. C. Tsai, B. Pfister, W. M. Joiner, G. A. Oyler, and N. V. Thakor,
“BCL- dependent light scattering by apoptotic cells,”
Biophys. J., 87 4163
–4171
(2004). https://doi.org/10.1529/biophysj.104.048736 0006-3495 Google Scholar
K. J. Chalut, J. H. Ostrander, M. G. Giacomelli, and A. Wax,
“Light scattering measurements of subcellular structure provide noninvasive early detection of chemotherapy-induced apoptosis,”
Cancer Res., 69
(3), 1199
–1204
(2009). https://doi.org/10.1158/0008-5472.CAN-08-3079 0008-5472 Google Scholar
C. S. Mulvey, A. L. Curtis, S. K. Singh, and I. J. Bigio,
“Elastic scattering spectroscopy as a diagnostic tool for apoptosis in cell cultures,”
IEEE J. Sel. Top. Quantum Electron., 13
(6), 1663
–1670
(2007). https://doi.org/10.1109/JSTQE.2007.910115 1077-260X Google Scholar
A. Dunn, C. Smithpeter, A. J. Welch, and R. Richards-Kortum,
“Finite-difference time-domain simulation of light scattering from single cells,”
J. Biomed. Opt., 2
(3), 262
–266
(1997). https://doi.org/10.1117/12.275219 1083-3668 Google Scholar
P. D. Huibers,
“Models for the wavelength dependence of the index of refraction of water,”
Appl. Opt., 36
(16), 3785
–3787
(1997). https://doi.org/10.1364/AO.36.003785 0003-6935 Google Scholar
“Technical Note—007B,”
(1996) Google Scholar
B. Beauvoit, T. Kitai, and B. Chance,
“Contribution of the mitochondrial compartment to the optical properties of the rat liver: a theoretical and practical approach,”
Biophys. J., 67 2501
–2510
(1994). https://doi.org/10.1016/S0006-3495(94)80740-4 0006-3495 Google Scholar
A. M. Porcelli, A. Ghelli, C. Zanna, P. Valente, S. Ferroni, and M. Rugolo,
“Apoptosis induced by staurosporine in ECV304 cells requires cell shrinkage and upregulation of conductance,”
Cell Death Differ, 11 655
–662
(2004). 1350-9047 Google Scholar
J. D. Robertson, S. Orrenius, and B. Zhivotovsky,
“Review: nuclear events in apoptosis,”
J. Struct. Biol., 129 346
–358
(2000). https://doi.org/10.1006/jsbi.2000.4254 1047-8477 Google Scholar
J. D. Wilson, W. J. Cottrell, and T. H. Foster,
“Index-of-refraction-dependent subcellular light scattering observed with organelle-specific dyes,”
J. Biomed. Opt., 12
(1), 014010
(2007). https://doi.org/10.1117/1.2437765 1083-3668 Google Scholar
|


