
|
|
1.IntroductionMechanical tools such as hand drills and cutting saws have long been used to cut or drill hard tissues for laboratory analysis and for surgical operations, although the use of these tools has significant drawbacks such as high material loss, poor surface evenness, potential fragment contamination, and significant tissue vibration.1 Focused ion beam (FIB) milling has been used for preparation of hard biological tissue specimens for mechanical testing and imaging,2 although the samples must be dehydrated to maintain a high-quality vacuum and mechanical properties may be altered as a result. Laser ablation is an attractive method to overcome the shortcomings of mechanical cutting tools and FIB milling. It is used in biomedical applications because it provides noncontact and precise removal of a variety of sensitive soft and hard tissue in a nonvacuum environment. In this work, we studied machining of bovine bone with a femtosecond pulsed laser. Many different types of lasers with different wavelengths and pulsed output characteristics have been used to machine hard and soft tissues, and the mechanisms and characteristics for tissue removal have been described in previous reports. Vogel and Venugopalan have presented an extensive review of the fundamental mechanisms of pulsed laser ablation of biological tissues.3 Ultrashort pulsed laser ablation of biological tissues and organs was modeled as a plasma-mediated process, and the thermal, mechanical, and chemical effects are summarized. As shown in this work and other investigations (e.g., Ref. 4), the depth of the thermally damaged zone on the remaining surface generally increases with pulse duration. Ultrashort pulsed laser ablation using an has been recently used for soft5, 6, 7, 8 and hard9, 10, 11, 12, 13 tissue ablation. In addition to minimizing the thermal damage of the surrounding tissues, other advantages of the ultrashort laser for tissue ablation include efficiency (small laser energy input per ablated volume of tissue), minimal depth of stress wave propagation due to the short duration of the pressure impulse, and ability to texture a surface with precise spatial control.10 Effects of femtosecond laser irradiation on osseous tissues were studied by Girard 14 Following laser ablation, they immediately stained alkaline phosphatase, a membrane-bound protein present on the surface of osteoblasts as a marker of heat deposition. Microscopy revealed alkaline phosphatase activity in the cells bordering the edge of the cut, confirming that damage during ablation was limited. Since linear scanned ablation is required for cutting and texturing of surfaces, the results of investigators who have studied the effect of damage accumulation in nonbiological materials due to repeated exposure to subablation energy that is inherent in scanned ablation is relevant. Mannion 15 studied the effect of damage accumulation behavior using ultrashort laser pulse irradiation of common metals in air. Furthermore, Gomez and Goenaga16 studied prediction of microchannel widths and depths ablated by focused femtosecond laser beam for polycarbonate (PC) and poly(methyl methacrylate) (PMMA). Choi 17 used incubation analysis similar to that described in this article for analysis of scanned ablation of thin films of conducting oxide. In all cases, ablation width and depth predictions based on analysis of change in material ablation threshold due to damage accumulation showed good correlation to experimental measurements. The structure of bone is hierarchical in nature, and the mineralized tissue that comprises bone has an anisotropy associated with it. The mechanical behavior of bone is governed by this structure.18 Previous studies of other engineering materials—for example, composites—have shown that microscale mechanical testing enables the prediction of macroscopic mechanical behavior.19 Microscale mechanical testing of bone will be used in future research to delineate the microstructural components of bone in an effort to model the aggregate material. Bovine cortical bone micromechanical test specimens (micropillars) will be used in compression testing in an attempt to determine the mechanical behavior of the fundamental components of bone. The structures of interest in this research are micropillars for microscale mechanical testing. Our literature review shows that more research is needed to support the precise creation of three-dimensional (3-D) microscale features on bone surfaces by femtosecond (FS) laser ablation. Precise fabrication of such microscale features requires prediction of ablation dimensions based on material ablation properties and effects of damage accumulation. One objective of this work was the experimental measurement of these properties for bovine cortical bone from single-pulse ablation and linear scanned ablation experiments. Another objective was to formulate a method for calculating the diameter of ablated micropillars and to test its accuracy. We also note that micropillars machined during this phase of the work demonstrated the capability of FS laser ablation to create this type of structure in bovine cortical bone. 2.Materials and Methods2.1.Preparation of Bovine Cortical Bone SampleBone specimens were obtained from the cortical regions of bovine femoral bone. The specimens were sectioned using a diamond saw with water as a lubricant and were wet ground to produce flat parallel surfaces using a successive series of 600-, 800-, and SiC paper so that surface scattering from inhomogeneous tissue could be minimized. The flat and parallel specimens were attached to a glass slide with double-sided tape for femtosecond laser ablation. 2.2.Direct-Write Femtosecond Laser AblationFrequency doubled pulses from a mode-locked erbium-doped fiber laser intensified in a regenerative amplifier laser (CPA2161, Clark-MXR) were used. The maximum output power of the laser was , the pulse duration was , the pulse repetition frequency was , the wavelength was , and the beam diameter was . Laser beam power was adjusted by a series of optics, including thin-film polarizing beamsplitters and half-wave plates. The attenuated laser beam was delivered by a beam mirror train through a mechanical shutter and then focused on the material. A infinity corrected microscope objective lens with numerical aperture (M Plan Apo NIR , Mitutoyo) was used for focusing the femtosecond laser beam. Attenuated laser power was measured by a power meter (PM100, Thorlab) placed after the laser focusing lens. The beam quality was in the horizontal direction and in the horizontal direction. A computer controlled motion system (MX80L, Parker) with a resolution on the , , and axes was used to position the sample and focus optic. In order to find ablation properties of the bovine cortical bone, single-pulse and linear scanned ablation tests were performed on the bone surface at varying pulse energies and scan speeds. Dimensions of the ablated features from these tests were used in calculations described in a prior reference17 and in Sec. 6 to estimate the effective Gaussian beam radius, single-pulse ablation threshold fluence, and incubation coefficient of the bone material. Figure 1 shows a schematic of the ablation pattern used for micropillar fabrication. A focused laser beam was scanned around concentric circular paths, with the innermost pass having a diameter equal to the programmed diameter of the pillar. In this example, -diam micropillars were fabricated by removing the surrounding material in three consecutive layers, each consisting of 45 concentric circular passes. The laser beam focus location was shifted down by for each subsequent layer. Subsequently, various sizes of micropillars were made using different average laser powers and scanning speeds. The diameter and height of micropillars were measured from environmental scanning electron microscope (ESEM) images. The measured diameters at the top surface of the micropillars were compared with the diameters calculated using fluence from paraxial laser beam propagation and the bone ablation threshold and incubation factor measurements. Fig. 1Procedure for fabricating a micropillar by direct-write laser ablation. The innermost pass of each layer had the same programmed diameter, and the laser beam focus was shifted downward by to machine successive layers. The resulting diameter of the top of the pillar was less than the programmed diameter due to the ablation width of the first pass of the first layer and further reductions by the low-fluence pulses irradiating the upper surface of the pillar during machining of the lower layers.  2.3.MicroscopyAn optical microscope (OM; MZ16, Leica) and an environmental scanning electron microscope (ESEM; XL-30, Philips) were used to characterize the ablated bone surface. The specimen was removed from the glass slide after femtosecond laser ablation and attached to an SEM mount with silver conductive paint. The single-pulse and linear scanned ablation and micromachined pillar arrays were imaged with ESEM using a gas secondary electron detector (GSED) and wet mode. This mode replaces the residual gas in the chamber with (g), thereby allowing imaging of hydrated biological specimens. Image analysis software (Image J, NIH) was used to measure the diameter of single-pulse ablation, width of linear scanned microchannel, and diameter of micropillar from the ESEM images. 3.Results3.1.Single-Pulse Ablation on Bovine Cortical BoneTo establish the proper values of pulse energy for ablation of the bovine cortical bone, single-pulse ablation spots at varying pulse energies from were produced by scanning the focused femtosecond laser beam over the surface of the bovine bone; examples are shown in Fig. 2 . Ablated diameters are plotted against pulse energy in Fig. 3a . Effective Gaussian beam radius was found to be from the slope the curve. Next, laser fluence was calculated using the effective laser focus spot diameter and ablation squared diameter versus laser fluence was plotted as shown in Fig. 3b. It has been found that logarithmic plots of femtosecond laser ablation squared diameter versus fluence for metal generally have two slopes, which reflect a change in mechanism at high (“strong” ablation) and low (“gentle” ablation) pulse fluences.15 The same behavior is observed in the cortical bone ablation data in Fig. 3b. The two slopes indicated in the plot extrapolate to strong ablation fluence of and gentle ablation fluence of . The variation in our ablation threshold results is calculated from a curve fit correlation coefficient and is primarily due to inhomogeneity of the bone structure and pulse-to-pulse variation of laser energy and beam mode. Fig. 2ESEM images of single-pulse laser ablation at different pulse energies made on the bovine bone sample, (a) ; (b) ; and (c) .  Fig. 3(a) Squared ablated diameter versus laser pulse energy for single-pulse ablation trials. Effective Gaussian radius was found to be from the slope of the curve. (b) Single-pulse ablation threshold was calculated by extrapolating the ablated diameter2 versus laser fluence curve to zero diameter. Gentle ablation threshold fluence was calculated as , and strong ablation threshold fluence was calculated as . 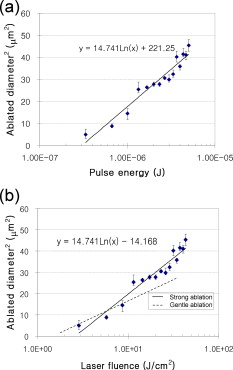 3.2.Scanned Ablation of Bovine BoneScanned ablation at different laser fluences and scanning speeds was conducted on the bovine bone, and ablated microchannel widths were measured. Two different laser fluences ( and ) at scanning speeds varying from were used to create linear microgrooves on the bone specimen. The widths of the microgrooves were measured from ESEM images, with examples shown in Fig. 4 . The widths of microgrooves depicted in Fig. 4 are plotted with respect to scanning speeds in Fig. 5 . At , the average widths ranged from as scanning speed varied from (corresponding to pulse number ) to . The width at the scanning speed of was much larger than the diameter of a single pulse at the same fluence because of incubation due to the larger pulse number. The solid lines in Fig. 5 represent best-fit curves of Eq. 15 for laser fluences of and . The previously determined values of and were used, and an incubation coefficient value of minimized the error of the two curves to the corresponding data. Table 1 compares the ablation threshold for bovine cortical bone as measured in this work with that of other hard tissues such as porcine cortical bone, dentin, and enamel. The incubated gentle ablation threshold fluences are comparable to the incubated ablation threshold fluences for the other materials and are particularly close to the value reported for porcine cortical bone.14 Fig. 4Linear grooves on the bovine bone sample produced by scanned ablation at different speeds and two laser fluences, (a) , (b) . 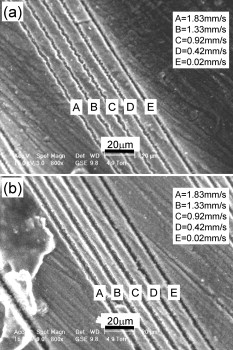 Fig. 5Incubation coefficient, , was found to be by minimizing the error between Eq. 15 and linear scanned ablation channel widths at varying scanning speeds and different laser fluences ( and ). 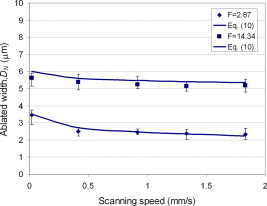 Table 1Comparison of laser ablation threshold fluence measured in this work with that of other hard tissues from the literature. 3.3.Micropillar Fabrication by Direct-Write Femtosecond Laser AblationESEM images of micropillars, which had a programmed diameter of and were fabricated with three layers of pulses, are shown in Figs. 6a and 6b . An optical microscope image of these micropillars is also shown in Fig. 6c. No charring of the bone specimen is observed, similar to previous work.14 After completion of the first, second, and third layers, the average diameter of the top surface of the pillar was measured as , , and . The ablation width for each pass (defined as the difference between the programmed and measured diameters) was , , and . Table 2 also summarizes the different diameters of micropillars fabricated at varying average laser powers and scan speeds. Fig. 6Micropillars with programmed diameter of and height of fabricated on bovine cortical bone. Average laser power of and scanning speed of were used. (a) SEM image of a micropillar array. (b) Magnified SEM image of micropillar. Micropillar diameter was measured as , and height was . (c) Optical microscope image of micropillars. No charring of the bone surface was observed. 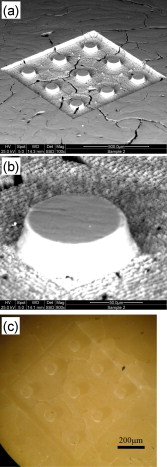 Table 2Comparison of measured and predicted ablation widths for micropillars with programmed diameters ranging from 5μmto100μm .
4.Discussion4.1.Comparison of Experimental and Theoretical Ablation ThresholdsIt is interesting to compare the experimental single-pulse ablation threshold fluence to values predicted from theory. Ablation threshold for dielectrics was previously studied by Gamaly,20 who arrived at an expression for the ablation threshold where is the binding energy, is the ionization potential, is a ratio of skin depth to absorption coefficient, and is the free electron density. Experimental ablation thresholds for dielectric materials such as silica20 and glass21 are reported to be reasonably approximated by this expression. Cortical bone22 is composed of 70% inorganic material and 30% proteins. The inorganic phase of cortical bone consists mostly of hydroxyapatite (HA), . Based on other work, the average atomic number density23 was used for the free electron density. Since binding energy and ionization potential for bovine cortical bone are not available from the literature, it has been assumed that the average binding energy is and the average ionization potential for bone sample is , typical values for dielectrics.23 The ratio of was estimated as ( at ) because the absorption in the ionized dielectric occurs in a skin layer.20 For and for the current laser system, the free electron density for HA was calculated based on the general solution of the time dependence of the number of the free electron density defined by the rate equation.20, 24 The calculated free electron density is at the intensity of . This intensity is in the range where femtosecond pulses fully ionize a semiconductor target.20 An ablation threshold fluence was calculated as , which is similar to the value of the single-pulse laser threshold fluence of measured for the bovine cortical bone. Based on Eq. 1, unknown parameters for complex materials, such as the sum of the binding energy and ionization potential, can be practically obtained from the experimentally measured ablation threshold.4.2.Comparison of Circular and Straight-Line Scanned AblationIt is interesting to compare the pulse numbers predicted by Eq. 11 to straight-line values17 predicted using equal to measured laser focus spot diameter and equal to scan speed. Using the measured focus spot radius of and scanning speed of , the maximum pulse numbers calculated from Eq. 11 for various programmed radii are shown in Fig. 7 . For example, when machining around a programmed diameter of with a pulse radius of , the maximum pulse number is 25.87 versus a straight line value of 24.46. Since ablation threshold is not a very sensitive function of pulse number [see Eq. 9], there was no significant increase of the incubated ablation threshold. The ablation threshold for circular scanning was , while the linear scanning was , both using . The plot in Fig. 7 shows that the maximum pulse number for circular scanning converges to that for the linear scanning case as the radius increases. For the micropillar radiuses used in this work, it is reasonable to use the pulse number calculated for linear scanning to calculate incubated ablation threshold. Fig. 7Maximum pulse number for circular scanning compared to linear scanning with focus spot radius of and various pillar radii. For the smallest pillar diameter used in this work, the maximum pulse number predicted by circular scanning analysis was only slightly (1.25%) larger than that predicted by linear scanning.  4.3.Comparison of Experimental and Calculated Pillar DiametersUsing the ablation relationships and material property measurements summarized earlier, it is possible to predict the pillar top diameters produced by given ablation process settings. For a scanning speed of , the number of pulses applied to a single location along the scan is . Using and , the corresponding incubated ablation threshold fluence is calculated to be . The smaller ablation threshold implies that the channel width for scanned ablation is larger than the diameter of a single ablation spot. When the laser beam focus was shifted down in a positive direction for machining of second and third layers, the defocused laser fluence applied to the top surface of the pillar resulted in further ablation. The fluence for a Gaussian beam that propagates along the axis can be written as25 where is the laser pulse energy, and is the radius of the beam at the axial distance from the minimum focus location. The paraxial approximation, valid for , is used to simplify the dependence of the fluence on the axial distance . It is expressed aswhere is numerical aperture of the lens, is index of refraction, and is the radius of a diffraction-limited spot at the focus of a Gaussian beam. Experience has shown that predictions of ablation size are best done using the “effective” beam focus spot size calculated from the single-pulse ablation data according to Eq. 8. Thus, the laser beam radius obtained in this manner was used in calculations to predict the extent of ablation of the top surface of the bone sample. Figure 8a shows the Gaussian diameter of laser beam propagation in air near the minimum focus of . At a distance of from the focus, the beam radius was almost , and the fluence was about one-tenth of the fluence at the focus. Figure 8b shows the plot of fluence in longitudinal and radial directions with and an average laser power of (parameters used to fabricate the micropillars).Fig. 8Analysis of laser beam propagating in air in the direction by paraxial approximation; (a) laser beam radius: (b) laser beam fluence distribution in radial and longitudinal directions at average laser power of . Beam focus spot radius calculated from the slope of single-pulse ablation experiments was used in this calculation. 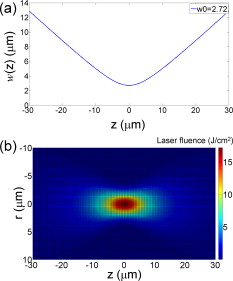 To calculate ablation of the top of the pillar by successive layers of laser pulses, threshold fluence was decreased according to the power-law relationship shown in Eq. 6, with pulse number for each layer. Figure 9 shows laser fluence distribution in the radial direction at the top surface of the bone sample for the first, second, and third passes. The peak fluences for the first and second layers were larger than , so the strong ablation threshold was used to calculate incubated laser fluence. The incubated threshold fluence for the first layer was and that of the second layer was . For the third layer, the gentle ablation threshold was incubated with the same coefficient used for the strong ablation pulses, resulting in a third-pass threshold of . It is noted that prior research has shown that incubation coefficients are the same for strong and gentle ablation thresholds for a metal material.26 For analysis of ablation results, it is convenient to define ablation width as the difference in programmed and measured pillar diameter. The predicted ablation widths are compared with the experimental ablation width for each pass in Fig. 10 . Error between predicted and experimental ablation widths is within about for each pass. Fig. 9Laser fluence distribution in radial direction at (top surface of pillar) with , . For the first pass , second pass , and third pass , the peak fluences are , 5.1, and . The incubated ablation threshold for each pass was calculated by Eq. 9 at scanning speed of (corresponding to ) and . For the first, second, and third passes, each incubated ablation threshold fluence is , , and . 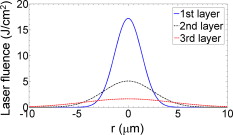 Fig. 10Comparison of calculated and measured ablation width (programmed diameter minus the diameter of the top surface of the pillar) for successive layers. Predicted ablation width was well-matched with the measurements. 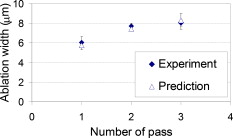 Figure 11 shows smaller micropillars with programmed diameter of and measured average diameter of . Machining of these tall pillars required nine layers of pulses at an average laser power of and scanning speed of . The final diameter of the top of the pillar was measured to be , corresponding to an ablation width of . Using the procedure outlined earlier, the width was predicted to be . Still smaller micropillars with programmed diameters of and were also machined and predicted, and measured ablation width results are summarized in Table 2. Error between predicted and experimental final ablation widths is within about . 5.ConclusionIn summary, single-pulse ablation and linear scanned ablation tests were conducted on a bovine cortical bone sample. The single-pulse ablation threshold was measured from single-pulse ablation features, and the incubation coefficient was measured from the width of grooves machined by scanned ablation. Calculations showed that the measured value of the single-pulse strong ablation threshold was comparable to estimates from an analytical model ablation model based on molecular binding energies and heat capacity. Micropillars were fabricated by applying multiple layers of concentric rings of circular femtosecond laser ablation scan passes. No oxidation of the bone was observed for femtosecond laser machining, unlike results with nanosecond laser pulses. The width of the top surface of the pillar was measured after each layer of pulses was also calculated based on pulse fluence from a paraxial focus calculation, ablation threshold fluence, and incubation factor for the bone sample. The calculated pillar diameters were well-matched to measurements, confirming that femtosecond laser ablation is a practical, predictable means for precision structuring of bone surfaces. AppendicesAppendix AThe ablation threshold fluence of the bone material was calculated from the diameters of single-pulse ablation spots made at varying pulse energies. The analysis is based on an assumption that a pulse with Gaussian radial fluence profile and with peak fluence greater than an ablation threshold value of will ablate material within a radius where the pulse fluence equals or exceeds the ablation threshold value. The radius at which the laser beam fluence equals the ablation threshold fluence can be found from the expression for Gaussian fluence distribution: where is the Gaussian beam radius, and is the peak fluence, related to pulse energy bySimilarly, threshold fluence and energy are related bywhere is the pulse energy corresponding to ablation threshold fluence. Rearranging Eq. 4 to solve for the diameter of the area near the center of the beam from which material is removed provides the relation:Experimentally, single-pulse ablation spots with measured diameter are produced by varying pulse energy over a range of values while focus spot radius is maintained at a fixed value. A semilogarithmic plot of versus is created, and the ablation threshold fluence is found by extrapolating the linear curve resulting from this plot to zero diameter where . An effective focus spot radius for the experiment can be calculated directly from the ablation data, since calculated focus spot sizes are subject to inaccuracy.27 Using Eqs. 5, 6 in Eq. 7 yieldsThus, the effective radius of the laser focus spot needed for fluence calculations in Eqs. 5, 6 can be calculated from the slope of a plot of experimental ablation diameter-squared versus pulse energy data.Appendix B: Scanned Ablation Around a Circular PathWhen numerous laser pulses are applied to the same surface location (number of pulses is greater than 1), ablation occurs for pulse energy less than that corresponding to the ablation threshold fluence for (single pulse). This effect, termed incubation,28 is attributed to accumulation of damage or defects from individual pulses. The effect of incubation of pulses of the same energy on ablation threshold is often quantified by a power-law relationship of the form where is number of pulses, and is the incubation coefficient.It is necessary to consider the pulse overlap distance when applying incubation analysis to scanned ablation experiments. Incubation analysis for linear scanning has been reported in prior work.17 In the present experiments, we consider the geometry associated with scanning a laser focus spot of radius and pulse repetition frequency around a circular path of radius with scanning speed , illustrated in Fig. 12 . For given circular locus displaced from the scanning path by distance , the length of the circular arc spanning a focus spot for a given pulse is , and the scan distance between successive laser pulses is . Analogous to the linear scanning case, the definition of overlap for this geometry is and the number of pulses laser incident on a point lying on the locus isThe angle defined in Fig. 2 is calculated by laws of cosines asThe distance and speed needed to compute overlap and pulse number areandIt is noted that the maximum overlap of successive pulses occurs on a circular locus with smaller diameter than the programmed diameter and is slightly larger than the straight line overlap value calculated with constant laser focus spot diameter and scanning speed .Fig. 12Geometry associated with scanning a laser focus spot with radius around a circular path of radius at a scan speed . The overlap between the areas irradiated by successive laser pulses (suggested by the solid and dashed circles) is related to the incubation of damage caused by application of energy from numerous pulses to the same point. Based on the geometry, the number of pulses incident on a point lying on a circular arc with spacing from the scan path was calculated and compared with the linear scanning case.  Ablated channel width for scanned ablation with pulse number can be calculated by combining Eqs. 7, 9: Furthermore, Eq. 11 can be substituted into Eq. 15, resulting inIf the channel width is known from measurements, Eq. 16 can be used to solve for an unknown parameter such as incubation coefficient.AcknowledgmentsThis article is based on work supported by the National Science Foundation under Grant No. EEC-0425626. Cortical bone samples were prepared and provided by Elise Morgan at Boston University. ReferencesY. M. Lee, R. Y. Tu, A. C. Chiang, and Y. C. Huang,
“Average-power mediated ultrafast laser osteotomy using a mode-locked Nd: YVO4 laser oscillator,”
J. Biomed. Opt., 12
(6), 060505
(2007). https://doi.org/10.1117/1.2821149 1083-3668 Google Scholar
Y. L. Chan, A. H. W. Ngan, and N. M. King,
“Use of focused ion beam milling for investigating the mechanical properties of biological tissues: a study of human primary molars,”
J. Mech. Behav. Biomed. Mater., 2
(4), 375
–383
(2009). https://doi.org/10.1016/j.jmbbm.2009.01.006 1751-6161 Google Scholar
A. Vogel and V. Venugopalan,
“Mechanisms of pulsed laser ablation of biological tissues,”
Chem. Rev. (Washington, D.C.), 103
(2), 577
–644
(2003). https://doi.org/10.1126/science.301.5633.577a 0009-2665 Google Scholar
A. M. A. Arrastia, P. Wildersmith, and M. W. Berns,
“Thermal effects of -laser on the pulpal chamber and enamel of human primary teeth: an in vitro investigation,”
Lasers Surg. Med., 16
(4), 343
–350
(1995). https://doi.org/10.1002/lsm.1900160405 0196-8092 Google Scholar
A. A. Oraevsky, L. B. DaSilva, A. M. Rubenchik, M. D. Feit, M. E. Glinsky, M. D. Perry, B. M. Mammini, W. Small, and B. C. Stuart,
“Plasma mediated ablation of biological tissues with nanosecond-to-femtosecond laser pulses: relative role of linear and nonlinear absorption,”
IEEE J. Sel. Top. Quantum Electron., 2
(4), 801
–809
(1996). https://doi.org/10.1109/2944.577302 1077-260X Google Scholar
F. H. Loesel, J. P. Fischer, M. H. Gotz, C. Horvath, T. Juhasz, F. Noack, N. Suhm, and J. F. Bille,
“Non-thermal ablation of neural tissue with femtosecond laser pulses,”
Appl. Phys. B: Lasers Opt., 66
(1), 121
–128
(1998). https://doi.org/10.1007/s003400050365 0946-2171 Google Scholar
T. Juhasz, H. Frieder, R. M. Kurtz, C. Horvath, J. F. Bille, and G. Mourou,
“Corneal refractive surgery with femtosecond lasers,”
IEEE J. Sel. Top. Quantum Electron., 5
(4), 902
–910
(1999). https://doi.org/10.1109/2944.796309 1077-260X Google Scholar
Z. S. Sacks, R. M. Kurtz, T. Juhasz, and G. A. Moura,
“High precision subsurface photodisruption in human sclera,”
J. Biomed. Opt., 7
(3), 442
–450
(2002). https://doi.org/10.1117/1.1482381 1083-3668 Google Scholar
J. Serbin, T. Bauer, C. Fallnich, A. Kasenbacher, and W. H. Arnold,
“Femtosecond lasers as novel tool in dental surgery,”
Appl. Surf. Sci., 197 737
–740
(2002). https://doi.org/10.1016/S0169-4332(02)00402-6 0169-4332 Google Scholar
B. Schwab, D. Hagner, J. Bornemann, and R. Heermann,
“The use of femtosecond technology in otosurgery,”
Femtosec. Technol. Tech. Med. Appli., 96 211
–226
(2004). Google Scholar
W. B. Armstrong, J. A. Neev, L. B. Da Silva, A. M. Rubenchik, and B. C. Stuart,
“Ultrashort pulse laser ossicular ablation and stapedotomy in cadaveric bone,”
Lasers Surg. Med., 30
(3), 216
–220
(2002). https://doi.org/10.1002/lsm.10034 0196-8092 Google Scholar
M. H. Niemz, A. Kasenbacher, M. Strassl, A. Backer, A. Beyertt, D. Nickel, and A. Giesen,
“Tooth ablation using a CPA-free thin disk femtosecond laser system,”
Appl. Phys. B: Lasers Opt., 79
(3), 269
–271
(2004). 0946-2171 Google Scholar
J. Neev, L. B. DaSilva, M. D. Feit, M. D. Perry, A. M. Rubenchik, and B. C. Stuart,
“Ultrashort pulse lasers for hard tissue ablation,”
IEEE J. Sel. Top. Quantum Electron., 2
(4), 790
–800
(1996). https://doi.org/10.1109/2944.577301 1077-260X Google Scholar
B. Girard, D. Yu, M. R. Armstrong, B. C. Wilson, C. M. L. Clokie, and R. J. D. Miller,
“Effects of femtosecond laser irradiation on osseous tissues,”
Lasers Surg. Med., 39
(3), 273
–285
(2007). https://doi.org/10.1002/lsm.20466 0196-8092 Google Scholar
P. T. Mannion, J. Magee, E. Coyne, G. M. O’Connor, and T. J. Glynn,
“The effect of damage accumulation behavior on ablation thresholds and damage morphology in ultrashort laser micro-machining of common metals in air,”
Appl. Surf. Sci., 233
(1–4), 275
–287
(2004). https://doi.org/10.1016/j.apsusc.2004.03.229 0169-4332 Google Scholar
D. Gomez and I. Goenaga,
“On the incubation effect on two thermoplastics when irradiated with ultrashort laser pulses: broadening effects when machining microchannels,”
Appl. Surf. Sci., 253
(4), 2230
–2236
(2006). https://doi.org/10.1016/j.apsusc.2006.04.036 0169-4332 Google Scholar
H. W. Choi, D. F. Farson, J. Bovatsek, A. Arai, and D. Ashkenasi,
“Direct-write patterning of indium-tin-oxide film by high pulse repetition frequency femtosecond laser ablation,”
Appl. Opt., 46
(23), 5792
–5799
(2007). https://doi.org/10.1364/AO.46.005792 0003-6935 Google Scholar
C. H. Turner, A. Chandran, and R. M. V. Pidaparti,
“The anisotropy of osteonal bone and its ultrastructural implications,”
Bone, 17
(1), 85
–89
(1995). https://doi.org/10.1016/8756-3282(95)00148-7 Google Scholar
C. H. Zhou, L. S. Schadler, and I. J. Beyerlein,
“Time-dependent micromechanical behavior in graphite/epoxy composites under constant load: a combined experimental and theoretical study,”
Acta Mater., 50
(2), 365
–377
(2002). https://doi.org/10.1016/S1359-6454(01)00353-6 1359-6454 Google Scholar
E. G. Gamaly, A. V. Rode, B. Luther-Davis, and V. T. Tikhonchuk,
“Ablation of solids by femtosecond lasers: ablation mechanism and ablation thresholds for metals and dielectrics,”
Phys. Plasmas, 9
(3), 949
–957
(2002). https://doi.org/10.1063/1.1447555 1070-664X Google Scholar
K. R. Kim, J. H. Kim, D. F. Farson, H. W. Choi, and K. H. Kim,
“Hybrid laser cutting for flat panel display glass,”
Jpn. J. Appl. Phys., 47
(8), 6978
–6981
(2008). https://doi.org/10.1143/JJAP.47.6978 0021-4922 Google Scholar
B. Ivanov, A. M. Hakimian, G. M. Peavy, R. F. Haglund Jr.,
“Mid-infrared laser ablation of a hard biocomposite material: mechanistic studies of pulse duration and interface effects,”
Appl. Surf. Sci., 208 77
–84
(2003). https://doi.org/10.1016/S0169-4332(02)01339-9 0169-4332 Google Scholar
A. V. Rode, E. G. Gamaly, B. Luther-Davies, B. T. Taylor, J. Dawes, A. Chan, R. M. Lowe, and P. Hannaford,
“Subpicosecond laser ablation of dental enamel,”
J. Appl. Phys., 92
(4), 2153
–2158
(2002). https://doi.org/10.1063/1.1495896 0021-8979 Google Scholar
M. D. Perry, B. C. Stuart, P. S. Banks, M. D. Feit, V. Yanovsky, and A. M. Rubenchik,
“Ultrashort-pulse laser machining of dielectric materials,”
J. Appl. Phys., 85
(9), 6803
–6810
(1999). https://doi.org/10.1063/1.370197 0021-8979 Google Scholar
A. Yariv, Optical Electronics, 3rd ed.Holt, Rinehart and Wilson, New York
(1985). Google Scholar
N. Uppal and P. S. Shiakolas,
“Micromachining characteristics of NiTi based shape memory alloy using femtosecond laser,”
J. Manuf. Sci. Eng., 130
(3), 031117
(2008). https://doi.org/10.1115/1.2936380 1087-1357 Google Scholar
A. Ben-Yakar and R. L. Byer,
“Femtosecond laser ablation properties of borosilicate glass,”
J. Appl. Phys., 96
(9), 5316
–5323
(2004). https://doi.org/10.1063/1.1787145 0021-8979 Google Scholar
D. Ashkenasi, M. Lorenz, R. Stoian, and A. Rosenfeld,
“Surface damage threshold and structuring of dielectrics using femtosecond laser pulses: the role of incubation,”
Appl. Surf. Sci., 150
(1–4), 101
–106
(1999). https://doi.org/10.1016/S0169-4332(99)00228-7 0169-4332 Google Scholar
|


