|
|
1.IntroductionAssessment of healing in chronic wounds is gaining importance as new and expensive wound treatments are brought to market. A wide variety of chronic wound treatments such as topical growth factors, bioengineered skin equivalents, negative pressure wound therapy, and hyperbaric oxygen therapy are commercially available, and clinical studies of these products have shown some evidence of improved healing compared to standard of care.1 However, the effectiveness of each treatment is not the same in all patients, thus rapid and accurate evaluation of the healing progress in each individual is critical so that unsuccessful treatments can be discontinued and alternate treatments initiated as soon as possible.2 Reliable methods of evaluating wound healing would benefit wound clinics by reducing the duration and cost of treatment, and the wound research community in the evaluation of clinical trials. The main limitation of traditional wound evaluations is that they can give information mostly from the surface of the wound. Such surface characteristics of a wound do not take into account the health of the wound environment beneath the surface in the whole wound bed, and provide inadequate information regarding the wound healing status of a wound. Therefore, misdiagnosis may occur or treatment may not be altered as early as possible, with direct implications on the quality and cost of care for chronic wounds.3, 4 For example, image analysis of wound pictures for color or texture pertains strictly to surface information, and optical methods such as diffuse reflectance spectroscopy (DRS) or optical coherence tomography (OCT) can penetrate to only approximately .5, 6 Noninvasive analysis of the full depth of the chronic wound bed could provide the clinician with a more complete picture of wound health, allowing better prediction of wound closure and wound recurrence than can be achieved by surface measurements alone. Several human studies have been conducted in an attempt to noninvasively characterize tissue beneath the surface of chronic wounds. High frequency ultrasound (HFUS) at frequencies in the range of permits high resolution (microscopic-level) imaging of skin at depths of up to . Greater penetration depth can be achieved by using ultrasound at more traditional frequencies in the range of ; however, imaging resolution worsens at lower frequencies. A preliminary study showed that HFUS could be used to image structural features beneath the surface of human chronic wounds and qualitative comparisons were made with healthy skin.7 HFUS was used to measure skin thickness in several types of human chronic wounds (diabetic, venous, and pressure ulcers),8 and a later study demonstrated the use of HFUS to calculate the width and depth of small acute wounds that were created experimentally in human subjects,9 but it is unclear how this method would translate to chronic wounds that are very different in shape, size, and that have more ambiguous boundaries than acute wounds. Optical methods on the other hand allow metabolic characterization of tissue at various depths. Optical coherence tomography (OCT) is a noninvasive imaging modality that uses low coherence interferometry to create high resolution cross sectional images of structural features in human skin at depths of up to .5 This method has not yet been used to image human wounds, but structures visible in OCT images of experimentally created animal wounds have been qualitatively correlated to histological micrographs of the same wounds, and an automated imaging algorithm was developed to calculate the size of these acute animal wounds.10 In another animal study, polarization-sensitive OCT was used to monitor temporal changes in collagen birefringence during healing, and measurements of birefringence were shown to be greater in chemically accelerated wound healing as compared to chemically impaired healing.11 As with HFUS, the clinical utility of OCT as a wound monitoring methodology is uncertain due to the size and complexity of human chronic wounds. Laser Doppler flowmetry (LDF) and its modified methodology of laser Doppler imaging (LDI) are optical methods that rely on frequency shifts of an incident light beam (typically a laser in the near-infrared wavelength range) to determine a quantitative index that is related to the average velocity and number of red blood cells within a tissue volume.12 Some researchers have used LDF and LDI to quantify relative values of cutaneous blood flow in human chronic wounds.8, 13 These studies identified regions of increased blood flow within chronic wounds that may correlate to granulation tissue; however, in these studies, changes in blood flow were not monitored over time. A study was published in 2005 by Mlacak 14 that compared changes in LDF measurements before and after healing in venous leg ulcers. While the ulcers showed increased blood flow relative to nonwound tissue, no difference was observed between measurements performed before and after healing.14 The clinical utility of LDF and LDI for serial assessment of chronic wounds is limited due to low penetration depths and issues with light reflection caused by curvature of the feet and presence of moisture on the surface of the wound.12 Diffuse reflectance (or remittance) spectroscopy (DRS) is an optical method that uses light at visible and near-infrared wavelengths to measure hemoglobin concentration and oxygenation of blood in superficial capillaries to depths of approximately . DRS spectra from chronic leg ulcers (both venous and arterial) have been empirically correlated to qualitative wound scores assessed by physicians,15 and changes in DRS spectra related to hemoglobin concentration were observed before and after biodebridement of chronic foot and leg ulcers of mixed etiology.16 In another study, oxygen saturation (calculated from spectra obtained at wavelengths of ) was measured periodically in diabetic foot ulcers over a period of . In those ulcers that were healed by the end of the study, characteristic decreases in oxygen saturation were observed over the course of healing, while no such changes in oxygen saturation were observed in the nonhealing wounds.17 DRS has also been used to predict arterial insufficiency in skin flaps,18 and to predict healing outcome in human burns.19 Changes of the surface appearance due to bleeding and other reasons will significantly affect the capability of DRS to provide (on its own) information about the wound status and oxygenation. Diffuse photon density wave (DPDW) methodology of near-infrared spectroscopy can be used to characterize the status of a healing wound, because it can quantify vascularization of tissue at depths of up to several centimeters. These depths are made possible by the use of light at near-infrared wavelengths ranging from , where optical absorption in tissue is minimal when compared to other wavelengths.20 We have previously demonstrated that changes in optical properties in an animal model of acute wounds could be quantified using the DPDW methodology, and that these changes corresponded to changes in wound vascularization. In this study, we report the results of a pilot human study in which chronic diabetic foot ulcers were monitored over the course of several weeks using this methodology. Tissue optical changes measured by DPDW over time reflect changes beneath the surface of a wound, and may provide clinicians with valuable information to supplement traditional wound assessment methodologies. 2.Materials and Methods2.1.Near-Infrared InstrumentationDetails of the frequency domain near-infrared instrument have been described previously.21, 22 Briefly, an optical fiber was used to deliver intensity modulated light to the tissue from three diode lasers ( , 780, and ). Four optical fiber bundles were used to deliver backscattered light from the tissue to avalanche photodiode (APD) detectors and quadrature (I/Q) demodulators. The in-phase and quadrature signals from each detector were measured; these were determined by the attenuated amplitude and phase shift of the registered scattered light. All optical fibers were immobilized on a Teflon probe, with the four detector fibers fixed at distances of 4, 8, 12, and from the source fiber. It is possible to calculate the absorption coefficient and reduced scattering coefficient of tissue from the amplitude and phase shift of scattered NIR light using the diffusion approximation if the minimum distance between source and detector fibers in the probe is greater than two transport lengths.23, 24 The transport length represents the distance of propagation of a collimated beam of light before it becomes effectively isotropic, and can be approximated by when , as is the case in tissue. The photons undergo multiple light scattering in tissue, which is a strong nonhomogeneous medium, because the various tissue structures are characterized by large differences in their refractive index. For a typical tissue with an anisotropy factor of about 0.80 to 0.95, where is mean angle of scattering, a scattering event happens every and light becomes completely diffuse after one transport length. Values of in human tissue at wavelengths of typically range from ,20 therefore the transport length ranges from approximately , since is the inverse of the reduced scattering coefficient . This suggests that the smallest source-detector distance that can be used in probe design for the diffusion approximation to be valid would be . Our probe has a minimum distance between source and detector fibers of , and therefore is within the diffusion approximation regime. Closed analytical solutions to the diffusion equation have been derived for semi-infinite measurement geometries that are typical of noninvasive tissue measurements,25 when sources and detectors are placed on an air-tissue interface and the optical fiber source is modeled as an isotropic point light source. The final equations describing the absorption and scattering coefficients from measurements of light intensity and phase shift as a function of the source-detector separation distance are included in Ref. 21. The human study lasted for more than a year and it was therefore necessary to test the stability of our device during the course of such measurements. To accomplish this, an optical phantom made of silicone (XP565, Silicones, Incorporated, High Point, North Carolina) with dispersed particles of (diameter , Alfa Aesar, Ward Hill, Massachusetts) to act as scatterers and carbon black acetylene microspheres (50% compressed, diameter , Alfa Aesar) to absorb light22 was measured before each patient measurement session. The measured absorption coefficients from the silicone phantom over the course of are shown in Fig. 1 . Standard error remained at less than 3% throughout the period of the study. Fig. 1Measured values of in a silicone optical phantom over a period. Solid lines represent average values for the entire measurement period. Average values of at 685, 780, and were , , and , respectively.  Oxyhemoglobin concentration and deoxyhemoglobin concentration ([Hb]) were determined using the method described by Shah 26 When it is assumed that oxyhemoglobin, deoxyhemoglobin, and water are the primary chromophores at our selected wavelengths, Eq. 1 can be used to describe the relationship between measured values of absorption coefficient and the concentrations of hemoglobin and water: where and are the molar extinction coefficients of deoxy- and oxyhemoglobin at each wavelength ( , 780, and ) as published in Prahl,27 is the absorption coefficient of pure water at each wavelength as published in Hale and Querry 1973,28 and the concentration of water was assumed constant at 70%. The choice of a value for has little effect on the calculated values of hemoglobin concentration because of the low absorption of water relative to hemoglobin at wavelengths in the range .29Values of and [Hb] were derived from the experimental values of through a least-squares fitting method. Specifically, the values of and [Hb] are used as fitting parameters to minimize the following expression: Total hemoglobin concentration [Tot Hb] was calculated as the sum of [Hb] and .2.2.Human Subjects11 subjects with diabetes and chronic wounds were recruited from the Drexel University Wound Healing Center in Philadelphia, Pennsylvania. All patients were between 18 and of age, had documented diabetes mellitus for at least , and had an ankle or foot wound with a minimum surface area of that was secondary to the complications of diabetes, including vascular disease and/or neuropathy. All patients received standard wound care, which included weekly or biweekly debridement, treatment with moist wound healing protocols, and offloading when appropriate. In some patients, active wound healing agents such as topical growth factors, hyperbaric oxygen, and bioengineered skin substitutes were employed. Details about the size of each wound, duration of measurements, and the active treatments used on each wound are shown in Table 1 . Table 1Size, duration, and active treatments used on each wound.
Of the 11 wounds enrolled in the study, five wounds healed completely in less than , three wounds resulted in amputation, and three wounds remained unhealed at the end of the study, as shown in Table 1. Four of the five healed wounds required no surgical intervention prior to closure, while one wound underwent surgical debridement and the application of a bioengineered skin substitute (Apligraf®, Organogenesis, Incorporated, Canton, Massachusetts) after of participation in the study, and reached closure after an additional . Data obtained prior to surgical intervention were classified as a nonhealing wound, while data obtained after surgery were classified as a healing wound, bringing the total number of wounds to 12 (five healing and seven nonhealing). All diffuse NIR measurements were conducted prior to wound debridement on a weekly or biweekly basis. During each measurement session, the wounds of each patient were interrogated using the NIR instrument in up to ten different locations. Measurement locations were chosen based on the geometry and size of each wound, and can be classified into four general locations: 1. directly on the wound, 2. on intact skin at the edge of the wound, 3. on nonwound tissue of the contralateral limb symmetric to the wound location if available, and 4. on nonwound tissue on the ipsilateral limb at a distance of at least from the wound. The measurement locations for a typical diabetic foot ulcer are shown in Fig. 2 . The NIR device was configured to complete one measurement in approximately , and at all measurement locations the probe was held in continuous contact with the wound or skin tissue until eight to ten successive measurements were obtained over a period of approximately . The means and standard deviations of the detected amplitudes and phase shifts were computed at each measurement location, and measurements were discarded and repeated if the percent deviation was greater than 15% over the course of each measurement period. This was done to eliminate errors caused by motion artifacts from the patient or clinician. Further validation was performed to ensure that uniform contact was made between each detector fiber and the wound or skin. We fit the experimentally measured amplitude and phase to the analytical solution of the diffusion approximation for semi-infinite geometry, where the and the phase show a linear dependence on ( is the distance between source and detector, and is the intensity of scattered light registered by the detector). Measurements that did not exhibit good fitting were likely to have had nonuniform fiber/tissue contact and were discarded. Tegaderm transparent sterile dressing (3M Health Care, Saint Paul, Minnesota) was used to cover the fiber optic probe during all measurements. Our previous experience/results suggest that the presence of Tegaderm does not affect the measured NIR coefficients.21 Fig. 2(a) Diagram of the positions at which NIR measurements were obtained from a representative subject. The dark oval on the heel represents a typical diabetic foot ulcer. Gray rectangles represent the eight different probe locations used during a measurement session. (b) Photograph of the probe (coin included for size reference). The fiber on the left delivers light from the lasers to the tissue, while the remaining four fibers deliver back-scattered light from the tissue to the photodetectors. Fibers are spaced equidistantly at apart. The dimensions of the Teflon probe are . 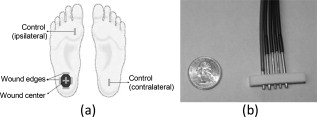 Wounds were digitally photographed using a Fujifilm Finepix s700 digital camera during each measurement session with cross-polarizing filters to reduce surface reflection. A ruler was held in the imaging plane of each photograph to allow the calculation of absolute wound area. The boundaries of each wound were manually traced using a computer mouse and Microsoft Paint software, and then wound areas were calculated from the traced photographs using an image analysis code developed with Matlab (Mathworks, Incorporated, Natick, Massachusetts) software. This image analysis code counts the number of pixels within the traced wound boundary, and then calculates the wound area by approximating the size of each pixel from the image of the ruler that was present in the imaging plane of each wound. 3.Results3.1.Results from Diabetic Foot UlcersIn both healing and nonhealing wounds, values of the NIR absorption coefficient and calculated values of and [Tot Hb] concentration according to Eq. 1 were obtained at the wound center, the wound edges, and control sites. All parameters had higher values for the wounds as compared to the control (nonwound) sites. In all healing wounds, the values of and [Tot Hb] at the wound center and edge sites decreased and converged to the values measured at the control sites. This is illustrated in Fig. 3, which shows plots of hemoglobin concentrations during the course of the study for a typical healing wound. The area of this wound was over at the beginning of the study, and closed after ten weeks of monitoring. Fig. 3Wound size and hemoglobin data for a representative healed wound that was located on the frontal region of a foot that had previously lost all toes to amputation. Upper left: digital photographs from selected time points. Scale bars represent . Upper right: wound area as determined through analysis of digital photographs (◆). Lower: oxyhemoglobin concentration , deoxyhemoglobin concentration [Hb], and total hemoglobin concentration [Tot Hb] from each measurement day. Each data point represents the mean of measurements obtained from the center of the wound (●), the edges of the wound (△), a control site on the wounded foot (+), and a control site on the nonwounded foot (x). 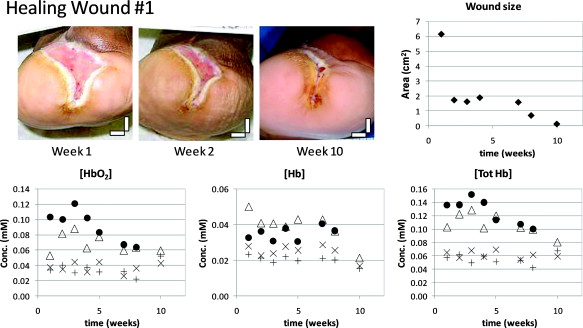 In contrast, values of and [Tot Hb] in all nonhealing wounds remained greater than the control sites and did not converge over the course of the study. This is illustrated in Fig. 4, which shows plots of hemoglobin concentrations for a typical nonhealing wound. The area of this wound decreased by only approximately 50% over the course of , after which a below-the-knee amputation was performed. Fig. 4Wound size and hemoglobin data for a representative nonhealing wound located on the plantar metatarsal region of the foot. Upper left: digital photographs from selected time points. Scale bars represent . Upper right: wound area as determined through analysis of digital photographs (◆). Lower: oxyhemoglobin concentration , deoxyhemoglobin concentration [Hb], and total hemoglobin concentration [Tot Hb] from each measurement day. Each data point represents the mean of measurements obtained from the center of the wound (●), the edges of the wound (△), and a control site on the nonwounded foot (x). A suitable control site on the wounded foot was unavailable due to the size of the wound and prior amputations.  Figure 5 shows plots of hemoglobin concentrations for a unique case in which the wound initially appeared to be healing, decreasing in size from during the initial of the study. In contrast to the initial wound size trend, NIR data from the wound site did not show convergence with the nonwound data, as is characteristic of healing wounds in this study. This wound never closed completely and required surgical intervention after week 25. This is an example of how diffuse NIR could provide clinicians with a better assessment of wound status than the superficial measurements of wound size. Fig. 5Wound size and hemoglobin data for a nonhealing wound located on the plantar metatarsal region of the foot that decreased in size during the initial of monitoring, but did not close completely and eventually needed surgical intervention after week 25. Dashed red lines are used to highlight the time period during which the hemoglobin data differed from the wound size data Upper left: digital photographs from selected time points. Scale bars represent . Upper right: wound area as determined through analysis of digital photographs (◆). Lower: oxyhemoglobin concentration , deoxyhemoglobin concentration [Hb], and total hemoglobin concentration [Tot Hb] from each measurement day. Each data point represents the mean of measurements obtained from the center of the wound (●), the edges of the wound (△), and a control site located approximately from the wound (+). A suitable control site on the nonwounded foot was unavailable due to prior amputations.  3.2.Rates of Change in Optical DataTo analyze our clinical data, we have tried to identify common parameters that describe the trends we observed and are representative of the clinical outcomes. In our analysis, the rate of temporal change of hemoglobin concentration can be estimated by fitting the data from each wound to a linear trend line. The limited amount of experimental data collected during this study combined with the data accuracy do not allow us the use of a more complicated fitting model at this time. The slopes of these trend lines correspond to the rates of change in optical properties with time, and have proven useful in quantifying the progress of a healing wound in our study. The slopes calculated from the hemoglobin concentration trend lines are referred to as the rates of change in each wound, and are shown for wound center and edge measurements in Fig. 6 . In all healing wounds, negative rates of change were observed for and [Tot Hb]. In all nonhealing wounds, the rates of change for and [Tot Hb] were close to zero or slightly positive. The rate of change for [Hb] concentration was close to zero in both healing and nonhealing wounds. The mean rates of change in healing and nonhealing wounds are compared for all hemoglobin concentrations ([Tot Hb], , and [Hb]) in Fig. 7 . A statistically significant difference between the slopes of healing and nonhealing wounds was obtained for the total hemoglobin concentration and the oxyhemoglobin concentration. Fig. 6Rates of change in hemoglobin concentration for all wound measurements. (a) Oxyhemoglobin concentration at wound centers, (b) oxyhemoglobin concentration at wound edges, (c) deoxyhemoglobin concentration at wound centers, (d) deoxyhemoglobin concentration at wound edges, (e) total hemoglobin concentration at wound centers, and (f) total hemoglobin concentration at wound edges. White bars represent data from healing wounds; black bars represent data from nonhealing wounds. The center location of one wound could not be measured due to its size and geometry. Therefore, data from only 11 wounds are presented in (a), (c), and (e) compared to data from 12 wounds in (b), (d), and (f).  3.3.Predictive Capability of Optical DataThe predictive capability of the rates of change in DPDW data would need to be determined through a study of more patients with measurements taken at more time points. However, as a first approximation, the rates of temporal change of [Tot Hb] and in each wound were calculated by fitting the data from the first ten weeks of measurements to a linear trend line. The slopes of the ten-week trend lines are shown in Fig. 8 . A threshold level for changes in [Tot Hb] or may be selected such that a rate of change below the selected threshold is classified as a “healing wound,” and a rate of change above the selected threshold is classified as a “nonhealing wound.” Such a classification system would allow prediction of healing outcome after ten weeks of NIR measurements. Table 2 shows the number and percent of healing and nonhealing wounds from this study that would have been correctly classified for two different threshold levels. It is clear that more data are needed to allow one to determine the threshold value of the slope that will distinguish healing from nonhealing wounds. It is likely that the period of time needed to establish a predictive trend could be reduced if measurements were conducted more frequently. The average number of data points during each subject’s first ten weeks in our study was 5.0. We chose to evaluate trends using ten weeks of data because five measurements appear to be adequate to establish a statistically reliable trend line. If, in a future study, DPDW measurements were conducted every week, we believe that it would be possible to establish a predictive trend line in only five weeks. Fig. 8Ten-week rates of change in and [Tot Hb] from the centers of all wounds. White bars represent data from healing wounds; black bars represent data from nonhealing wounds. 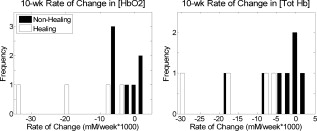 Table 2Prediction capability of changes in [HbO2] and [Tot Hb] for various thresholds.
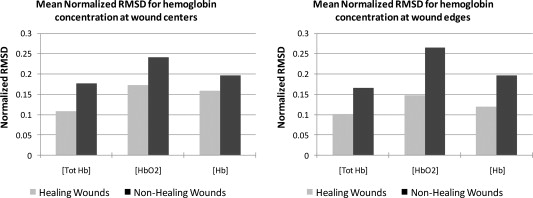
3.4.Statistical Characterization of Healing and Nonhealing Wound DataIn addition to the rate of change of hemoglobin concentration, the statistical characteristics of these data from a wound may provide an indicator of healing potential. Visual comparison of Figs. 3, 4, 5 reveals more week-to-week variability in the nonhealing data than in the healing data. To quantify variability differences, the root mean square deviation (RMSD) of experimental data from the fitted first-order polynomials was calculated using the following equation: where is the number of measurements, are measured values, and are the values predicted by the first-order polynomial fittings. The RMSD values were normalized by dividing by the mean of the experimental values obtained for each wound. Figure 9 shows that the mean normalized RMSD was greater in nonhealing wounds than in healing wounds for all hemoglobin concentrations (oxy-, deoxy-, and total hemoglobin).4.Discussion and ConclusionsOur previous research on the application of diffuse near-infrared methodology to assess wound healing in animal models has led us to the development of a hypothesis on the expected behavior of near-infrared absorption coefficients (and therefore hemoglobin concentration) during the course of healing.21, 22 This hypothesized model is illustrated in Fig. 10 . The time dependence of NIR optical absorption for human patients is expected to be different from that observed during the animal studies. Human patients are first seen when they have already developed chronic wounds, corresponding to an elevated yet constant absorption level (indicative of nonhealing) in our healing model. Any progress in healing manifests itself by a decrease in the NIR absorption coefficient and a convergence to the value of nonwound tissue (Fig. 10, dashed black line). In wounds that do not heal, the level is not expected to converge with nonwound tissue (Fig. 10, gray markers). The rates of change in healing and nonhealing wounds summarized in Fig. 7 are in agreement with the hypothesized healing model, and may provide the basis for a quantitative “healing index” that helps clinicians to distinguish healing from nonhealing wounds. Fig. 10Hypothesized wound healing curve. The dotted black line represents normal (nonwound) tissue. The solid black line represents the results of our animal studies. The descending dashed black line represents the hypothesized curve for healing wounds. The gray markers represent measurements on nonhealing wounds. 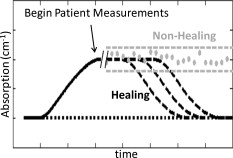 The rate of change of oxygenated hemoglobin concentration in healing wounds is greater than the rate of change in deoxygenated hemoglobin concentration, as shown in Fig. 6. During the late inflammatory/early proliferation stage of wound healing, angiogenesis increases the supply of oxygenated blood to the wound resulting in increased values of . In the late proliferation stage, angiogenesis stops and blood vessels begin to break down as a result of apoptosis.30 The resulting decrease in the supply of oxygenated hemoglobin to the wound may be reflected by the negative rate of change of observed in this study (Fig. 6). Concentrations of deoxygenated hemoglobin reflect metabolic activity within the wound bed, and would be expected to remain relatively constant assuming that an adequate supply of oxygenated blood is being delivered to the wound. This could explain why the changes in [Hb] in healing wounds were less pronounced than changes in . It has been hypothesized that chronic diabetic wounds may be “stuck” in various phases of the healing process.31 The nonhealing wounds observed in this study (represented in Figs. 4 and 5) may have been “arrested” before reaching the end of the proliferative phase of healing, resulting in oxygenated hemoglobin concentrations that were always greater than normal tissue and did not decrease like healing wounds. Furthermore, there is evidence that neuropathy and a prolonged inflammatory response in diabetic patients are important factors in the etiology of diabetic foot ulcers.31, 32 Diabetic neuropathy is associated with microcirculatory dysfunction in the foot, even in patients who have normal large-vessel blood flow to the foot.33 It has been hypothesized that repeated ischemia and reperfusion within the microvasculature of the foot may lead to cycles of inflammation in foot ulcers, further impairing the wound healing process.34 The high degree of week-to-week variability in nonhealing wounds compared to healing wounds shown in Fig. 9 supports this hypothesis, and could be an indication of cyclical changes in the microcirculation and inflammatory status of the wound, but further investigation is warranted to verify such behavior. In summary, temporal changes in the concentration of hemoglobin derived from DPDW measurements of the optical absorption coefficient in diabetic foot ulcers can be used to monitor healing progress. These changes can be quantified by calculating the linear rate of change and the week-to-week variability in optical absorption coefficient and hemoglobin concentration over time. These metrics are used to distinguish healing from nonhealing wounds in a study of human diabetic foot ulcers, indicating that DPDW methodology at near-infrared wavelengths may be able to provide wound care clinicians with objective and quantitative data to help in the assessment of overall wound health when deciding on treatment options. AcknowledgmentsThe authors would like to thank Varshana Gurusamy, Sarah Kralovic, Usha Kumar, and Xiang Mao for their help with wound measurements. This research was made possible by the generous support of the Wallace H. Coulter Foundation and the U.S. Army Medical Research Acquisition Activity. This research, funded by the U.S. Army Medical Research Acquisition Activity, 820 Chandler Street, Fort Detrick, MD 21702-5014, is the awarding and administering acquisition office. This investigation was funded under a U.S. Army Medical Research Acquisition Activity; Cooperative Agreement W81XWH 04-1-0419. The content of the information herein does not necessarily reflect the position or the policy of the U.S. Government or the U.S. Army, and no official endorsement should be inferred. ReferencesR. G. Sibbald, H. L. Orsted, P. M. Coutts, and D. H. Keast,
“Best practice recommendations for preparing the wound bed: update 2006,”
Adv. Skin Wound Care, 20
(7), 390
–405
(2007). https://doi.org/10.1097/01.ASW.0000280200.65883.fd Google Scholar
R. J. Goldman and R. Salcido,
“More than one way to measure a wound: an overview of tools and techniques,”
Adv. Skin Wound Care, 15
(5), 236
–243
(2002). https://doi.org/10.1097/00129334-200209000-00011 Google Scholar
N. Cullum, E. A. Nelson, K. Flemming, and T. Sheldon,
“Systematic reviews of wound care management: (5) beds; (6) compression; (7) laser therapy, therapeutic ultrasound, electrotherapy and electromagnetic therapy,”
Health Technol. Assess, 5
(9), 1
–221
(2001). 1366-5278 Google Scholar
T. Mustoe,
“Dermal ulcer healing: advances in understanding,”
(2005). Google Scholar
T. Gambichler, G. Moussa, M. Sand, D. Sand, P. Altmeyer, and K. Hoffmann,
“Applications of optical coherence tomography in dermatology,”
J. Dermatol. Sci., 40
(2), 85
–94
(2005). https://doi.org/10.1016/j.jdermsci.2005.07.006 0923-1811 Google Scholar
R. R. Anderson and J. A. Parrish,
“The optics of human skin,”
J. Invest. Dermatol., 77
(1), 13
–19
(1981). https://doi.org/10.1111/1523-1747.ep12479191 0022-202X Google Scholar
M. G. Rippon, K. Springett, and R. Walmsley,
“Ultrasound evaluation of acute experimental and chronic clinical wounds,”
Skin Res. Technol., 5
(4), 228
–236
(1999). https://doi.org/10.1111/j.1600-0846.1999.tb00135.x 0909-752X Google Scholar
O. Timar-Banu, H. Beauregard, J. Tousignant, M. Lassonde, P. Harris, G. Viau, L. Vachon, E. Levy, and T. Abribat,
“Development of noninvasive and quantitative methodologies for the assessment of chronic ulcers and scars in humans,”
Wound Repair Regen, 9
(2), 123
–132
(2001). https://doi.org/10.1046/j.1524-475x.2001.00123.x 1067-1927 Google Scholar
M. Dyson, S. Moodley, L. Verjee, W. Verling, J. Weinman, and P. Wilson,
“Wound healing assessment using ultrasound and photography,”
Skin Res. Technol., 9 116
–121
(2003). https://doi.org/10.1034/j.1600-0846.2003.00020.x 0909-752X Google Scholar
M. J. Cobb, Y. Chen, R. A. Underwood, M. L. Usui, J. Olerud, and X. Li,
“Noninvasive assessment of cutaneous wound healing using ultrahigh-resolution optical coherence tomography,”
J. Biomed. Opt., 11 064002
(2006). https://doi.org/10.1117/1.2388152 1083-3668 Google Scholar
J. T. Oh, S. W. Lee, Y. S. Kim, K. B. Suhr, and B. M. Kim,
“Quantification of the wound healing using polarization-sensitive optical coherence tomography,”
J. Biomed. Opt., 11 041124
(2006). https://doi.org/10.1117/1.2338826 1083-3668 Google Scholar
F. Khan and D. J. Newton,
“Laser Doppler imaging in the investigation of lower limb wounds,”
Int. J. Lower Extremity Wounds, 2
(2), 74
(2003). https://doi.org/10.1177/1534734603256271 Google Scholar
M. E. Gschwandtner, E. Ambrozy, S. Fasching, A. Willfort, B. Schneider, K. Bohler, U. Gaggl, and H. Ehringer,
“Microcirculation in venous ulcers and the surrounding skin: findings with capillary microscopy and a laser Doppler imager,”
Eur. J. Clin. Invest, 29
(8), 708 https://doi.org/10.1046/j.1365-2362.1999.00494.x 0014-2972 Google Scholar
B. Mlacak, A. Blinc, N. Gale, and B. Ivka,
“Microcirculation disturbances in patients with venous ulcer before and after healing as assessed by laser Doppler flux-metry,”
Arch. Med. Res., 36
(5), 480
–484
(2005). https://doi.org/10.1016/j.arcmed.2005.03.034 0188-0128 Google Scholar
W. D. Schmidt, K. Liebold, D. Fassler, and U. Wollina,
“Contact-free spectroscopy of leg ulcers: principle, technique, and calculation of spectroscopic wound scores,”
J. Invest. Dermatol., 116 531
–535
(2001). https://doi.org/10.1046/j.1523-1747.2001.01297.x 0022-202X Google Scholar
U. Wollina, K. Liebold, W. D. D. Schmidt, M. D. Hartmann, and D. D. Fassler,
“Biosurgery supports granulation and debridement in chronic wounds-clinical data and remittance spectroscopy measurement,”
Int. J. Dermatol., 41
(10), 635
–639
(2002). https://doi.org/10.1046/j.1365-4362.2002.01354.x 0011-9059 Google Scholar
S. M. Rajbhandari, N. D. Harris, S. Tesfaye, and J. D. Ward,
“Early identification of diabetic foot ulcers that may require intervention using the micro lightguide spectrophotometer,”
Diabetes Care, 22
(8), 1292
–1295
(1999). https://doi.org/10.2337/diacare.22.8.1292 0149-5992 Google Scholar
J. R. Payette, E. Kohlenberg, L. Leonardi, A. Pabbies, P. Kerr, K. Z. Liu, and M. G. Sowa,
“Assessment of skin flaps using optically based methods for measuring blood flow and oxygenation,”
Plast. Reconstr. Surg., 115
(2), 539
–546
(2005). https://doi.org/10.1097/01.PRS.0000148415.54546.CA 0032-1052 Google Scholar
E. K. Yeong, T. C. Hsiao, H. K. Chiang, and C. W. Lin,
“Prediction of burn healing time using artificial neural networks and reflectance spectrometer,”
Burns, 31
(4), 415
–420
(2005). https://doi.org/10.1016/j.burns.2004.12.003 0305-4179 Google Scholar
J. Mobley and T. Vo-Dinh,
“Optical properties of tissue,”
Biomedical Photonics Handbook, CRC Press, Boca Raton, FL
(2003). Google Scholar
E. S. Papazoglou, M. S. Weingarten, L. Zubkov, L. Zhu, S. Tyagi, and K. Pourrezaei,
“Optical properties of wounds: diabetic versus healthy tissue,”
IEEE Trans. Biomed. Eng., 53
(6), 1047
–1055
(2006). https://doi.org/10.1109/TBME.2006.873541 0018-9294 Google Scholar
E. S. Papazoglou, M. S. Weingarten, L. Zubkov, M. Neidrauer, L. Zhu, S. Tyagi, and K. Pourrezaei,
“Changes in optical properties of tissue during acute wound healing in an animal model,”
J. Biomed. Opt., 13
(4), 044005
(2008). https://doi.org/10.1117/1.2960952 1083-3668 Google Scholar
S. L. Jacques and B. W. Pogue,
“Tutorial on diffuse light transport,”
J. Biomed. Opt., 13 041302
(2008). https://doi.org/10.1117/1.2967535 1083-3668 Google Scholar
A. G. Yodh and D. A. Boas,
“Functional imaging with diffusing light,”
Biomedical Photonics Handbook, CRC Press, Boca Raton, FL
(2003). Google Scholar
T. H. Pham, O. Coquoz, J. B. Fishkin, E. Anderson, and B. J. Tromberg,
“Broad bandwidth frequency domain instrument for quantitative tissue optical spectroscopy,”
Rev. Sci. Instrum., 71 2500
(2000). https://doi.org/10.1063/1.1150665 0034-6748 Google Scholar
N. Shah, A. E. Cerussi, D. Jakubowski, D. Hsiang, J. Butler, and B. J. Tromberg,
“Spatial variations in optical and physiological properties of healthy breast tissue,”
J. Biomed. Opt., 9
(3), 534
–540
(2004). https://doi.org/10.1117/1.1695560 1083-3668 Google Scholar
S. Prahl, Optical Absorption of Hemoglobin,
(1999) http://omlc.ogi.edu/spectra/hemoglobin/ Google Scholar
G. M. Hale and M. R. Querry,
“Optical constants of water in the wavelength region,”
Appl. Opt., 12
(3), 555
(1973). https://doi.org/10.1364/AO.12.000555 0003-6935 Google Scholar
T. Svensson, S. Andersson-Engels, M. Einarsdóttír, and K. Svanberg,
“In vivo optical characterization of human prostate tissue using near-infrared time-resolved spectroscopy,”
J. Biomed. Opt., 12 014022
(2007). https://doi.org/10.1117/1.2435175 1083-3668 Google Scholar
A. J. Singer and R. A. F. Clark,
“Cutaneous wound healing,”
N. Engl. J. Med., 341
(10), 738
–746
(1999). https://doi.org/10.1056/NEJM199909023411006 0028-4793 Google Scholar
V. Falanga,
“Wound healing and its impairment in the diabetic foot,”
Lancet, 366
(9498), 1736
–1743
(2005). https://doi.org/10.1016/S0140-6736(05)67700-8 0140-6736 Google Scholar
M. A. M. Loots, E. N. Lamme, J. Zeegelaar, J. R. Mekkes, J. D. Bos, and E. Middelkoop,
“Differences in cellular infiltrate and extracellular matrix of chronic diabetic and venous ulcers versus acute wounds,”
J. Invest. Dermatol., 111
(5), 850
–857
(1998). https://doi.org/10.1046/j.1523-1747.1998.00381.x 0022-202X Google Scholar
A. Veves, C. M. Akbari, J. Primavera, V. M. Donaghue, D. Zacharoulis, J. S. Chrzan, U. DeGirolami, F. W. LoGerfo, and R. Freeman,
“Endothelial dysfunction and the expression of endothelial nitric oxide synthetase in diabetic neuropathy, vascular disease, and foot ulceration,”
Diabetes, 47
(3), 457
(1998). https://doi.org/10.2337/diabetes.47.3.457 0012-1797 Google Scholar
T. A. Mustoe, K. O’Shaughnessy, and O. Kloeters,
“Chronic wound pathogenesis and current treatment strategies: a unifying hypothesis,”
Plast. Reconstr. Surg., 117
(7S), 35S
(2006). https://doi.org/10.1097/01.prs.0000225431.63010.1b 0032-1052 Google Scholar
|