
|
|
1.IntroductionNeurons—the fundamental cellular units of the mammalian central nervous system (CNS)—have theoretically1 and experimentally2 demonstrated nonlinear behaviors that are hypothesized to underlie neural computation.3 These nerve cells receive information from up to hundreds of thousands of other neurons at subcellular structures called synapses. Most synapses in the CNS are located on highly branched structures known as dendrites. Here, the electrochemical signals, excitatory postsynaptic potentials (EPSPs), and inhibitory postsynaptic potentials (IPSPs), are integrated in a nonlinear manner and sent to other neurons via the axon by a signal known as an action potential (AP). While critical to modeling the information processing capabilities of neurons, the nonlinear nature of this synaptic integration is poorly understood. In addition to their intricate, branched morphology, neuronal dendrites contain a vast array of voltage- and ligand-sensitive protein ion pumps and channels distributed in a heterogeneous fashion. Given their complex biophysical construction, neuron function is likely strongly linked to structure. Traditional electrophysiological stimulation techniques with microelectrodes have proven nonideal for studying synaptic integration. While the temporal resolution of standard microelectrodes is sufficient to evoke the millisecond-scale responses of APs and EPSPs, the distributed nature of dendrites is problematic. With hundreds of dendritic branches on the order of a micron in diameter, it is virtually impossible to arrange even a few microelectrodes plus associated manipulators in a deterministic pattern for the purpose of focally stimulating a single, presynaptic axon among the large bundles of axons common in mammalian brain tissue.4 It is additionally difficult to do this repeatably and in varied patterns, a capability necessary for studying synaptic integration. Our goal was to develop an instrument that enables neuroscientists to study multisynaptic integration. Recent advances in molecular probes designed for optically measuring and manipulating cellular physiology have made it possible to leverage the high spatial resolution and noninvasiveness of light-based techniques. Dialyzing the cytoplasm with fluorescent dyes enable experimentalists to visualize dendrites with submicron resolution.5 Thus, it is possible to accurately determine the location of spines, the sites where the presynaptic axons actually impinge on the dendrite. Furthermore, photolabile precursors (commonly referred to as “caged compounds”) make it possible to release neuroactive reagents6, 7, 8 with high precision, limited only by the spatial and temporal resolution of the uncaging focal illumination. As the primary excitatory neurotransmitter in the mammalian CNS, glutamate (Glu) derivatives such as 4-methoxy-7-nitroindolinyl-caged L-glutamate (MNI-Glu) have proven most useful for studying synaptic integration.2, 9 Bathing an acute brain slice in artificial cerebrospinal fluid (aCSF) containing MNI-Glu has no observable effect. However, application of near-UV excitation rapidly10 (i.e., ) breaks the photolabile bond, releasing Glu at whatever location the focal illumination was directed.11, 12 With precise control over the spatial and temporal positioning of the uncaging radiation, an experimentalist can create sophisticated patterns of neural excitation.13, 14 When the photolytic stimulation is physiological15—in other words, the time course and magnitude of Glu released is similar to that of the endogenous presynaptic mechanism—the natural Glu clearance mechanisms (diffusion, external degradation enzymes, Glu re-uptake by presynaptic cells, etc.) will absorb the released Glu, and external mechanisms to remove the photoproduct become unnecessary.16 The challenge then becomes controlling the uncaging radiation so that these patterns of excitation are useful for studying synaptic integration. Since a laser beam is a readily available source of nearly monochromatic, steerable radiation, a fast laser scanner with power modulation capabilities would be suitable. The design requirements of such a laser scanner include: 1. scanning speed ( transit between sites); 2. random access, i.e., the ability to visit discontiguous sites (neuron branching is highly irregular and meandering); 3. user control of delay, dwell, and power at each site; and 4. sufficient lateral and axial resolution, i.e., optical sectioning. The majority of existing laser scanning systems consist of physically tilting, rotating, or pivoting mirrors. Thus, inertia limits the maximal scanning speed and the ability to visit multiple, discontiguous sites. Most existing fast-scanning systems are designed for fast imaging: the maximum-speed envelopes have been expanded by increased rastering speed (such as resonant mirror scanning17, 18) or through multisite, parallelized scanning (such as multiphoton multifocal microscopy19), neither of which are applicable to multisite photolysis. We chose inertia-free acousto-optic scanning of a single ultrafast laser beam to provide imaging and photolysis in acute brain slices with dendritic spine level resolution ( diam) and minimal photodamage.20, 21 In this work, we describe the construction of this instrument, the rationale for selecting optical components, and biological protocols optimized for fluorescently labeling and optically stimulating dendritic spines. We review the theoretical underpinnings of spectral and temporal dispersion of ultrafast laser pulses, explore the consequences of not addressing dispersion, and detail techniques for minimizing and compensating these deleterious effects.22, 23 Finally, we demonstrate that the microscope provides physiologically relevant, locally restricted synaptic stimulation at multiple sites to three classes of neurons in different parts of the rat brain. 2.Instrument Design and ProtocolsBecause the desired microscope must satisfy many design requirements (some nearly mutually exclusive), great care must be taken when selecting the layout strategies, optical constituents, and biological procedures. Here we describe our rationale for choosing the various components. 2.1.Multiphoton ExcitationTo achieve physiological synaptic stimulation by mimicking presynaptic release of neurotransmitter, the instrument must be able to photolyse the caged neurotransmitter adjacent to a visually identified spine while avoiding observable activation of neighboring spines. Since neurons develop in all three spatial dimensions, this release of neurotransmitter must be constrained laterally as well as axially (i.e., thin focal plane). Furthermore, to appropriately place stimulation sites, the experimentalist must be able to clearly observe the putative synapses, i.e., dendritic spines. This requires 3-D fluorescent imaging resolution of . Many strategies for improving imaging resolution operate in a post hoc manner. For example, confocal microscopy removes out-of-focus emission light, photons that have already exited the irradiated specimen. Likewise, image deconvolution refines a previously recorded image long after the excitation light entered the sample. To stimulate a neuron via spatially restricted photolysis, however, requires that the high spatial resolution be an inherent property of the excitation light. The femtoliter focal volume of multiphoton excitation with an ultrafast laser fulfills this requirement due to its intrinsic optical sectioning.24, 25 The effects of out-of-plane irradiation (i.e., release of neurotransmitter at undesired locations) are minimized due to the nonlinear power dependency, while the lateral resolution is sufficient to clearly resolve neighboring spines in typical mammalian CNS neurons. Additionally, the use of near-infrared (NIR) wavelengths in multiphoton excitation reduces Raleigh scattering in a nonlinear way, further increasing imaging quality and photolysis efficiency. Finally, the high instantaneous intensity but low average power NIR excitation minimizes heating and phototoxicity. 26, 27 Photolysis is most efficient for wavelengths less than for single photon irradiation.28 Because the typical multiphoton excitation source, a titanium-sapphire (Ti:S) laser, is tunable, wavelength selection must be deliberate. Two-photon absorption maxima are rarely simply twice their one-photon counterparts, but are somewhat blue-shifted. Several groups reported success using for multiphoton photolysis of MNI-Glu.2, 29 Because the desired effect of many of the optical components are wavelength-dependent, particularly the beam deflectors and their compensating modules, this wavelength must be held constant during an experiment. Thus, imaging, as well as photolysis, was performed at . 2.2.Acousto-Optic Deflectors and DriversWe selected acousto-optic deflectors (AODs) for fast, noncontiguous laser beam steering.30, 31, 32 Applying radio frequency (rf) sound to a crystal establishes a virtual diffraction grating capable of deflecting a laser beam by tens of mrad. Deflection angles are transformed into changes in position at the focal plane of a lens, thus providing lateral 2-D laser beam scanning. The speed of changing the deflection angle is limited only by the time required for the updated acoustic frequency to traverse the optical aperture. For a AOD aperture and an acoustic velocity of , the positioning time is , permitting the scanner to visit . In practice, the rate-limiting factor is the dwell time ( in this study) required to photolyse enough MNI-Glu to generate a detectable neural response. Another advantage of AOD-based scanning is that the change in deflection angle is not limited to neighboring sites or to lie along straight lines; only the acoustic frequency must be changed and thus the same small penalty of a few is enforced, even if jumping across the full angular range of the deflector. A final useful property of AOD scanning is that the diffraction efficiency is directly related to acoustic power: by varying the amplitude of the impinging sound waves, the intensity of the deflected laser beam can be modulated at the same high speed. This allows quite sophisticated scanning patterns in which laser power is dictated on a per site basis, enabling corrections for uneven fluorescence excitation and graded photolysis. We used AODs with a NIR broadband antireflection coating (ATD-7010CD2, Intraction). These AODs have a aperture and operate from . The specified diffraction efficiency of across the full bandwidth was realized with rf amplifiers (DE-704M, IntraAction). We found it necessary to use this relatively high acoustic power when employing the large aperture AODs. The large apertures were specified for overfilling the objective lens back focal aperture with minimal or no demagnification (see Sec. 2.3). With the large apertures, the AODs provided higher angular resolution, which leads to higher imaging resolution. (The larger apertures do have two limitations. First, it is a manufacturing challenge to synthesize crystals that can accommodate these large apertures and homogeneously deliver acoustic power across the aperture. Second, temporal resolution is somewhat sacrificed. But as the access time is only on the order of , the instrument can still visit tens of sites per msec, nearly simultaneous from the neuron’s perspective.) A notable characteristic of this particular optical layout [Figs. 1c and 1d ] is that the centers of both AODs are as close to diffraction planes as possible. Some dual mounts place a pair of AODs in a back-to-back configuration, which makes it impossible to have both perfectly located in a diffraction plane. Such a configuration might result in lensing effects that would degrade the realized resolution. Our setup presents no such compromise. Fig. 1Optical layout. (a) Abbreviated optical layout including temporal compensation (prechirper) and spectral compensation (diffraction grating) for dispersion introduced by the AODs. (b) Coupling laser beam (red) into a customized Nikon E600FN microscope (Y-FL with FF665–DiO2–25×36, Semrock and FF01–680/SP-25, Semrock; Y-IDP with 21010, Chroma, and 650DCSPXR, Chroma) and collection of fluorescence emission light (green). (c) Physical arrangement of optical elements. Side view highlights temporal dispersion compensation with prism prechirper and lens relays between AODs. (d) Corresponding physical beam paths (red). Every change in laser beam direction is the result of a mirror unless an optical element is explicitly indicated. Lens focal lengths given in millimeters. (Color online only.) 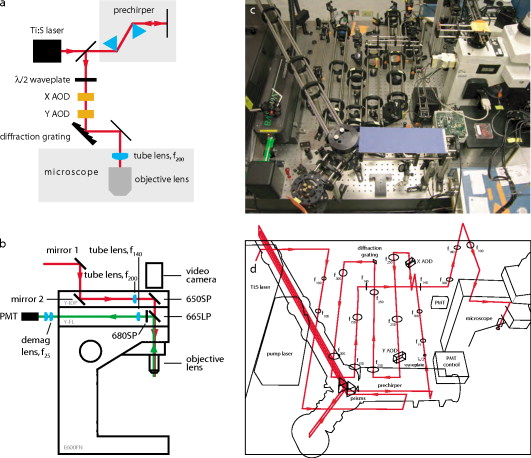 While AODs fulfill many of the design requirements for constructing a fast, modulatable scanner, there are two severe drawbacks for which we must compensate and/or mitigate. Materials that have good acousto-optic interaction tend to be highly dispersive. This is manifest in pulse-width broadening (temporal dispersion) and wavelength-dependent diffraction (spectral dispersion). These distorting effects are detailed in later sections. 2.3.Objective Lens, Field of View, and DemagnificationWhile the smallest structures of interest for these studies, dendritic spines, are on the order of , the full dendritic arbor can extend across hundreds of microns [see Fig. 4a]. It is thus imperative to select an objective lens with a large enough field of view (FOV) so that panning is not excessive during a typical experiment, while still presenting a high enough numerical aperture (NA) to resolve spines. To this end, we used a objective lens (Nikon CFI Fluor). With the tube image diameter of , the transillumination FOV is , allowing viewing of whole neurons with only a few repositionings. The working distance generously accommodates electrophysiology pipettes to gain access to neurons. Furthermore, because this objective is a “dipping” lens, it is designed for water as the immersion medium with no intervening cover slip, exactly the scenario for performing an electrophysiological experiment on an upright microscope. Fig. 4Neurophysiological demonstration of photolysis. (a) Images of bis-FURA-2 fluorescent dye-loaded neurons: hippocampal CA1 neurons (left), cerebellar Purkinje neurons (middle), and striatal medium spiny neurons (right). Full morphologies are montages of maximum intensity projections, while inset zoom-ins (indicated by box overlays on montages) are single optical sections. Numbered locations in the CA1 zoom-in indicate the five spatially distinct photolysis sites that were stimulated in (e). (b) Examples of EPSP amplitude tuning for four different spines on the same CA1 neuron. Each spine was stimulated at , followed by each spine at , etc. The values for a spine at each laser power (indicated by circles, squares, and triangles) are connected by a line. (c) Example of lateral resolution of photolysis. While this instance demonstrated a FWHM of , the average over all tested spines was (all data are ). (d) Example of axial resolution of photolysis. FWHM for this example is ; average over all tested spines is . (e) Electrophysiological responses to photolysis of MNI-Glu at five visually identified spines of a CA1 pyramidal neuron. Each trace is the average of three identical stimulus presentations. For each trace, the delay between stimulation of each of the five sites was measured from , , to . At , is much larger than at . Note that is limited primarily by the dwell time required to elicit the unitary responses.  The FOV of the laser scan pattern is not necessarily identical to that of the transillumination. To fully realize the FOV, the acceptance angle of the objective lens’ back focal aperture (BFA) must be matched. With a tube lens of and tube image diameter of , For AODs, the scan angle iswith wavelength , acoustic frequency , and acoustic velocity . Therefore, the full scan range is . With no magnification, we obtain of the full FOV, or (commercial laser-scanning systems typically utilize 50 to 60% of the objective lens’ FOV33). This is implemented via a relay telescope using NIR achromatic doublets with broadband NIR antireflection coatings (Thorlabs) [Figs. 1c and 1d]. An alternative is to replace this telescope with a telescope that demagnifies by , but has the same total optical path length (i.e., ), allowing straightforward drop-in replacement with off-the-shelf lenses. Such a demagnification increases the to , providing a . We typically used the telescope.For and , the radius of the intensity point spread function34 (PSF) is This spot size is sufficient to clearly resolve dendritic spines. To fill the FOV, we require spots assuming this spot size, well within the the diffraction-limited performance of these AODs. If using the expanded FOV, the AODs would need to support resolvable spots, beyond their diffraction-limited capabilities. Thus, the combination of the lens with AOD scan angle magnification is a good compromise of high magnification, acceptably large FOV, high diffraction efficiency, acceptable , and nearly diffraction-limited resolution.2.4.Fluorescent LabelTo accurately select photolysis sites, the experimentalist must be able to unambiguously visualize dendritic spines. One of the most effective techniques for increasing the contrast of the neuron of interest with respect to the surrounding tissue is to include a fluorescent label with the internal solution of the electrophysiology pipette whose lumen is continuous with the cytoplasm. Since the dyes are membrane impermeant, only the neuron with the pipette attached will become fluorescently labeled. Suitable dyes for this procedure exhibit good diffusion, strong fluorescence, and minimal photobleaching and photodamage. However, there are additional constraints for our purpose here. AOD scanning and most schemes for temporal and spectral dispersion compensation are wavelength-dependent. Therefore, though it is possible to purchase an automated wavelength-tunable Ti:S laser (Mira 900D and Verdi V8 pump, Coherent), the optical setup requires that a single wavelength be used for fluorescent imaging and photolysis. Since there are a plethora of fluorescent labels with a wide excitation absorption range, we choose to use the most effective wavelength for photolysis: . This choice represents an acceptable compromise of photolysis efficiency (more effective at shorter wavelengths) and the laser gain curve (more effective at longer wavelengths). Selecting a fluorescent dye based on a desired absorption wavelength when using two-photon excitation is not straightforward. Choosing a dye based on its absorption maxima is problematic because empirical tests have suggested that the two-photon absorption spectra for many dyes are blue-shifted from half their single photon counterparts.21 Another difficulty is that one typically favors dyes with relatively large molar extinction coefficients . However, two-photon absorption does not follow the familiar but ungeneralized Beer-Lambert law: it depends also on beam size and degree of collimation. Nevertheless, we supposed it reasonable to investigate UV-excitable dyes with relatively large . Despite poor two-photon excited fluorescence levels from both AlexaFluor 350 and 405 (Invitrogen) at , we obtained good results from a UV-excitable calcium-sensitive dye, bis-FURA-2 (low calcium ; ; ).2, 35, 36 The FURA-2 family is composed of dual-excitation, single-emission dyes. When excited at the lower wavelength, peak fluorescence emission occurs when cytoplasmic, unbound calcium is at resting levels. Even though bis-FURA-2 (Invitrogen) is a calcium-sensitive dye, we used it here simply as a structural label; during imaging mode (i.e., no photolytic or electrophysiological stimulation), the fluorescence is quite stable and suitable for this purpose. With a relatively large two-photon cross section, at , this dye produces strong emission when included in the pipette at a concentration of (due in part to the fact that there are two FURA fluorophore moieties per molecule) such that spines are clearly visible. It exhibited minimal photobleaching and no apparent photodamage (i.e., electrophysiology measurements remained nominal with repeated laser irradiation). Using a calcium indicator could very well confound the dendritic physiology when using this system due to the dye’s buffering properties. However, we predict negligible effects under the most likely experimental conditions for studying synaptic summation. First, of intracellular calcium is already bound by endogenous calcium chelators.37 Second, photolytic synaptic activation resulting in small EPSPs ( unitary amplitude) is unlikely to recruit significant calcium currents from voltage-gated ion channels. Low-voltage-activated (LVA) calcium channels are the most sensitive calcium channels to depolarization. The activation of T-type calcium channels, the major component of a neuron’s complement LVA calcium channels, is depolarized from resting potential.38 The only other significant sources of calcium are the NMDA receptors themselves.39 Considering the ratio of calcium currents to sodium and potassium currents passed by NMDA and the relative ratios of total NMDA currents to AMPA currents, the amount of calcium flowing into the neuron during synaptic activation is small compared to that of the other cations.40 We therefore feel justified in using bis-FURA-2 as a structural label for synaptic summation studies, because it does not appreciably alter calcium buffering and that synaptically evoked depolarization results mostly from sodium and potassium currents. 2.5.Caged Glu and Delivery MethodsWhile there are several varieties of caged Glu, we chose MNI-Glu (Tocris Bioscience) because it possesses the best combination of water solubility, water stability, and uncaging speed of any of the commercially available alternatives. 7, 10, 27 There are two common methods for delivering caged Glu to a neuron of interest: bulk application via bath perfusion, and focal application via local perfusion through a large diameter micropipette. Bath perfusion has several advantages. Bath application of the caged neurotransmitter minimizes specimen repositioning because the compound is evenly distributed throughout the slice. It is simple to set up, and with fewer moving components the possibility of disturbing the delicate electrophysiology recording is minimized. However, the disadvantages are numerous. Because the caged Glu must be used at an effective concentration (typically a few mM) throughout the whole perfusion volume, a significant amount of costly reagent must be used that cannot be recovered. Furthermore, because the perfusion volume must be recycled in this case, this strategy requires an expensive peristaltic pump that can handle low total volumes with low pressure pulsation. The small perfusion volume also increases the possibility of cytotoxic effects from the recycled perfusate. Finally, the caged Glu is always present, meaning that control experiments are difficult to perform to determine if the observed response is due to MNI-Glu photolysis or simply an irradiation artifact from the laser. Local perfusion of MNI-Glu addresses these disadvantages. The smaller overall volume of the delivery pipette allowed us to make a more concentrated solution (12 versus ) but using less total reagent, which we found advantageous for obtaining physiological responses while costing less. Furthermore, this method does not require a special pump, and we were able to use our standard, large bath volume with gravity-driven (i.e., not recycled) scheme that minimized possible toxic effects. Finally, we could regulate the flow of caged Glu independently of the perfusion solution, which proved invaluable in control experiments. Using large internal diameter micropipettes tapered to , a pressure equivalent to maintained constant flow for more than ( typical). Since we could turn the flow on and off independently from the bath perfusion, this duration was quite sufficient for tens of presentations of even the most complex stimulation patterns. With a standard intravenous drip set (60 drops per ml for the bath perfusion) at per minute, the plume is slightly less than the field of view. Minimal repositioning of the specimen was necessary with this arrangement. 3.Spectral DispersionWhile laser light is often considered monochromatic when compared to other light sources, the finite spectral bandwidth of laser light has consequences for high-resolution imaging. Since the AOD scanning principle is based on diffraction, the scan angle is wavelength-dependent. This dependency could degrade the maximal achievable imaging resolution. Furthermore, ultrafast lasers have a wider spectral content than continuous waveform (i.e., nonpulsed lasers; versus ), exacerbating this type of degradation. The general effect is that instead of a radially symmetric focal volume, the focal volume is elongated along the vector sum of the deflection axes. Because an image can be modeled as the convolution of the specimen with the excitation point spread function (PSF), a significantly elongated PSF limits the smallest resolvable objects. To perform a multisite photolysis experiment with this instrument, we carefully select the caged compounds, fluorescent dye, and wavelength to be mutually compatible, such that the laser is tuned to a single wavelength during any one experiment. However, “tuning to a single wavelength” for a Ti:S laser is parlance for actually optimizing the laser for a particular central wavelength. Despite closely conforming to a waveform, we assume Gaussian-shaped pulses for simplicity. The spectral bandwidth for a transform-limited Gaussian pulse is given by where is the speed of light and is the pulse width (all pulse widths reported as FWHM for Gaussian-shaped pulses). Shorter results in broader spectral content. For and , . Since this relatively broad spectrum causes a decrease in resolution, one possible strategy for minimizing the spectral dispersion is to increase the pulse width in the equation. This is not useful for two reasons. First, two-photon absorption probability is inversely related to the pulse width,25 severely penalizing broader pulses. Second, ultrafast lasers are typically optimized for the shorter pulse widths and do not support operation at the necessary powers with longer .Using AODs, a scan pattern is built of purposeful angle changes: sequential, neighboring changes for raster scanning to build an image, or discontinuous changes to create a sparse photolysis pattern. The number of unique possible positions—which dictate resolution—is constrained by the number of unique angles (Table 1 ). In the ideal case, the number of unique angles is limited by diffraction. Parallel beams of light passing through the AOD aperture are spread. This aperture-dependent spreading establishes the fundamental maximal number of spots (and conversely, the minimal spot size). In practice, however, the number of unique angles (and by extension, resolvable spots) is limited by spectral dispersion. The wide spectral content of Ti:S laser light is spread out more than diffraction of monochromatic light. This further limits the number of resolvable spots (i.e., the system is no longer diffraction limited but is instead dispersion limited) and diminishes the two-photon excitation efficiency, because the photon flux density at the excitation volume is decreased. Table 1Theoretical spectral dispersion and compensation of TeO2 AODs. The following parameters are used: wavelength λ=720nm ; spectral bandwidth Δλ=3.68nm ; AOD aperture D=10mm ; acoustic velocity ν=676m∕sec ; scan range θscan=42.6mrad ; diffraction θdiffraction=0.0634mrad ; grating pitch d=150grooves∕mm ; effective compensation frequency fcomp=νd∕2=71.7MHz ; and compensation θgrating=2Δλfcomp∕ν=552μrad .
The quantitative effect of the relatively wide spectrum is realized when considering the equations describing AOD deflection. The angle through which a laser beam is deflected by an AOD, , is governed by where is the acoustic frequency ( for these AODs) and is the acoustic velocity ( in ). The total angle through which the beam can be deflected into the first order is limited by the acoustic bandwidth, . For our center wavelength, acoustic bandwidth, and acoustic velocity, . A wavefront encountering the AOD aperture is subject to diffraction, however. In this instance, the aperture, , imposes an additional angle onto the scanned beams as seen byfrom the approximation of diffraction at a square aperture. The number of possible discrete angles (and by extension, the number of resolvable spots) isalong one dimension (Table 1). However, without appropriate compensation, the number of angles is limited by dispersion, not diffraction. The finite spectral bandwidth gives a dispersion angle described byNote that the amount of spectral dispersion directly varies with the sound wave frequency , so that minimally deflected beams (i.e., ) are dispersed the least, while maximally deflected beams are dispersed the most [Fig. 2a, left panel, and Table 1]. To obtain a 2-D scan pattern in the specimen plane, we employ a pair of orthogonal AODs. The aggregate dispersion for two dimensions isAt the center of the scan pattern , the dispersion is worse than the 1-D case by a factor of ; the beam is dispersed to , larger than the diffraction-limited beam (Table 1). This leads directly to a degradation in resolution by the same factor, a result of the now-elongated focal volume. Examination of the dispersion equation reveals that dispersion varies with acoustic frequency, so that at the highest frequency, the maximum 2-D dispersion is for an elongation factor of , and is reduced to spots at the corner of the scan pattern (Table 1).Fig. 2Compensation of spectral dispersion. (a) Principles of uncompensated (top row) and grating-compensated (bottom row) spectral dispersion. Spectral dispersion elongates the collimated beam along the axis of deflection. A diffraction grating whose groove frequency is equivalent to the center frequency of the AOD recollimates the center beams and reduces the dispersion of the outer beams. Note: angles are exaggerated for the purposes of this schematic. (b) Diagonal scan patterns in fluorescent material. The uncompensated spots are elongated along the scan axis by 5 to , while the compensated spots are near the center of the scan pattern. (c) Variation of spot elongation as a function of AOD frequency. As suggested by Eq. 9, increases with increasing AOD frequency. With the addition of a diffraction grating tuned to the center frequency, the is minimized in the middle of the scan field and is greatly improved at the edges of the scan pattern. (d) Images of fluorescent beads in water at zoom factor. Without compensation, the spherical beads appear lengthened along the vector sum of the two deflection axes (i.e., along the ) as a result of the elongated focal spot. With the grating inserted to recollimate the beams, the beads appear qualitatively circular. The zoom-ins were taken near the center of the scan range, so the observed elongation does not reflect the maximal spectral dispersion at the extrema of the scan pattern. Lines indicate examples of manually selected cross sections taken approximately parallel (solid black) and orthogonal (dotted red) to the axis of dispersion. (e) Average intensity of parallel (par) and orthogonal (orth) cross sections without compensation (uncomp, ) and with compensation (comp, ), respectively. The orthogonal axis FWHM is similar in both cases ( ; ), whereas the parallel axes are quite dissimilar ( ; ). The fact that the parallel and orthogonal axes are similar when compensated (i.e., grating is inserted) indicates that the PSF has been nearly restored to its circular shape. (Color online only.)  An effective strategy to compensate for this spectral dispersion involves an additional diffraction grating. Even though we use two AODs to create a 2-D scan pattern, the aggregate dispersion requires only a single compensation grating [Fig. 2a, right panel]. Our design employs a ruled reflection grating oriented to the scan pattern. The compensation principle is that the grating produces dispersion equal and opposite that of the pair of AODs at their center frequency. At that location, the dispersion is fully compensated and the diffraction-limited performance is restored. Toward the edges of the scan pattern, dispersion is minimized to near the diffraction limit. The compensation angle is described by To achieve this, we specify a ruled diffraction grating with groove spacing . With an effective frequency of , we calculate that a grating with would fully compensate the center spot. A commercially available ruled grating (Newport 33009ZD02-426R; diffraction efficiency at for both - and -polarizations) of fully compensates for , very close to the center. Near the extrema of the scan pattern, the spot elongations are reduced by a factor of 3 to (compare and in Table 1).Using the grating equation and an incident angle , we can determine the diffraction angle . Since , the total included angle through which the grating diffracts is nearly a right angle, and we can use the grating in a diffraction plane [see Figs. 1c and 1d] to change the beam path direction in place of a standard reflecting mirror. This greatly simplifies and shortens the optical path length and reduces the total number of required optical elements. Because the 2-D scan pattern is manifested as a collection of deflected laser beams, all the beams do not strike the grating perfectly orthogonally to the grooves. Thus, a more general grating equation must be applied: . However, since , and this contribution can be reasonably ignored. Figure 2 illustrates the resolution degradation due to spectral dispersion and the improvement realized when compensated. We first created a scan pattern of separated spots along the axis of maximal dispersion (i.e., diagonally). The fluorescence signal from a fluorescent plastic slide (Chroma Technology) indicates that the focus spot is greatly elongated along this axis [Fig. 2b, top]. When the spectral dispersion is properly compensated, however, the focus spots become much more symmetrical and much brighter due to the improved concentration of photon flux in the small focal volume [Fig. 2b, bottom]. To quantify this elongation, we fit each spot with a 2-D Gaussian function; the ratio of widths we plot as . Examination of versus AOD frequency [Fig. 2c] indicates general agreement with the theoretical values calculated in Table 1. Uncompensated, ranges from at the minimal deflection frequency to nearly at the maximal frequency. In contrast, the addition of the compensation grating nearly eliminated elongation at the center of the scan pattern (i.e., ), while the edges exhibit greatly minimized . Once we demonstrated the effects of spectral dispersion and its compensation on the illumination spot, we wanted to determine the consequences for this elongated focal spot on imaging performance. We therefore imaged fluorescent beads (Invitrogen) dispersed in water. Since they are only slightly larger than the theoretical focal volume, the apparent size and shape of the spherical beads should indicate the distortion of the PSF due to spectral dispersion. When spectral dispersion was uncompensated (top row), a standard NIR dielectric mirror (E03 series, broadband, Thorlabs) replaced the compensating diffraction grating (bottom row). Images collected without the grating exhibit greatly elongated bead profiles (Fig. 2, top row), testifying to the need for compensation, whereas the beads appear more qualitatively circular when dispersion is compensated (Fig. 2, bottom row). For a subset of beads, the elongation was quantified by taking intensity cross sections parallel (black lines) and orthogonal (red lines) to the dispersion axis [Fig. 2d]. The observed bead diameter is similar along the orthogonal axis regardless of the presence of compensation, indicating that dispersion is strong along a single axis [Fig. 2e]. However, when compensated, the apparent diameters of the beads parallel to the dispersion axis are much more similar to the orthogonal axis when compared to the uncompensated images . Furthermore, we were able to reduce the PMT (H7712-13, Hamamatsu) gain for the compensated image, decreasing the amplified noise level. Alternatively, lower laser power could have been used to guard against potential photodamage. Without appropriate spectral compensation, two-photon AOD scanned images will appear distorted along the axis of dispersion. Dendritic branches, for example, which are nearly cylindrical, would appear elongated. Branches that run nearly perpendicular to the dispersion axis would appear as several times their width when running nearly parallel. Given a distorted dendrite image, accurately placing photolysis sites would prove nearly impossible. Furthermore, the distorted focal volume requires higher laser intensity to obtain equivalent two-photon absorption rates due to the reduced photon flux. This simple compensation scheme consisting of a single ruled diffraction grating successfully diminishes this distortion and minimizes the required laser intensity. 4.Temporal DispersionThe utility of ultrashort pulses in imaging applications is their extremely high local intensity when focused by a high NA lens. Their small focal volume gives high lateral resolution and intrinsic optical sectioning. These properties are a consequence of the near-simultaneous absorption of photons. This requires photon flux densities that are only produced by ultrashort, pulsed lasers. Dispersive media, such as the of AODs and the optical materials used in lens fabrication, diminish this high instantaneous intensity necessary for multiphoton absorption. Ultrashort pulses, such as those from a mode-locked Ti:S laser, propagating through dispersive media experience temporal broadening, called group-velocity dispersion (GVD).41 In such materials, the refractive index decreases as the wavelength increases. With the broad spectral content of a short pulse, the shorter wavelength components are retarded relative to the longer wavelength components. Given a total optical path length of many centimeters of highly dispersive optical material, such as a pair of AODs plus several thick achromatic lenses, a typical pulse width may be broadened several times over. Since multiphoton absorption efficiency is strongly dependent on pulse width, this temporal broadening can impose insurmountable constraints on exciting fluorophores and photolyzing photolabile bonds.42, 43 Average laser power cannot be indefinitely increased, and living tissue can only tolerate limited heating from irradiation. To determine the pulse broadening of ultrashort laser pulses, we use the treatment of Iyer, Losavio, and Saggau.22 GVD is given by with the parameters , , and calculated from numerical solution of the Sellmeier equation for ordinary refractive index,With these parameters, the GVD for deflectors operating in slow-shear mode is calculated to be . For two AODs with an interaction length of each, the imparted group-delay dispersion (GDD) is . Furthermore, the seventeen-thick achromatic lenses for the optical layout [Figs. 1c and 1d] generate additional nontrivial dispersion. For example, a , IR achromatic doublet presents of LAKN22 and of SFL6 along the center ray. A single lens of this type produces dispersion. For the seventeen various lenses of our system, we calculate an additional dispersion, approximately the dispersion of both AODs. Thus the aggregate theoretical GDD is on the order of . The microscope tube lens and objective lens, for which we did not explicitly accommodate in this tabulation because their optical composition is not specified, might marginally contribute to the aggregate temporal dispersion.44, 45, 46What is the consequence of this amount of dispersion, and can it be mitigated by altering the input in some way? Assuming a transform-limited Gaussian pulse shape, for a given input pulse width , and dispersion GDD, the output pulse width is related by Figure 3a shows how the output pulse width varies with input pulse width and with dispersion. The minimal is never achieved with the smallest due to the dependence of on the inverse second power of . For example, given a GDD of , the minimal output pulse width, , is realized when the input pulse width is [Fig. 3b]. In fact, over much of the range of dispersion, can be minimized with a of . Roughly doubling the pulse width at the specimen results in halving the probability of two-photon absorption. Fig. 3Compensation of temporal dispersion. (a) Theoretical relationship between output pulse width and input pulse width , and group delay dispersion (GDD). The optimized is never obtained with the shortest , but instead increases with increasing GDD. (b) Optimal and for any one value of GDD [also indicated by thick red line in (a)]. If the laser permits, one possible strategy for mitigating the decrease in excitation efficiency due to temporal dispersion is to adjust for the measured GDD and optimized . (c) Optimization of and fluorescent signal by varying interprism length of prechirper. Temporal dispersion is maximally compensated with a prechirper length of (filled circles), implying a total system dispersion of . The calculated system dispersion is . Adjusting to this value results in maximum signal (open squares) from fluorescent beads (inset images). (Color online only.)  One possible strategy for mitigating temporal dispersion would be to select, if possible, a that minimizes . From the plot in Fig. 3a; might be suitable for the range of . In practice, however, this is not viable because the adjustments that make the laser produce such longer pulses are not conducive to high output power and stable mode locking. Indeed, adjusting the intracavity prisms for longer-than-optimal pulses resulted in a decrease in laser intensity such that we could not visualize strongly fluorescent test specimens such as beads (data not shown). Furthermore, these adjustments are not possible on sealed-box laser systems. An external means of minimizing temporal dispersion thus is necessary. A strategy for compensating for GVD involves preferentially delaying the leading photons (longer wavelengths), so that after traversal of the entire optical path, all spectral components arrive at the focal volume within the original temporal envelope, thus restoring excitation efficiency. A prism-based prechirper47 imparts negative GVD, described by where for the SF10 isosceles Brewster prisms (1B-21.6-60.6-SFIO, CVI Laser) used here. With a GVD of , an interprism length of should compensate for GDD, the aggregate theoretical dispersion imposed by the AODs and lenses. This distance is longer than is convenient for a typical optical table, so we implemented a stacked and folded design that reduces the physical path length by a factor of four.22Varying and measuring pulse width at the specimen plane, we observed a minima at [filled circular markers, Fig. 3c], close to the value predicted by the theoretical calculations. In fact, the additional length of required above that predicted from the theoretical calculations could be due to additional marginal dispersion from the microscope tube lens and the objective lens. We measured at the output of the laser and observed at the microscope objective lens specimen plane (Mini Microscope Autocorrelator, APE Berlin, Germany: autocorrelated pulse widths converted to FWHM values assuming Gaussian pulse shape). However, such a minimal residual pulse-width broadening requires only 11% more average power, which is acceptable because imaging and photolysis are not power-limited in this regime. The effects of the temporal dispersion compensation on fluorescent signal brightness is shown in the insets of Fig. 3c. The average signal (open square markers) from a fluorescent bead (Invitrogen) is maximal at and rapidly diminishes once is increased or decreased by . Temporal dispersion is a critical issue that, if not addressed, can severely degrade the ability to perform two-photon excitation, both for imaging and photolysis. With our system, there was not enough laser power to discern well-labeled neurons without temporal compensation (data not shown). We attribute this to the large amount of group velocity dispersion imparted by the numerous optical elements, particularly the AODs. In contrast, with a prism-based prechirper (C32-085 protected gold mirrors, Edmund Scientific), the original pulse width of is nearly restored and the system easily detects fluorescent neurons (see Sec. 5) and clearly resolves dendritic spines. 5.ResultsBrain slices of rat hippocampus, cerebellum, and striatum were obtained according to guidelines approved by the Institutional Animal Care and Use Committee at Baylor College of Medicine. Anesthetized Sprague Dawley rats were transcardially perfused with ice-cold solution containing (in mM): 110 ChCl, 2.5 KCl, 1.25 , 10 D-glucose, 25 , 0.5 , and 7.5 . All chemicals were obtained from Sigma-Aldrich (Saint Louis, Missouri) unless otherwise noted. Brain slices ( thick) were transferred to solution containing 125 NaCl, 2.5 KCl, 1.25 , 10 D-glucose, 25 , 2 , and 2 , 1.3 ascorbate, and 3 pyruvate for at and then at room temperature for before the imaging experiment. Visually identified neurons were patch-dialyzed with bis-FURA-2 (Invitrogen Molecular Probes) fluorescent dye solution containing (in mM) 120 Kgluconate, 20 KCl, 10 HEPES, 2 , 0.2 EGTA, 4 MgATP, 0.3 TrisATP, and 7 phosphocreatine for at least . After the initial dye-filling period, volume datasets were collected using the raster-scanning functionality of the microscope and an objective lens stepper motor (see next). In most instances, several overlapping volumes were required to capture all the dye-filled dendrites. Average laser power was modulated via the AODs to (measured at the objective lens BFA) for imaging (no pressure on MNI-Glu delivery pipette) to (slight pressure on delivery pipette) for photolysis mode. Because the caged Glu delivery system is independent of the saline perfusion system, we were able to measure that there was no observable electrophysiological effect (i.e., no changes in resting membrane potential, steady-state input resistance, or depolarization greater than the noise) due to either laser pulses delivered to the sample in the absence of MNI-Glu or to the application of MNI-Glu in the absence of laser pulses. Monitoring the neurons’ resting membrane potential and whole cell steady-state input resistance with the built-in electrophysiology protocols of our custom software (Matlab version 2007a + DAQ toolbox; The Mathworks) revealed no noticeable effects from repeated photolytic stimulation (225 stimuli dwell time at ). Examination of structural images and electrically recorded physiological traces confirm that the two-photon, multisite scanning microscope fulfills all the design requirements. The fluorescent imaging mode is capable of collecting and displaying full frame views, which allow an experimentalist to view large areas of the dendrites. It is capable of doing this over a wide variety of neuron types [Fig. 4a ] whose branching structures range from a few long branches (for example, hippocampal CA1 pyramidal neurons), a multitude of short branches (cerebellar Purkinje neurons), or sparse medium length branches (medium spiny neurons of the striatum). In all cases, branches are seen in sharp contrast with the dark background, and dendritic spines are clearly visible when the scan pattern is zoomed in [Fig. 4a, insets]. With these high quality images, the experimentalist can then confidently select photolysis sites at putative synaptic locations. With the amplitude modulation channel offered by the AOD drivers the scanner is capable of individually changing the power delivered to each site. This allows the response elicited from photolysis at each site to be graded to a experimenter-defined value. Figure 4b shows the results of this tuning procedure for four sites on a single neuron’s dendrite. At each site, the photolysis power was increased from (the data from each site are a series of circles, squares, and triangles connected by a solid line). As the power increases, the maximal recorded depolarization increases as expected. Once these curves are obtained for each site, the power required to elicit the desired response can be interpolated. The tuning curves show that from site to site, the responses are very similar, with the variation of with average laser power in the regime. This consistency was typical even across different neurons. Multisite synaptic photolysis has little advantage over bulk application of Glu unless there is spatial restriction of the Glu release. Figures 4c and 4d demonstrate that the photolysis is restricted in the lateral and axial dimensions, respectively. For these tests, a single photolysis site was placed just adjacent (within ) to a visually identified spine. To test the lateral resolution [Fig. 4c], a series of nine additional sites (ten total) were placed along an imaginary line (dotted gray line) perpendicular to the dendritic shaft. Each of the ten sites was stimulated with a delay. Then, we plot as a function of distance from the first site. The drops to less than half its largest value once the site is away from the spine head ( for spines; all pooled data are statistical mean). A similar procedure was used to demonstrate the axial resolution [Fig. 4d]. An initial site was placed just adjacent to a spine head. With the location fixed, the focus stepper motor retracted the objective lens axially in increments. At each stop, a trace was collected. The versus axial position curve shows that the response drops to less than half its largest value once the focal spot is displaced from the original focal plane ( for spines). The anisotropic focal volume shape conforms to the ellipsoid typically exhibited by a two-photon focal volume. Figure 4e shows CA1 somatic EPSPs in response to photolytic stimulation at five visually identified spine heads. The amplitude modulation at each of the five sites was individually tuned to achieve response [see Fig. 4b]. The individual EPSPs closely match the characteristic time scale and temporal shape of endogenous EPSPs. Each trace shows the result of a different intersite delay. For the top trace , each site was delayed by from the previous. The middle trace represents the response to the same five sites but delayed by , while the bottom trace represents . The , possibly important in synaptic integration, is observed for the shortest , , while there is negligible integration when the inputs are delayed by . 6.DiscussionStudying single neuron electrophysiology, and specifically synaptic integration, is a challenging task. Neurons are small, fast, and delicate, posing a significant technical hurdle in the course of measuring and manipulating them. The microscope and associated biological protocols described here fulfill many design requirements. The AODs scan the focal volume of a spectrally and temporally compensated ultrafast laser beam with enough flexibility to image dendritic spines. It can also photolyse caged Glu with the requisite speed and precision to mimic endogenous synaptic stimulation. We are currently using this system to compare multisynaptic integration in different neuron types such as pyramidal, Purkinje, and spiny neurons, and to investigate the temporal correlations between synaptic input and output firing (data not shown). There are several possible avenues for improving the instrument and/or extending its capabilities. First, most neurons grow in elaborate 3-D structures. This poses an issue for this instrument in that, while suitably fast and capable of arbitrary patterns, the scanning is confined to the focal plane. One possible improvement is to adapt the AOD scanning principle for fast, discontiguous scanning in three dimensions.48, 49 We have already built one such scanner that is optimized for imaging (but not photolysis).50 Our particular 3-D scanner design has the advantage of eliminating the need for spectral dispersion compensation at the cost of requiring more temporal dispersion compensation ( , necessitating a prechirper length of , feasible with this setup, but unwieldy). In fact, while the instrument is capable of performing a wide range of imaging applications, it cannot perform photolysis procedures without dedicated temporal compensation. Besides space and cost constraints, the main reason why we have not configured this system to scan in 3-D is that 2-D scanning is not quite so restrictive in practice. First, we typically find long sections of dendrites that do fall in the same focal plane. Judicious selection of the brain slicing angle during the dissection procedure ensures this. Furthermore, one could choose to study a subset of neurons that happen to grow in a very planar manner, such as cerebellar Purkinje neurons. We observe that the average in-focus length of a CA1 neuron dendritic branch is ( branches). Because the dendrites of medium spiny neurons grow more spherically, they are typically in focus for slightly shorter, but still usable, distances ( , five branches). It is no trouble to find Purkinje neuron branchlets in the same focal plane because of their short lengths (which are on the order of ), and we are able to image large portions of their dendritic arbors ( , nine datasets) in a single image. Second, since this AOD scanner design is capable of visiting tens of sites within a msec, the only practical limitation to the number of photolytic stimulation sites is the number of spines in any single focal plane. For the three types of neurons we tested here, we could clearly identify many spines in a single optical section of a zoom-in. We observed spine densities of (twelve branches, 264 spines), (eight branches, 89 spines), and (eight branches, 122 spines) for CA1, Purkinje, and medium spiny neurons, respectively. In combination with the focally restricted ( , laterally) photolysis we have demonstrated, we judge that having a possible site of photolytic synaptic input every would permit even the most demanding spatial summation investigations. Thus, we have found that this configuration of a 2-D laser scanner enables a wide variety of synaptic summation experiments. While the temporal compensation scheme presented here was sufficient to restore the pulse width to a point where dendritic spines could be clearly visualized, we were not able to fully return to the undispersed pulse width as measured at the output of the laser. This could be due to pulse-front tilt,51, 52, 53 where residual angular dispersion distorts the pulse group fronts so that they no longer travel strictly perpendicular to the propagation axis. This effect requires specialized equipment to faithfully measure, and once measured it is not clear how to identify the source or how to correct it. Given that the current temporal compensation scheme proved satisfactory for our purposes, we deemed it unnecessary to investigate this matter further. Along these same lines, a diffraction grating-based prechirper is a viable alternative to our prism-based scheme. With appropriate selection of groove spacing, diffraction gratings can be more dispersive than prisms and therefore would require a shorter overall path length.54, 55 One drawback of this alternative is the fact that even in the ideal case, the power throughput would suffer: in the ideal case, the grating would reflect 80%, resulting in, at best, 41% throughput in a four-pass configuration. Prisms used in the design here are much more efficient at the cost of long optical path length. Other temporal dispersion compensation schemes have been proposed. Any optical scenario where the photons on the red end of the spectrum travel farther than those on the blue end, for the appropriate distance, would provide the necessary temporal dispersion compensation. While there are reports of using other prism schemes56, 57, 58 or the spectral dispersion of the AODs themselves for this purpose,59 we judged the present design simplest and most robust. Other dispersion compensation techniques comprised of negatively dispersive mirrors60 or photonic crystal fibers61, 62 could be fruitful. Furthermore, lightly modified, off-the-shelf Ti:S lasers with built-in pulse compression (for example, Spectra-Physics’ Mai Tai DeepSee with up to at , or Coherent’s Chameleon Vision II with up to at ) might also make constructing an equivalent microscope even more straightforward. Another potential extension to this instrument is the ability to dynamically vary the focal volume size and, by extension, the resolution. One typically desires the smallest possible PSF to be able resolve small specimen details when imaging. The optimum conditions for photolysis are somewhat different. While a spatially restricted, diffraction-limited release of a neurotransmitter is generally satisfactory, it may be advantageous to have a somewhat larger focal volume for uncaging so that intersecting the postsynaptic density (PSD) of neurotransmitter receptors is more assured. At the outset of this project, we predicted that this would be a difficult issue and composed a script protocol that would systematically probe the region around the user-selected photolysis sites for the maximal response (which would presumably be the closest location to the PSD). In practice, for the three neuron types we tested, we found that with little practice, an experienced neuroscientist could place the photolysis sites accurately enough so that the optimization procedure gave negligible improvement. Still, for other neuron types with differently sized PSDs or for other photolysis applications (i.e., intracellular calcium uncaging), it may prove useful to have the ability to dynamically change the photolysis spot size. For example, at , the calyx of Held63 in the mammalian auditory nervous brain stem is one of the largest synapses in the central nervous system. The calyx of Held is composed of 300 to 700 “active zones,” approximating synaptic boutons in hippocampus and cerebellum.64 The computational relationship between the calyx of Held and its constituent active zones could be investigated by photolytically stimulating the synapse as a whole with large PSFs, followed by individual active zones with the diffraction-limited PSFs. In a similar manner, integration rules of the thorny excrescence spines65 studded along the proximal apical dendrite of hippocampal CA3 neurons might also benefit from being able to stimulate the entire protrusion in addition to just one of lobes. One restriction to creating a larger photolysis focal volume is the requirement to maintain the photon flux necessary for two-photon absorption, which is proportional to the square of the laser intensity. To maintain this probability with a focal volume whose cross sectional area doubled in size, one would need an increase in power by a factor of 4. The flexibility of AOD scanning could circumvent this requirement by rapidly dithering the diffraction-limited focal volume over the desired photolysis area, thus creating a larger virtual focal volume without increasing the power requirements above that of a well-compensated focus. Our spectral dispersion compensation scheme only fully compensates the center position: the compensation gradually degrades toward the edge of the scan pattern. To improve the spectral dispersion compensation, it might be possible to employ more sophisticated dispersion matching to precisely account for the different amounts of dispersion at different locations. One could use a fast-tunable diffraction grating for this purpose, whose deflection axis lies along the dispersion axes. One such device that could do this is an AOD. The cost in additional temporal dispersion and loss of throughput does not justify the negligible improvement in imaging resolution, however. Though several manufacturers offer multiphoton laser scanning microscopes, without considerable user modification their utility for multisite photolysis is limited. Since they are all galvanometer based, their scan speeds are limited to a few hundred frames per second and are constrained to line scan mode, not to mention the inability to dwell at user-selected sites. Since we began this project, Prairie Technologies (Middleton, Wisconsin) has introduced their Ultima system with an AOD option. The specifications indicate that it can dwell at 5 to 7 points per msec with travel time between points. This system has two drawbacks. First, because it incorporates separate imaging and uncaging laser beams, this system requires two expensive ultrafast lasers tuned to two different wavelengths. Second, with its hybrid AOD-galvanometer laser scanner, only one dimension of the scan pattern realizes the full advantages of inertia-free laser beam scanning. In multisite photolysis applications where the uncaging reaction is not rate limiting, this could prove to be a limitation. Nevertheless, this system has since been successfully used in studies of synaptic integration.2 When compared to other fast laser scanning systems, our microscope still presents several advantages. Nikolenko describe a microscope optimized for functionally mapping neural circuits.66, 67 They use a diffractive optical element to multiplex a two-photon beam to stimulate multiple neuron somata in a brain slice. The scanner then optically records the responses by monitoring somatic calcium transients. Our scanner, in contrast, is designed to investigate synaptic integration from the standpoint of a single neuron by photolyzing Glu at multiple, visually identified spines to elicit subthreshold responses (i.e., EPSPs). While we selected these optics to achieve spine-level resolution, a change to a lower magnification objective lens would permit similar investigations to those of Nikolenko With respect to the dual-scanner NIR/UV imaging/photolysis microscope described by Shoham,68 our microscope maintains a tighter photolysis focal volume deeper into scattering brain tissue due to the lesser Rayleigh scattering of NIR laser light compared to UV laser light. Furthermore, since it operates at a single wavelength, our imaging and photolysis scanner is inherently registered and requires only a single Ti:S laser.69 The ability to use a single laser coupled to a single scanning system minimizes complexity, cost, and space requirements. The results presented here demonstrate that our single-wavelength design enables sophisticated synaptic integration experiments without sacrifices in imaging or photolysis. By providing multisynaptic photolytic stimulation, this combination of an advanced multiphoton microscope and stimulation protocols is less invasive, more focal, and can be rapidly retargeted to multiple sites compared to iontophoresis pipettes4, 70 and optical fibers.71, 72 Furthermore, this system offers multisite scanning, simplicity, and cost advantages over alternative commercial and custom scanning systems. Thus, our design will enable the study of multisynaptic integration and elucidate the computational role of neuronal dendrites. ReferencesW. Rall,
“Theoretical significance of dendritic trees for neuronal input-output relations,”
Neural Theory and Modeling, 73
–97 Stanford University Press, Stanford, CA
(1964). Google Scholar
S. Gasparini, M. Migliore, and J. C. Magee,
“On the initiation and propagation of dendritic spikes in CA1 pyramidal neurons,”
J. Neurosci., 24
(49), 11046
–11056
(2004). https://doi.org/10.1523/JNEUROSCI.2520-04.2004 0270-6474 Google Scholar
B. Mel,
“Information processing in dendritic trees,”
Neurocomputing, 6 1031
–1085
(1994). 0925-2312 Google Scholar
J. Murnick, G. Dub, B. Krupa, and G. Liu,
“High-resolution iontophoresis for single-synapse stimulation,”
J. Neurosci. Methods, 116
(1), 65
–75
(2002). https://doi.org/10.1016/S0165-0270(02)00028-6 0165-0270 Google Scholar
G. McConnell, G. L. Smith, J. M. Girkin, A. M. Gurney, and A. I. Ferguson,
“Two-photon microscopy of Fura-2-loaded cardiac myocytes with an all-solid-state tunable and visible femtosecond laser source,”
Opt. Lett., 28
(19), 1742
–1744
(2003). https://doi.org/10.1364/OL.28.001742 0146-9592 Google Scholar
E. B. Brown, J. B. Shear, S. R. Adams, R. Y. Tsien, and W. W. Webb,
“Photolysis of caged calcium in femtoliter volumes using two-photon excitation,”
Biophys. J., 76
(1), 489
–499
(1999). https://doi.org/10.1016/S0006-3495(99)77217-6 0006-3495 Google Scholar
R. Wieboldt, K. R. Gee, L. Niu, D. Ramesh, B. K. Carpenter, and G. P. Hess,
“Photolabile precursors of glutamate: synthesis, photochemical properties, and activation of glutamate receptors on a microsecond time scale,”
Proc. Natl. Acad. Sci. U.S.A., 91
(19), 8752
–8756
(1994). https://doi.org/10.1073/pnas.91.19.8752 0027-8424 Google Scholar
W. Denk,
“Two-photon scanning photochemical microscopy: mapping ligand-gated ion channel distributions,”
Proc. Natl. Acad. Sci. U.S.A., 91
(14), 6629
–6633
(1994). https://doi.org/10.1073/pnas.91.14.6629 0027-8424 Google Scholar
G. Lowe,
“Flash photolysis reveals a diversity of ionotropic glutamate receptors on the mitral cell somatodendritic membrane,”
J. Neurophysiol., 90
(3), 1737
–1746
(2003). https://doi.org/10.1152/jn.00180.2003 0022-3077 Google Scholar
M. Canepari, L. Nelson, G. Papageorgiou, J. Corrie, and D. Ogden,
“Photochemical and pharmacological evaluation of 7-nitroindolinyl-and 4-methoxy-7-nitroindolinyl-amino acids as novel, fast caged neurotransmitters,”
J. Neurosci. Methods, 112
(1), 29
–42
(2001). https://doi.org/10.1016/S0165-0270(01)00451-4 0165-0270 Google Scholar
V. Parpura and P. G. Haydon,
“UV photolysis using a micromanipulated optical fiber to deliver UV energy directly to the sample,”
J. Neurosci. Methods, 87
(1), 25
–34
(1999). https://doi.org/10.1016/S0165-0270(98)00155-1 0165-0270 Google Scholar
E. Korkotian, D. Oron, Y. Silberberg, and M. Segal,
“Confocal microscopic imaging of fast UV-laser photolysis of caged compounds,”
J. Neurosci. Methods, 133
(1–2), 153
–159
(2004). https://doi.org/10.1016/j.jneumeth.2003.10.007 0165-0270 Google Scholar
U. Kubitscheck, M. Tschödrich-Rotter, P. Wedekind, and R. Peters,
“Two-photon scanning microphotolysis for three-dimensional data storage and biological transport measurements,”
J. Microsc., 182
(3), 225
–233
(1996). https://doi.org/10.1046/j.1365-2818.1996.60424.x 0022-2720 Google Scholar
R. Peters and U. Kubitscheck,
“Scanning microphotolysis: three-dimensional diffusion measurement and optical single-transporter recording,”
Methods, 18
(4), 508
–517
(1999). https://doi.org/10.1006/meth.1999.0819 1046-2023 Google Scholar
J. Clements, R. Lester, G. Tong, C. Jahr, and G. Westbrook,
“The time course of glutamate in the synaptic cleft,”
Science, 258
(5087), 1498
–1501
(1992). https://doi.org/10.1126/science.1359647 0036-8075 Google Scholar
N. I. Kiskin and D. Ogden,
“Two-photon excitation and photolysis by pulsed laser illumination modelled by spatially non-uniform reactions with simultaneous diffusion,”
Eur. Biophys. J., 30
(8), 571
–587
(2002). https://doi.org/10.1007/s00249-001-0186-y 0175-7571 Google Scholar
Y. P. Tan, I. Llano, A. Hopt, F. Wrriehausen, and E. Neher,
“Fast scanning and effcient photodetection in a simple two-photon microscope,”
J. Neurosci. Methods, 92
(1–2), 123
–135
(1999). https://doi.org/10.1016/S0165-0270(99)00103-X 0165-0270 Google Scholar
W. Göbel, B. M. Kampa, and F. Helmchen,
“Imaging cellular network dynamics in three dimensions using fast 3-D laser scanning,”
Nat. Methods, 4
(1), 73
–79
(2007). https://doi.org/10.1038/nmeth989 1548-7091 Google Scholar
J. Bewersdorf, R. Pick, and S. W. Hell,
“Multifocal multiphoton microscopy,”
Opt. Lett., 23
(9), 655
–657
(1998). https://doi.org/10.1364/OL.23.000655 0146-9592 Google Scholar
R. Salomé, Y. Kremer, S. Dieudonné, J. F. Léger, O. Krichevsky, C. Wyard, D. Chatenay, and L. Bourdieu,
“Ultrafast random-access scanning in two-photon microscopy using acousto-optic deectors,”
J. Neurosci. Methods, 154
(1–2), 161
–174
(2006). https://doi.org/10.1016/j.jneumeth.2005.12.010 0165-0270 Google Scholar
C. Xu, W. Zipfel, J. B. Shear, R. M. Williams, and W. W. Webb,
“Multiphoton fluorescence excitation: new spectral windows for biological nonlinear microscopy,”
Proc. Natl. Acad. Sci. U.S.A., 93
(20), 10763
–10768
(1996). https://doi.org/10.1073/pnas.93.20.10763 0027-8424 Google Scholar
V. Iyer, B. E. Losavio, and P. Saggau,
“Compensation of spatial and temporal dispersion for acousto-optic multiphoton laser-scanning microscopy,”
J. Biomed. Opt., 8
(3), 460
–471
(2003). https://doi.org/10.1117/1.1580827 1083-3668 Google Scholar
J. D. Lechleiter, D. T. Lin, and I. Sieneart,
“Multi-photon laser scanning microscopy using an acoustic optical deector,”
Biophys. J., 83
(4), 2292
–2299
(2002). https://doi.org/10.1016/S0006-3495(02)73989-1 0006-3495 Google Scholar
M. Göppért-Mayer,
“Über elementarakte mit zwei quantensprüngen,”
Ann. Phys., 9 273
–295
(1931). https://doi.org/10.1002/andp.19314010303 0003-3804 Google Scholar
Confocal and Two-Photon Microscopy: Foundations, Applications and Advances, John Wiley and Sons Ltd., New York
(2001). Google Scholar
P. Hockberger, T. Skimina, V. Centonze, C. Lavin, S. Chu, S. Dadras, J. Reddy, and J. White,
“Activation of avin-containing oxidases underlies lightinduced production of H2O2 in mammalian cells,”
Proc. Natl. Acad. Sci. U.S.A., 96
(11), 6255
–6260
(1999). https://doi.org/10.1073/pnas.96.11.6255 0027-8424 Google Scholar
N. Kiskin, R. Chillingworth, J. A. McCray, D. Piston, and D. Ogden,
“The effciency of two-photon photolysis of a caged fluorophore, o-1-(2-nitrophenyl)ethylpyranine, in relation to photodamage of synaptic terminals,”
Eur. Biophys. J., 30
(8), 588
–604
(2002). https://doi.org/10.1007/s00249-001-0187-x 0175-7571 Google Scholar
E. M. Callaway and L. C. Katz,
“Photostimulation using caged glutamate reveals functional circuitry in living brain slices,”
Proc. Natl. Acad. Sci. U.S.A., 90
(16), 7661
–7665
(1993). https://doi.org/10.1073/pnas.90.16.7661 0027-8424 Google Scholar
M. Matsuzaki, N. Honkura, G. C. R. Ellis-Davies, and H. Kasai,
“Structural basis of long-term potentiation in single dendritic spines,”
Nature (London), 429
(6993), 761
–766
(2004). https://doi.org/10.1038/nature02617 0028-0836 Google Scholar
A. Bullen, S. S. Patel, and P. Saggau,
“High-speed, random-access uorescence microscopy: I. High-resolution optical recording with voltage-sensitive dyes and ion indicators.,”
Biophys. J., 73
(1), 477
–491
(1997). https://doi.org/10.1016/S0006-3495(97)78086-X 0006-3495 Google Scholar
A. Bullen and P. Saggau,
“High-speed, random-access uorescence microscopy: II. Fast quantitative measurements with voltage-sensitive dyes,”
Biophys. J., 76
(4), 2272
–2287
(1999). https://doi.org/10.1016/S0006-3495(99)77383-2 0006-3495 Google Scholar
E. I. Gordon,
“A review of acoustooptical deection and modulation devices,”
Appl. Opt., 5
(10), 1629
–1639
(1966). https://doi.org/10.1364/AO.5.001629 0003-6935 Google Scholar
, Private Communication. Google Scholar
W. R. Zipfel, R. M. Williams, and W. W. Webb,
“Nonlinear magic: multiphoton microscopy in the biosciences,”
Nat. Biotechnol., 21
(11), 1369
–1377
(2003). https://doi.org/10.1038/nbt899 1087-0156 Google Scholar
B. M. Palmer and R. L. Moore,
“Excitation wavelengths for Fura 2 provide a linear 27 relationship between [Ca2+] and fluorescence ratio,”
Am. J. Physiol.: Cell Physiol., 279
(4), 1278
–1284
(2000). 0363-6143 Google Scholar
D. L. Wokosin, C. M. Loughrey, and G. L. Smith,
“Characterization of a range of Fura dyes with two-photon excitation,”
Biophys. J., 86
(3), 1726
–1738
(2004). https://doi.org/10.1016/S0006-3495(04)74241-1 0006-3495 Google Scholar
E. Neher,
“The use of fura-2 for estimating Ca buffers and Ca fluxes,”
Neuropharmacology, 34
(11), 1423
–1442
(1995). https://doi.org/10.1016/0028-3908(95)00144-U 0028-3908 Google Scholar
J. Magee and D. Johnston,
“Characterization of single voltage-gated Na+ and Ca2+ channels in apical dendrites of rat CA1 pyramidal neurons,”
J. Physiol. (London), 487
(1), 67
–90
(1995). 0022-3751 Google Scholar
L. Nowak, P. Bregestovski, P. Ascher, A. Herbet, and A. Prochiantz,
“Magnesium gates glutamate-activated channels in mouse central neurones,”
Nature (London), 307
(5950), 462
–465
(1984). https://doi.org/10.1038/307462a0 0028-0836 Google Scholar
R. Dingledine, K. Borges, D. Bowie, and S. F. Traynelis,
“The glutamate receptor ion channels,”
Pharmacol. Rev., 51
(1), 7
–62
(1999). 0031-6997 Google Scholar
D. Li, S. Zeng, X. Lv, J. Liu, R. Du, R. Jiang, W. R. Chen, and Q. Luo,
“Dispersion characteristics of acousto-optic deector for scanning gaussian laser beam of femtosecond pulses,”
Opt. Express, 15
(8), 4726
–4734
(2007). https://doi.org/10.1364/OE.15.004726 1094-4087 Google Scholar
C. Soeller and M. B. Cannell,
“Construction of a two-photon microscope and optimisation of illumination pulse duration,”
Eur. J. Physiol., 432
(3), 555
–561
(1996). https://doi.org/10.1007/s004240050169 0031-6768 Google Scholar
C. Soeller and M. B. Cannell,
“Two-photon microscopy: imaging in scattering samples and three-dimensionally resolved ash photolysis,”
Microsc. Res. Tech., 47
(3), 182
–195
(1999). https://doi.org/10.1002/(SICI)1097-0029(19991101)47:3<182::AID-JEMT4>3.0.CO;2-4 1059-910X Google Scholar
K. Kuba and S. Nakayama,
“Two-photon laser-scanning microscopy: tests of objective lenses and Ca2+ probes,”
Neurosci. Res. (NY), 32
(3), 281
–294
(1998). 0077-7846 Google Scholar
A. C. Millard, D. N. Fittinghoff, J. A. Squier, and M. Müller,
“Spatial and temporal characterization of the focusing of ultrashort pulses by high-NA objectives for ultrafast multiphoton microscopy,”
Proc. SPIE, 3616 76
–85
(1999). https://doi.org/10.1117/12.351823 0277-786X Google Scholar
M. Müller, J. Squier, R. Wolleschensky, U. Simon, and G. J. Brakenhoff,
“Dispersion precompensation of 15 femtosecond optical pulses for high-numerical-aperture objectives,”
J. Microsc., 191
(2), 141
–150
(1998). https://doi.org/10.1046/j.1365-2818.1998.00357.x 0022-2720 Google Scholar
R. L. Fork, O. E. Martinez, and J. P. Gordon,
“Negative dispersion using pairs of prisms,”
Opt. Lett., 9
(5), 150
–152
(1984). https://doi.org/10.1364/OL.9.000150 0146-9592 Google Scholar
M. E. Durst, G. Zhu, and C. Xu,
“Simultaneous spatial and temporal focusing for axial scanning,”
Opt. Express, 14
(25), 12243
–12254
(2006). https://doi.org/10.1364/OE.14.012243 1094-4087 Google Scholar
A. Kaplan, N. Friedman, and N. Davidson,
“Acousto-optic lens with very fast focus scanning,”
Opt. Lett., 26
(14), 1078
–1080
(2001). https://doi.org/10.1364/OL.26.001078 0146-9592 Google Scholar
G. D. Reddy, K. Kelleher, R. Fink, and P. Saggau,
“Three-dimensional random access multiphoton microscopy for functional imaging of neuronal activity,”
Nat. Neurosci., 11
(6), 713
–720
(2008). https://doi.org/10.1038/nn.2116 1097-6256 Google Scholar
S. Akturk, M. Kimmel, P. O’Shea, and R. Trebino,
“Measuring pulse-front tilt in ultrashort pulses using grenouille,”
Opt. Express, 11
(5), 491
–501
(2003). 1094-4087 Google Scholar
S. Akturk, M. Kimmel, P. O’Shea, and R. Trebino,
“Measuring spatial chirp in ultrashort pulses using single-shot frequency-resolved optical gating,”
Opt. Express, 11
(1), 68
–78
(2003). 1094-4087 Google Scholar
P. Gabolde, D. Lee, S. Akturk, and R. Trebino,
“Describing first-order spatio-temporal distortions in ultrashort pulses using normalized parameters,”
Opt. Express, 15
(1), 242
–251
(2007). https://doi.org/10.1364/OE.15.000242 1094-4087 Google Scholar
E. Treacy,
“Optical pulse compression with diffraction gratings,”
IEEE J. Quantum Electron., 5
(9), 454
–458
(1969). https://doi.org/10.1109/JQE.1969.1076303 0018-9197 Google Scholar
D. N. Fittinghoff, W. A. Molander, and C. P. J. Barty,
“Hyperdispersion grating arrangements for compact pulse compressors and expanders,”
Frontiers in Optics, Optical Society of America, Washington, D.C. Google Scholar
S. Akturk, X. Gu, M. Kimmel, and R. Trebino,
“Extremely simple single-prism ultrashort- pulse compressor,”
Opt. Express, 14
(21), 10101
–10108
(2006). https://doi.org/10.1364/OE.14.010101 1094-4087 Google Scholar
K. Bi, S. Zeng, S. Xue, J. Sun, X. Lv, D. Li, and Q. Luo,
“Position of the prism in a dispersion-compensated acousto-optic deflector for multiphoton imaging,”
Appl. Opt., 45
(33), 8560
–8565
(2006). https://doi.org/10.1364/AO.45.008560 0003-6935 Google Scholar
S. Zeng, X. Lv, C. Zhan, W. R. Chen, W. Xiong, S. L. Jacques, and Q. Luo,
“Simultaneous compensation for spatial and temporal dispersion of acoustooptical deectors for two-dimensional scanning with a single prism,”
Opt. Lett., 31
(8), 1091
–1093
(2006). https://doi.org/10.1364/OL.31.001091 0146-9592 Google Scholar
S. Zeng, X. Lv, K. Bi, C. Zhan, D. Li, W. R. Chen, W. Xiong, S. L. Jacques, and Q. Luo,
“Analysis of the dispersion compensation of acusto-optic deflectors used for multiphoton imaging,”
J. Biomed. Opt., 12
(2), 024015
(2007). https://doi.org/10.1117/1.2714061 1083-3668 Google Scholar
I. Walmsley, L. Waxer, and C. Dorrer,
“The role of dispersion in ultrafast optics,”
Rev. Sci. Instrum., 72
(1), 1
–29
(2001). https://doi.org/10.1063/1.1330575 0034-6748 Google Scholar
L. F. Mollenauer,
“Nonlinear optics in fibers,”
Science, 302
(5647), 996
–997
(2003). https://doi.org/10.1126/science.1091168 0036-8075 Google Scholar
B. Zsigri, J. Laegsgaard, and A. Bjarklev,
“A novel photonic crystal fibre design for dispersion compensation,”
J. Opt. A, Pure Appl. Opt., 6
(7), 717
–720
(2004). https://doi.org/10.1088/1464-4258/6/7/010 1464-4258 Google Scholar
H. Held,
“Die centrale gehörleitung,”
Arch. Anat. Physiol. Anat. Abt.,
(1893) Google Scholar
R. Schneggenburger and I. D. Forsythe,
“The calyx of Held,”
Cell Tissue Res., 326
(2), 311
–337
(2006). https://doi.org/10.1007/s00441-006-0272-7 0302-766X Google Scholar
M. E. Chicurel and K. M. Harris,
“Three-dimensional analysis of the structure and composition of CA3 branched dendritic spines and their synaptic relationships with mossy fiber boutons in the rat hippocampus,”
J. Comp. Neurol., 325
(2), 169
–182
(1992). https://doi.org/10.1002/cne.903250204 0021-9967 Google Scholar
V. Nikolenko, K. Poskanzer, and R. Yuste,
“Two-photon photostimulation and imaging of neural circuits,”
Nat. Methods, 4
(11), 943
–950
(2007). https://doi.org/10.1038/nmeth1105 1548-7091 Google Scholar
V. Nikolenko, B. O. Watson, R. Araya, A. Woodruff, D. S. Peterka, and R. Yuste,
“SLM microscopy: scanless two-photon imaging and photostimulation with spatial light modulators,”
Front. Neural Circ., 2
(5), 1
–14
(2008). Google Scholar
S. Shoham, D. H. O’Connor, D. V. Sarkisov, and S. S. H. Wang,
“Rapid neurotransmitter uncaging in spatially defined patterns,”
Nat. Methods, 2
(11), 837
–843
(2005). https://doi.org/10.1038/nmeth793 1548-7091 Google Scholar
P. J. Helm, O. Franksson, and K. Carlsson,
“A confocal scanning laser microscope for quantitative ratiometric 3D measurements of [Ca2+] and Ca2+ diffusions in living cells stained with Fura-2,”
Eur. Biophys. J., 429
(5), 672
–681
(1995). 0175-7571 Google Scholar
S. Cash and R. Yuste,
“Linear summation of excitatory inputs by CA1 pyramidal neurons,”
Neuron, 2
(9), 383
–394
(1999). https://doi.org/10.1016/S0896-6273(00)81098-3 0896-6273 Google Scholar
D. Pettit, S. Wang, K. Gee, and G. Augustine,
“Chemical two-photon uncaging: a novel approach to mapping glutamate receptors,”
Neuron, 19
(3), 465
–471
(1997). https://doi.org/10.1016/S0896-6273(00)80361-X 0896-6273 Google Scholar
D. L. Pettit and G. J. Augustine,
“Distribution of functional glutamate and GABA receptors on hippocampal pyramidal cells and interneurons,”
J. Neurophysiol., 84
(1), 28
–38
(2000). 0022-3077 Google Scholar
|


