|
|
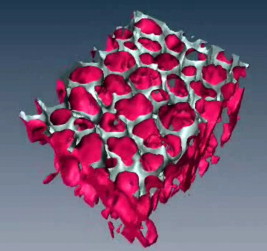
1.IntroductionAcute lung injury (ALI), acute respiratory distress syndrome (ARDS),1, 2 and mechanical-ventilation-induced lung injury (VILI)3 still have a high mortality rate of about 32 to 45%1 and an annual incidence of 75 out of 100,000 inhabitants in Germany.4 It is therefore important to develop and improve gentle protective ventilation strategies5 that do not produce VILI or worsen a pre-existing ALI or ARDS. Although past work has relied only on large clinical trials to determine the benefits of particular strategies, numerical models of the lung, especially of the alveolar structures, have the potential to aid developing and testing new protective strategies. One fundamental requirement for developing a numerical model is the quantification of alveolar geometries of whole acinus as close to an in vivo situation as possible.6, 7 However, in vivo imaging of 3-D alveolar geometries has proved to be difficult due to the limitations in resolution and penetration depth presented by established imaging modalities. Intravital microscopy (IVM),8 the most established imaging technique for in vivo characterization of alveolar structures, allows high-resolution and real-time imaging, but provides no 3-D datasets.9 Confocal laser scanning microscopy provides a sufficient resolution, but is hampered by less penetration depth into tissue of approximately to image whole acinus with hundreds of microns in diameter.10 Ultrasound systems and computed tomography do not offer adequate resolution for imaging alveoli with a dimension of approximately in diameter.11 Optical coherence tomography (OCT),12 on the other hand, is a high-resolution and contact-free imaging technique based on interferometry that allows acquiring 3-D datasets. We previously demonstrated that OCT is a useful tool to image subpleural lung parenchyma in 2-D cross sectional images,13 and carried out 3-D imaging of lung tissue in isolated lungs and in vivo models.14, 15 OCT imaging of air-filled lung tissue is hampered by the penetration depth (approximately ) to image whole enclosed alveoli. The limitation is caused by the air tissue interface. In deeper areas of the alveoli, the different refraction indices lead to total reflection at the interface between lung tissue and air, resulting in pseudostructures in the OCT datasets, which were observed in previous studies. Hence, we present a novel method to perform 3-D imaging of whole enclosed alveoli by using index matching after perfusion fixation with glutaraldehyde (GA) in isolated rabbit lungs. 2.Methods and Materials2.1.Isolated, Perfused, and Ventilated Rabbit Lung ModelBriefly, female New Zealand White rabbits weighing were used and all experiments were performed in accordance with the Guide for the Care and Use of Laboratory Animals (Institute of Laboratory Animal Resources, 7th edition, National Academy Press, Washington, DC). The model of isolated, perfused, and ventilated rabbit lungs is described in detail elsewhere.16 The left ventricle was cannulated and the catheter for perfusion flow was placed in the truncus pulmonalis. For perfusion outflow, the aorta was cannulated, the aortic and bicuspid valves were disrupted, and the catheter was placed in the left atrium [Fig. 1b ]. The outflow catheter was positioned so that the pressure in the left atrium did not exceed to avoid pulmonary edema. Additionally, a small catheter was placed in the inflow catheter to measure the pressure in the truncus pulmonalis. The scheme of the setup is shown in Fig. 1a. Additionally, we applied a second perfusion cycle for glutaraldehyde fixation and ethanol filling to prevent contamination of the primary perfusion cycle with toxic glutaraldehyde and ethanol. The cannulated aorta ensures a controlled change between both perfusion cycles. Physiologically relevant parameters (pulmonary pressure, pulmonary flow, blood pressure, pH, and temperature of perfusion fluid) were continuously monitored and acquired. The setup allows 3-D image acquisition of several parts of the lung by IVM and OCT. Furthermore, through a three-way-valve, constant air flow can be conducted to the lung to apply the required continuous positive airway pressure (CPAP). Fig. 1(a) Setup of the isolated, perfused, and ventilated lung model. Two perfusion cycles (PR is the perfusion reservoir and FR is the fixation reservoir) prevent contamination of the perfusion cycle with toxic fixation substances. Both cycles include filters (F) and air trapping (AT). Peristaltic pumps (P1, P2, and P3) provide the perfusate, fixation substance, and ethanol. The ventilator (V) is used for artificial respiration during preparation, and constant air flow through a positive end-expiratory pressure (PEEP) valve (PV) can be coupled to a three-way valve (TWV) to generate controlled CPAP. Sensors 1 through 5 measure pulmonary flow (1), pulmonary pressure (2), arterial pressure (3), perfusate temperature (4), and perfusate (5). (b) This image shows a detailed view of the isolated lung and heart. The trachea (T), the catheter in the aorta (A), and the catheter in the truncus pulmonalis (P) are indicated.  2.2.Glutaraldehyde FixationFixation was carried out with a mixture of 1.5% glutaraldehyde (GA), 1.5% paraformaldehyde, and HEPES solution ( , ).17 The lung was perfused with fixation solution for with an initial rate of after changing the perfusion cycle. During fixation, a CPAP of was applied. The perfusion rate was varied to hold the last measured arterial pressure of . 2.3.Ethanol FillingThe fixed lung was perfused with increasing concentrations of ethanol in HEPES buffer ( 20% ethanol, 50%, 70%, and 95%) and finally recirculated with 100% ethanol. The perfusion rate was again varied to hold the last arterial pressure constant. Ethanol dissolves the lipids in the membranes of all structures of the lung parenchyma, consequently leading to membrane porosity. The series of increasing ethanol concentrations was used to slow down this dissolving process, which results in slow streaming of ethanol into the air-filled parts of the lung through the porose membranes and extracellular interspaces. Because of bottom-up ethanol filling procedure, (Fig. 2 ) the alveolar air can completely exhaust through the trachea. Fig. 2This image sequence shows the isolated and perfused rabbit lung for (a) an applied CPAP of , (b) after fixation with GA and half filled with ethanol during perfusion with ethanol 95% in concentration, and (c) after completed ethanol filling. In (b), the slow bottom-up filling procedure can be recognized with the borderline (arrow) between the upper air-filled parts of the lung and the lower parts already filled with ethanol. 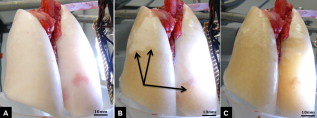 2.4.Three-Dimensional Fourier Domain Optical Coherence Tomography and Intravital Microscopy SetupWe used a combined OCT and IVM setup that allows simultaneous acquisition of 2-D IVM images and 3-D OCT datasets from a single lung sample (Fig. 3 ). The FDOCT18, 19 system incorporates a superluminescence diode with a center wavelength of and a full width at half maximum (FWHM) of with an optical power of . The near-infrared light is transmitted to the scanner head by a single mode optical fiber and converted into a free-space beam by a collimator. The scanner contains all components of the interferometer and optical components of the intravital microscope. In the scanner head, the optical beam is divided into a reference and sample beam by a beamsplitter. The sample beam is deflected by two galvanometer scanners in the and direction to scan the lung tissue. Backscattered light from the sample returns the same way to the beamsplitter where it is superimposed with the reference light. The interfering light is transmitted by an optical fiber to a spectrometer, where it is spectrally resolved. The interference spectrum is acquired by a charge-coupled device (CCD) line detector with a pixel rate of . The corresponding depth information is calculated from the detected spectrum by Fourier transformation. The system provides a resolution of and about in the axial and lateral direction in air, respectively. Because of the high A-scan rate of , only are required to record a 3-D OCT dataset of of subpleural lung parenchyma. The light for IVM imaging is separated by a dichroic mirror from the OCT sample light (Fig. 3). A video camera is used for IVM. The IVM optics provides four-fold magnification as well as real-time imaging because of the high pixel clock of . Fig. 3Setup of the scanner head for simultaneous 3-D OCT and IVM imaging. The light is coupled into the interferometer by a collimator (C), then the light is divided by a beam splitter (BS) into reference and sample beams. The reference beam is focused by L1 to the reference mirror (RM). The sample beam is deflected by a galvanometer scanner unit ( GU) in the and directions and focused by the lens (L2) on the sample. The backscattered and reference light are superimposed at the BS and transmitted to the spectrometer by a single mode fiber (SMF). The intravital microscope is adapted by a dichroic mirror (DM) placed between L2 and GU in the sample beam. The objective (L3/L4) focuses the visible light to the video camera (VC) and allows a four-fold magnification. The sample illumination for IVM is carried out by a ring light placed in front of the scanner head above the sample.  2.5.Image Acquisition3-D OCT datasets and 2-D IVM images were acquired of the identical alveolar structures before perfusion fixation, and then postfixation with either an applied CPAP of and after ethanol filling. 2.6.Image QuantificationIVM images were manually segmented. To encircle the air-filled regions in the IVM images (Fig. 4 ), the bright reflections were traced using a tablet PC and Adobe Photoshop software. The number of encircled pixels was measured and converted to a area for each alveolus. From the 3-D OCT dataset, en-face images (Fig. 4) were extracted using AMIRA medical imaging software (Visage Imaging, San Diego, California). These images represent a 2-D cross section of approximately beneath and parallel to the pleura. The subpleural depth of was chosen because the best correlation between both techniques was observed at this sectional plane. The OCT en-face images were filtered by a 3-D median to reduce the speckle artifacts typical for OCT images. The processed OCT en-face images were automatically (LabVIEW/National Instruments Vision Assitant, National Instruments, Austin, Texas) segmented by a threshold algorithm and the single alveolar areas were quantified. The statistical analysis was carried out by GraphPad Prism software (LaJolla, California). Fig. 4This image sequence compares OCT en-face and IVM images under CPAP conditions, after perfusion fixation and ethanol filling. All five images show the same subpleural alveolar structure. Obvious structural changes during perfusion fixation are not detected in OCT and IVM images. Alveolar structures cannot be acquired by IVM because of missing diffraction index interfaces in ethanol-filled lung tissue. An image is therefore not provided here due to the reduced contrast. The scale bar is .  2.7.Scanning Electron MicroscopyDehydration in a graded series of ethanol, critical point drying with liquid (E3000, Gala Instruments, Schwalbach, Germany), and sputtering with gold in a Balzers (Liechtenstein, Germany) MED010 sputtercoater ( , ) was performed. Specimens were studied with a LEO 5430 scanning electron microscope. 3.ResultsBriefly, Fig. 2 shows that the performed method of GA perfusion fixation following ethanol filling does not lead to an evident distortion of the isolated lung caused by gravitational force. The figure shows an isolated lung for a CPAP of [Fig. 2a] and after complete a filling procedure [Fig. 2c], whereas only a very small stretch due to the increased weight of the ethanol-filled lung can be recognized. The presented filling method is a bottom-up process, which is evidenced by Fig. 2b. The borderline between already ethanol-filled and still air-filled parts of the isolated lung can be clearly observed. Additionally, Fig. 2c demonstrates that the complete alveolar air is exchanged by ethanol without air bubbles remaining inside the alveolar space. 3.1.Perfusion Fixation with GlutaraldehydeA representative OCT and IVM image sequence of subpleural lung parenchyma is shown in Fig. 4. OCT en-face images were taken first while applying CPAP, then after GA perfusion fixation, and finally, after the parenchyma was completely ethanol-filled (Fig. 4, upper panel). Identical structures acquired by IVM are also shown (Fig. 4, lower panel). An IVM image of the ethanol-filled lung is not shown because its low contrast provides no information about the alveoli. We observed no significant change in alveolar area when comparing either OCT or IVM images taken under CPAP conditions to those taken after GA fixation. Quantification of alveolar area measured by OCT and IVM of single alveoli also showed no significant changes during perfusion fixation with the GA solution (Fig. 5 ). Fig. 5Alveolar areas measured by OCT (checkered, isolated lungs) for applied CPAP after perfusion fixation and after postperfusion ethanol filling. The alveolar areas measured by IVM are given for CPAP conditions and after perfusion fixation (striped). The areas were normalized to areas measured before fixation. After the fixation process, a significant change in area of the subpleural alveoli was not detected. Using OCT, we found a significant increase of approximately 18% in alveolar area in ethanol-filled lungs. Due to the low contrast in the IVM images after ethanol-filling, no data could be extracted.  3.2.Ethanol FillingFilling alveoli with ethanol completely removed the alveolar air, a perfect precondition for using optical imaging such as OCT. The ethanol filling induced no stretching of the lung parenchyma, because the tissue was stabilized by prior fixation. The advantage of imaging tissue without air/tissue interfaces was clearly seen when comparing OCT cross sections of air-filled [Fig. 6a ] and ethanol-filled subpleural lung tissue [Fig. 6b]. There was a noticeably higher penetration depth into the tissue and better differentiation between alveolar spaces (ethanol-filled spaces) and walls. In ethanol-filled lung tissue, it was possible to image the medial boundaries of alveoli and alveolar clusters. We define the alveolar cluster as a formation of some coupled alveoli. Additionally, up to four layers of subpleural alveoli (maximum ) could be imaged in an ethanol-filled lung, whereas only the first layer (maximum ) of subpleural alveoli could be observed in an air-filled lung (Fig. 6). In the OCT en-face images of ethanol-filled lung displayed in Fig. 4, the alveolar walls are finely defined in contrast to the air-filled en-face images. The obviously increased alveolar area measured in OCT images of ethanol-filled lungs was approximately 18% , greater than that for lung under CPAP. This can most likely be attributed to better definition of the alveolar walls in the images from ethanol-filled lung. Fig. 6OCT cross section of (a) air-filled ( CPAP) and (b) ethanol-filled subpleural lung tissue. Improved penetration depth and reduced speckle artifacts can be seen in ethanol-filled tissue. The images were taken from different lung samples. In contrast to air-filled tissue, the alveolar acinus lower bound can be imaged and the alveolar walls can be solved with more precision in ethanol-filled lung tissue. The scale bar is .  3.3.Three-Dimensional ReconstructionSegmentation of alveoli and alveolar walls was achieved using 3-D OCT datasets from ethanol-filled lung that had previously undergone perfusion fixation. Figure 7 shows several views of surface rendering based on segmentation of the OCT datasets. Figure 7a, Videos 1, and Videos 2 shows a reconstruction of a cube of subpleural lung tissue, in which the pleura has been removed by a surface cut approximately below to provide a better view into the reconstructed tissue. An overlay of the segmentation of the alveolar walls (red) and one single alveolar cluster (purple) is also shown. Segmentation of a single alveolar cluster alone is shown in Figs. 7b and 7c Videos 3 . Our reconstruction was detailed enough to observe intra-alveolar connections (IAC) between several alveoli in the rabbit lung [Fig. 8a ]. These connections we also observed in electron microscopy images [Fig. 8b]. Fig. 7Three-dimensional reconstruction and surface generation based on a 3-D OCT dataset ). (a) Segmentation of the alveolar walls (red). For a better view inside the alveolar structures, the 3-D OCT image stack is cut using the cutting plane (dashed line) shown in the 2-D OCT image in Videos 1 and Videos 2. One alveolar cluster is shown in overlay (purple). (b) and (c) show 3-D reconstruction of the identical alveolar cluster: (b) view from the pleura side and (c) from inside the lung (endoscopic view). (Color online only.) 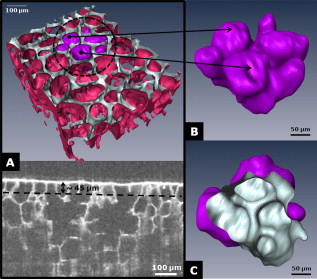 Fig. 8(a) A close-up of the segmented alveolar walls [OCT in Fig. 7a] showing intra-alveolar connections/contacts (IAC). These IAC were seen in all measured isolated rabbit lungs, but not in every alveolus. The IAC are about in diameter. (b) Scanning electron microscopy image of subpleural alveolar tissue also showing IAC.  Video 1Three-dimensional reconstruction of ethanol-filled subpleural alveolar tissue, fly through animation (QuickTime, 659.36 KB). .  3.4.Air Bubble PhantomsTwo simple phantoms were created to study the impact of reflection and refraction at the air/surface interface. An agarose gel stick in water was used to represent the fluid- or ethanol-filled alveoli, which have a low difference in diffraction index at the interface, and an air bubble in olive oil was used to represent air-filled alveoli, which have a high difference. Simulation of the agarose gel stick resulted in a nearly realistic geometry, with only a small axial stretch (Fig. 9, top left). In contrast, the air bubble showed two disjunctive semicircles, the upper one larger in diameter than the lower (Fig. 9, top right). The upper semicircle corresponds to the simulation of the agarose gel stick, but the lower one is deformed because of refraction effects at the olive oil/air interface that cause pseudo-OCT images. The simulation agreed with our measurements taken from OCT cross sections of these two phantoms [Figs. 9a and 9b]. It is clearly recognizable in the images in Fig. 9 that the agarose gel stick has a nearly realistic geometry, while the air bubble differs from its true geometry. In both the phantom simulation and measurement, we observed an increase in equatorial area of about 26% from air-bubble to turbid agarose gel stick. The overlap of the two semicircles [Fig. 9c] in the equatorial plane resulted in a double-wall structure in the OCT en-face images. The effect of the doubled walls (white arrows) in OCT en-face images of air-filled lung tissue is shown in Fig. 8c. In the equatorial plane of the alveoli, the alveolar walls were formed as two concentric boundaries [Fig. 9b]. Fig. 9This image sequence illustrates the artifacts in OCT images caused by air/tissue interfaces. Upper panel: simulated OCT cross sections of a turbid agarose gel stick (left) and air bubble (right) surrounded by olive oil to demonstrate image generation for fluid and air-filled alveoli. OCT cross sections of the phantom measurements of an (a) optical turbid agarose gel stick and (b) air bubble in olive oil. (c) OCT en-face image showing the artifacts caused by the air/tissue interfaces that result in pseudodoubled alveolar walls (white arrows).  4.Discussion and ConclusionQuantification of OCT images acquired during fixation showed no significant change in alveolar structure and size. We can ascertain that an isolated lung fixed by perfusion with GA yields the same alveolar geometries when measured by OCT as an isolated lung with CPAP. Quantification of IVM images also revealed no significant change in alveolar areas during fixation. Any possible changes in alveolar structure would have to be smaller than the resolution of our OCT and IVM system. We demonstrate that the perfusion of a fixed lung with an ethanol series of increasing concentration removes all alveolar air from the lung because of the bottom-up filling process. In contrast to the top-down endotracheal instilling of fluids, we ensure that absolutely no alveolar air is remaining in the subpleural alveolar space. Therefore, the imaging artifacts and the limited penetration depth (caused by air-tissue interfaces) of OCT imaging can be eliminated. Using this index matching procedure, we are able to perform 3-D OCT imaging of enclosed alveoli and even whole alveolar clusters. This index matching method could also be a useful tool for other 3-D optical imaging techniques. In contrast to other 3-D imaging techniques, e.g., electron microscopy or laser scanning microscopy, we can acquire 3-D datasets of lung tissue without shrinkage of the tissue during the complex sample preparations and without dyes. The major advantage, compared to previous studies, is the much higher penetration depth into the subpleural alveolar tissue with an improved resolution, allowing the acquisition of alveolar clusters.13, 20 However, we had to concede that the acquired 3-D datasets do not represent an in vivo air-filled situation, because the ethanol filling destroys the lipid membrane so the cells and the surfactant layer (and therefore the surface tension of the alveoli) is negatively influenced. Because of the limited resolution of the OCT, we cannot exclude that there are minor changes in alveolar morphology. Other studies using higher resolution imaging modalities also induce marginal alveolar morphologic changes by using cover slips or perform an intra-alveolar injection of dyes.10, 20 We further show that OCT datasets acquired from an ethanol-filled lung are suitable for segmentation and reconstruction of subpleural lung tissue and even whole enclosed alveolar clusters. The reconstructed structures do not represent an in vivo situation, because the lungs are not air-filled and the surfactant layer is destroyed, but for all that we believe that the reconstructed structures are quite similar to the CPAP situation, because we detect only minor morphologic changes between CPAP, fixation, and after ethanol filling. Therefore, we think these 3-D OCT datasets could be useful for developing numerical models of the lung on the level of alveoli, as an orientation about the alveolar geometry. We detect intra-alveolar connections in the 3-D reconstructions in all rabbit lungs, and we suggest that these are pores of Kohn. We observe these pores in 3-D OCT datasets with only minor morphologic changes compared to laser scanning or electron microscopy in usually fixed tissue involved with shrinkage artifacts.13 The geometrical errors in OCT images of air-filled alveoli are caused by refraction and total reflection of the measurement beam, and can be avoided by filling the alveolar pockets with ethanol, which functions as an index-matching fluid. We believe that the ethanol-filling process does not change the alveolar structure significantly, because the observed alveolar area increase can be attributed to the elimination of beam distortion by index matching. The difference of about 8% in alveolar increase between the spherical ray-tracing model and the actual effect in real alveoli can be explained by the nonspherical shape of alveoli, which are flattened toward the pleura, and an erroneous broadening of the alveolar walls by beam distortion at the air-tissue interfaces. AcknowledgmentThis project was supported by the German Research Foundation (DFG) “Protective artificial respiration” (PAR)—KO 1814/6-1. ReferencesK. F. Udobi, E. Childs, and K. Touijer,
“Acute respiratory distress syndrome,”
Am. Fam. Physician, 67 315
–322
(2003). 0002-838X Google Scholar
A. P. Wheeler and G. R. Bernard,
“Acute lung injury and the acute respiratory distress syndrome: a clinical review,”
Lancet, 369
(9572), 1553
–1564
(2007). https://doi.org/10.1016/S0140-6736(07)60604-7 0140-6736 Google Scholar
J. A. Frank and M. A. Matthay,
“Science review: mechanisms of ventilator-induced injury,”
Crit. Care, 7 233
–241
(2003). https://doi.org/10.1186/cc1829 1364-8535 Google Scholar
L. B. Ware and M. A. Matthay,
“The acute respiratory distress syndrome,”
N. Engl. J. Med., 342 1334
–1349
(2000). https://doi.org/10.1056/NEJM200005043421806 0028-4793 Google Scholar
Acute Respiratory Distress Syndrome Network,
“Ventilation with lower tidal volumes as compared with traditional tidal volumes for acute lung injury and the acute respiratory distress syndrome,”
N. Engl. J. Med., 342 1301
–1308
(2000). https://doi.org/10.1056/NEJM200005043421801 0028-4793 Google Scholar
H. Kitaoka, G. F. Nieman, Y. Fujino, D. Carney, J. DiRocco, and I. Kawase,
“A 4-D model of the alveolar structure,”
J. Physiol. Sci., 57 175
–185
(2007). https://doi.org/10.2170/physiolsci.RP000807 Google Scholar
J. Sznitman, T. Heimsch, J. H. Wildhaber, A. Tsuda, and T. Rosgen,
“Respiratory flow phenomena and gravitational deposition in a three-dimensional space-filling model of the pulmonary acinar tree,”
J. Biomech. Eng., 131
(3), 031010
(2009). https://doi.org/10.1115/1.3049481 0148-0731 Google Scholar
D. Carney, J. DiRocco, and G. Nieman,
“Dynamic alveolar mechanics and ventilator-induced lung injury,”
Crit. Care Med., 33
(3), 122
–128
(2005). https://doi.org/10.1097/01.CCM.0000155928.95341.BC 0090-3493 Google Scholar
H. J. Schiller, U. G. McCann, D. E. Carney, L. A. Gatto, J. M. Steinberg, and G. F. Nieman,
“Altered alveolar mechanics in the acutely injured lung,”
Crit. Care Med., 29 1049
–1055
(2001). https://doi.org/10.1097/00003246-200105000-00036 0090-3493 Google Scholar
C. E. Perlman and J. Bhattacharya,
“Alveolar expansion imaged by optical sectioning microscopy,”
J. Appl. Physiol., 103 1037
–1044
(2007). https://doi.org/10.1152/japplphysiol.00160.2007 8750-7587 Google Scholar
D. A. Lichtenstein and G. A. Meziere,
“Relevance of lung ultrasound in the diagnosis of acute respiratory failure,”
Chest, 134 117
–125
(2008). https://doi.org/10.1378/chest.07-2800 0012-3692 Google Scholar
D. Huang, E. A. Swanson, C. P. Lin, J. S. Schuman, W. G. Stinson, W. Chang, M. R. Hee, T. Flotte, K. Gregory, C. A. Puliafito, and J. G. Fujimoto,
“Optical coherence tomography,”
Science, 254 1178
–1181
(1991). https://doi.org/10.1126/science.1957169 0036-8075 Google Scholar
A. Popp, M. Wendel, L. Knels, T. Koch, and E. Koch,
“Imaging of the three-dimensional alveolar structure and the alveolar mechanics of a ventilated and perfused isolated rabbit lung with Fourier transform optical coherence tomography,”
J. Biomed. Opt., 11
(1), 14015
(2006). https://doi.org/10.1117/1.2162158 1083-3668 Google Scholar
A. Krüger, L. Knels, S. Meißner, M. Wendel, A. R. Heller, T. Lambeck, T. Koch, and E. Koch,
“Three-dimensional Fourier-domain optical coherence tomography of alveolar mechanics in stepwise inflated and deflated isolated perfused rabbit lungs,”
Proc. SPIE, 6627 662707
(2007). https://doi.org/10.1117/12.727891 0277-786X Google Scholar
S. Meissner, M. Mertens, A. Krueger, A. Tabuchi, W. M. Kuebler, and E. Koch,
“In vivo three-dimensional Fourier domain optical coherence tomography of subpleural alveoli combined with intra vital microscopy in the mouse model,”
Biomed. Opt., 2
(2008) Google Scholar
M. G. de Abreu, M. Heintz, A. Heller, R. Szechenyi, D. M. Albrecht, and T. Koch,
“One-lung ventilation with high tidal volumes and zero positive end-expiratory pressure is injurious in the isolated rabbit lung model,”
Anesth. Analg. (Baltimore), 96 220
–228
(2003). https://doi.org/10.1097/00000539-200301000-00045 0003-2999 Google Scholar
J. Gil, H. Bachofen, P. Gehr, and E. R. Weibel,
“Alveolar volume-surface area relation in air- and saline-filled lungs fixed by vascular perfusion,”
J. Appl. Physiol., 47 990
–1001
(1979). 0021-8987 Google Scholar
A. F. Fercher, W. Drexler, C. K. Hitzenberger, and T. Lasser,
“Optical coherence tomography—principles and applications,”
Rep. Prog. Phys., 66 239
–303
(2003). https://doi.org/10.1088/0034-4885/66/2/204 0034-4885 Google Scholar
G. Häusler and M. W. Lindner,
“Coherence radar and spectral radar—new tools for dermatological diagnosis,”
J. Biomed. Opt., 3
(1), 21
–31
(1998). https://doi.org/10.1117/1.429899 1083-3668 Google Scholar
E. Namati, J. Thiesse, J. de Ryk, and G. McLennan,
“Alveolar dynamics during respiration: are the pores of Kohn a pathway to recruitment?,”
Am. J. Respir. Cell Mol. Biol., 38
(5), 572
–578
(2008). https://doi.org/10.1165/rcmb.2007-0120OC 1044-1549 Google Scholar
|