|
|
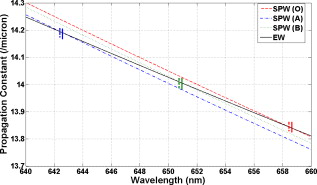
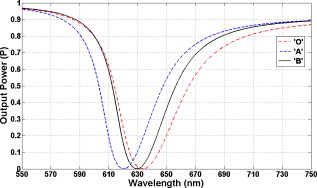
1.BackgroundSurface plasmon resonance (SPR) is one of the promising optical techniques that find several applications in different fields. The SPR phenomenon was first exploited in 1978 for characterization of thin films by Pockrand 1 However, the first sensing application of SPR was presented by Liedberg and Nylander in 1982.2 In the last two decades, SPR-based optical fiber sensors have been utilized in sensing a wide range of physical and biochemical parameters.3, 4, 5 Under Kretchmann and Reather’s attenuated total reflection (ATR) configuration,6 a p-polarized light of wavelength satisfies the resonance condition and excites a charge density oscillation known as surface plasmon wave (SPW). The plasmon resonance condition is expressed as: The term on the left-hand side is the propagation constant of the evanescent wave generated due to ATR of light incident at an angle through the light coupling device (e.g., optical fiber) of refractive index . The right-hand term is the SPW propagation constant , with being the real part of the metal dielectric constant and the refractive index of the sensing (dielectric) medium. When the preceding condition is fulfilled, the resonance appears in the form of a sharp dip of output signal at a resonance wavelength due to strong optical absorption by SPW (Fig. 1 ). Any change in near the metal–dielectric interface causes a shift in the value of . The performance of the SPR sensor is determined in terms of two aspects. First, the shift in resonance wavelength for a given change in should be as large as possible. Second, the full width at half maximum (FWHM) corresponding to SPR curves should be as small as possible for precise measurements.Among various biological parameters, SPR-based sensing has been reported for the detection of pesticides,5 membrane proteins,7 immunoassays,8 DNA, RNA, and allergens. However, the fiber-optic SPR sensor can also be a potential candidate for efficient detection of human blood groups. The logic behind this reasoning is that the different blood groups have different dispersion relationships due to their different chemical and biological compositions. Therefore, in view of Eq. 1, the plasmon resonance condition should be satisfied at different values for different blood groups, thereby making it possible to realize a simple and reliable SPR determination of blood groups. Li 9 experimentally measured the refractive dispersion of three blood groups (O, A, and B) at visible and near-infrared (NIR) wavelengths for a number of blood samples. Based on their experimental results, they described the refractive dispersion for three blood groups in the form of a Cauchy formula given as In the preceding expression, wavelength is in nm. The Cauchy coefficients can have different values for different blood groups. Based on the fitting of data points of experimental dispersion curves reported by Li,9 Fig. 2 shows the variation of refractive index for three different blood groups (O, A, and B) with wavelength. As is apparent, the trends of the curves (i.e., decrease in refractive index with an increase in wavelength) are in accordance with the normal dispersion shown by most of the SPR-active liquid media (e.g., water, etc.), which gives a first-hand indication that SPR sensing can be made possible for blood samples also. The data corresponding to the plot shown in Fig. 2 have been used for simulation in the present work.Fig. 2Plot for dispersion (refractive index versus wavelength) of samples corresponding to three different blood groups.  The present state-of-the-art suggests that despite being heavily used for almost three decades, the SPR sensing principle is still unexplored for the detection of human blood groups. Therefore, in the present work, we have explored the possibility of designing a fiber-optic SPR blood-group sensor by making use of the experimental data provided by Li 9 We report the design considerations to enable a fiber-optic SPR sensor for detection of different blood groups. Standard fused silica fiber coated with thin SPR-active silver (Ag) layer has been considered for the proposed scheme. The spectral interrogation method of SPR sensing is used. The influence of critical design parameters such as metal layer thickness, ratio of sensing region length to fiber core diameter , and temperature is studied on the proposed sensor’s performance in order to identify the best possible working conditions leading to highly accurate and reliable SPR-based fiber-optic detection of different blood groups. 2.Design ConsiderationsIn this section, we systematically discuss the modalities of different constituents of the proposed sensor design along with their physical, biological, and optical properties. 2.1.Optical FiberThe coupling device is considered a multimode optical fiber (of core diameter ), whose wavelength-dependent refractive index is represented in terms of the Sellmeier expression, as follows10: where denotes the wavelength (in ). The coefficients , , , , , and are known as Sellmeier coefficients and have certain numeric values for fused silica.10 The numerical aperture (NA) of a multimode fiber is generally in the vicinity of 0.20.2.2.Metal LayerAs shown in Fig. 1, a small portion (of length ) of fiber cladding is removed and is coated with a thin Ag layer of thickness . According to the free-electron Drude model, the wavelength-dependent complex dielectric function of Ag can be written as: In the preceding expression, stands for plasma wavelength, and stands for collision (or damping) wavelength. For Ag, the standard value of is and of is (Ref. 11).2.3.Buffer LayerThe Ag layer in Fig. 1 is followed by a buffer layer of thickness in the vicinity of with refractive index of 1.45 (Ref. 11). Preferably, this buffer layer should be in the form of a biochemical layer for two important reasons. First, it prevents the blood sample from being in direct contact with the Ag layer, which may contaminate the blood sample, thereby affecting sensor’s performance. The contamination due to the presence of the Ag layer may arise due to the fact that silver is prone to oxidation problems when used in liquid environments. If inappropriately exposed to liquids, Ag may form a thin oxide layer on its surface. Such an oxide layer may lead to errors in SPR measurements, and for this reason, the Ag layer must be protected against such oxidation issues. Therefore, one may choose a biochemical layer that can act as a protective layer to keep the Ag layer from being oxidized. Second, the structural compatibility of the blood sample with such a biochemical layer is another added advantage. Structural compatibility lies in the fact that due to having both chemical and biological characteristics, a single biochemical layer may provide stable bonding at the two interfaces (one with the Ag layer and another with the blood sample) to prevent any structural anomaly at those interfaces (e.g., polyethyleneglycol may be able to satisfy the preceding conditions). Our previous studies show that for silica fiber, the biochemical layer should have a thickness in the vicinity of in order to achieve highly sensitive SPR measurements.11 Therefore, for the present study, we assumed this biochemical layer to be thick. 2.4.Blood Sample LayerThe final layer in the present SPR sensor is a very thin layer of blood sample. In general, there is no limit to the thickness of the outermost (i.e., sensing) layer for SPR-based measurements. We carried out our calculations for blood layer thickness of and there was no change in the SPR curves for three blood groups due to high optical activity of the SPW (in terms of its large penetration depth into the blood sample layer). Therefore, a very small amount of blood sample is required with the proposed scheme. 2.5.Transmitted Power CalculationsFirst, the transfer matrix method is used to calculate the reflectivity of the present SPR sensor design (Sec. 5). Then, the following form of angular distribution for collimated (i.e., all guided rays) launching of light in optical fiber is followed:11 where is the refractive index of the fiber core. Since any guided ray in an optical fiber may undergo multiple reflections (Fig. 1), in order to determine the effective transmitted power, the reflection coefficient for a single reflection is raised to the power of the number of reflections any specific propagating angle undergoes with the sensor interface. Therefore, the generalized expression for normalized transmitted power in a fiber-optic SPR sensor will be:where the multiple reflections of a light ray propagating inside the Ag-coated fiber core have been taken into account as follows: represents the total number of reflections performed by a ray making an angle with the normal to the fiber core–Ag layer interface. A fiber-optic probe can alternatively be used as point sensor for blood-group detection by coating one end of the fiber with an SPR-active metal layer and using the sensor in a reflection mode rather than in the present transmission mode.3.Results and DiscussionIn this section, we discuss the sequence of steps that were carried out to reach an optimized design of a fiber-optic SPR sensor for blood-group detection. 3.1.Occurrence of SPR and Stability against Thermal VariationIn order to set the optimized design parameters, the foremost task is to analyze the possibility of occurrence of SPR with the present blood-group sensing scheme. Figure 3 shows the spectral variation of for three blood groups (O, A, and B) along with for fused silica fiber. The curves correspond to room temperature (i.e., . As is shown in Fig. 3, the curves for the three blood groups intersect the curve at three different wavelengths , marked by a solid vertical line at each intersection point (i.e., for A, for B, and for O blood groups). This suggests that light can be coupled to SPW to enable SPR-based detection of blood groups with the present fiber sensor scheme. The overall is , which is sufficiently large to distinguish among the three blood groups. Furthermore, we have also studied the effect of temperature variation on the preceding result by taking the thermo-optic effect in fused silica and Ag layer into account.12 The corresponding dotted vertical lines show that at , values shift to the slightly shorter side (i.e., for A, for B, and for O blood groups). However, between and , the change in is linear, small, and almost identical for all three blood groups, which suggests that there is a negligible effect of temperature variation on blood-group detection under the present fiber-optic SPR sensor scheme. 3.2.Optimization of Design Parameters: Master PlotThe next task is to optimize the design parameters related to optical fiber (i.e., and ) and Ag layer (i.e., ) in order to ensure large and small FWHM of SPR curves. From Eq. 7, it is clear that both as well as affect only the number of reflections, therefore, it is more appropriate to try to optimize the ratio . Figure 4 depicts a master plot showing the effect of on performance parameters: overall and average FWHM. The value of is varied from 10 to 200. The master plot also contains the corresponding plots for two values (i.e., and ) of . Apparently, as increases, the overall decreases, whereas average FWHM increases for any value of . This means that with an increase in , the sensor’s performance deteriorates, which may be explained in terms of SPR-curve broadening. Each reflection a ray undergoes at the fiber–metal interface causes a certain fraction of optical power to dissipate into the sensing region due to the coupling of the evanescent wave with SPW. This further implies that larger the number of reflections, the more the decay in power transmitted at the fiber’s output end due to greater dissipation of power. This decay results in the downfall of SPR curve and, therefore, increases its FWHM. Since number of reflections increases with an increase in , FWHM increases with . Moreover, since energy-flow inside the fiber takes place in form of different discrete guided modes, which one of the modes gets coupled to SPW will depend on the precise amount of energy transferred. Further, since a mode is characterized by its angle , corresponding to the coupled mode also is affected, which in effect causes the to shift to some other value to ensure the fulfillment of the resonance condition [see Eq. 1]. Furthermore, since the amount of energy transfer significantly depends on and in terms of number of reflections, these two parameters ultimately affect the resonance condition also. More precisely, the resonance condition is satisfied at different wavelengths depending on what value of is taken. Fig. 4Simulated master plot in order to optimize the design values of fiber core diameter , sensing region length , and silver layer thickness .  The master plot also shows that the sensor’s performance gets better with an increase in . The reason is the variation in interaction between SPW and the fiber mode with a change in . The thicker the Ag layer, the smaller the interaction between SPW and the fiber mode. A small interaction causes less absorption of light power, and the SPR curve shifts upward. The upshift results in narrowing of the SPR curve, and hence FWHM decreases. This variation of interaction between SPW and fiber mode also affects the resonance condition (as described earlier), and the overall increases for a thicker Ag layer. 3.3.Demonstration of Fiber-Optic SPR Sensing for Blood-Group DetectionFollowing the optimization of design parameters, Fig. 5 depicts the three SPR curves for three different blood groups (O, A, and B). The curves have been plotted at for and . According to Fig. 5, the values for the A, B, and O groups are , , and , respectively. The preceding values are fairly separated from one another, exhibiting an overall of for three blood groups. The overall becomes slightly smaller than was shown in Fig. 3 because of all-guided ray launching, which affects the angular distribution of the rays, and hence affects the resonance condition. Keeping in mind that a spectral shift of as small as is commonly detectable these days, the preceding results indicate that blood-group detection with a fiber-optic SPR sensor can be conveniently carried out with high sensitivity. Further, the sensed refractive indices of the A, B, and O groups at their corresponding values (i.e., , , and , respectively) are 1.3768, 1.3788, and , respectively (Fig. 2). Thus, sensed refractive indices corresponding to the three blood groups are separated by . This means that an overall of corresponds to an overall refractive index change of . Therefore, assuming a standard spectral resolution limit of , the theoretical detection limit with the proposed sensor design is of the order of . Furthermore, the FWHM values for A, B, and O blood groups are , , and , respectively—i.e., an average FWHM of . The preceding FWHM values are in a fairly reasonable range compared to general SPR curves obtained in theoretical and experimental results. 4.ConclusionA fiber-optic SPR sensor is proposed for reliable and accurate detection of human blood groups with an emphasis on achieving high sensitivity and detection accuracy. The results indicate that one should choose an optical fiber with large core diameter. Further, designing smaller SPR sensing regions with silver layer of thickness typically around provides much better performance. The results indicated that the effect of temperature and stability of the SPR pattern may not be an issue on the performance of proposed sensor. Since the calculations have been carried out using experimental data, the sensor in the proposed form of a fiber-optic SPR probe as well as a point probe can be very helpful for blood-group detection in medical applications requiring only a small amount of blood. The present probe can also be reusable by using an appropriate buffer solution. Knowing the importance of blood-group detection in different medical contexts (e.g., chirurgy involving tested blood infusions), the proposed sensor, apart from differentiating the different blood groups, can open up new ways for reliable detection of overall blood properties. The proposed sensor may be cost-effective, as it requires only a broadband light source and a spectrometer for the detection. AppendicesAppendix: Brief Description of Transfer Matrix MethodA basic -layer optical system is shown in Fig. 6 . The layers are stacked along the axis. The arbitrary medium layer is defined by thickness , dielectric constant , permeability , and refractive index . All the layers are assumed to be uniform, isotropic, and nonmagnetic. The tangential fields at the first boundary are related to those at the final boundary by: where and , respectively, are the tangential components of electric and magnetic fields at the boundary of the first layer. and are the corresponding fields at the boundary of the ’th layer. Here, is known as the characteristic transfer matrix of the combined structure and is given by:withwhereandThe amplitude reflection coefficient is given byLast, the reflectivity is calculated asIn the present sensor design, we have a total of four layers (fiber core, Ag layer, buffer layer, and sample blood layer), i.e., . So, by using of the values of refractive index and the thickness of the different layers as discussed earlier, the value of reflectivity can be conveniently calculated with the help of the transfer matrix method for further use in obtaining the transmitted power , as discussed in Sec. 2.5.AcknowledgmentsAnuj Kumar Sharma would like to thank the Alexander von Humboldt Foundation (Germany) for financial support during his research stay at Friedrich-Schiller University Jena (Germany). Gerhard J. Mohr was supported by Deutsche Forschungsgemeinschaft research grants MO 1062/5-1 and MO 1062/6-1. ReferencesI. Pockrand, J. D. Swalen, J. G. Gordan, and M. R. Philpott,
“Surface plasmon spectroscopy of organic monolayer assemblies,”
Surf. Sci., 74 237
–244
(1978). https://doi.org/10.1016/0039-6028(78)90283-2 0039-6028 Google Scholar
B. Liedberg, C. Nylander, and I. Sundstrom,
“Surface plasmon resonance for gas detection and biosensing,”
Sens. Actuators, 4 299
–304
(1983). https://doi.org/10.1016/0250-6874(83)85036-7 0250-6874 Google Scholar
R. C. Jorgenson and S. S. Yee,
“A fiber-optic chemical sensor based on surface plasmon resonance,”
Sens. Actuators B, 12 213
–220
(1993). https://doi.org/10.1016/0925-4005(93)80021-3 0925-4005 Google Scholar
T. Okamoto, I. Yamaguchi, and T. Kobayashi,
“Local plasmon sensor with gold colloid monolayers deposited upon glass substrates,”
Opt. Lett., 25 372
–374
(2000). https://doi.org/10.1364/OL.25.000372 0146-9592 Google Scholar
R. Jha, S. Chand, and B. D. Gupta,
“Surface plasmon resonance based fiber-optic sensor for detection of pesticide,”
Sens. Actuators B, 123 661
–666
(2007). https://doi.org/10.1016/j.snb.2006.10.001 0925-4005 Google Scholar
E. Kretchmann and H. Reather,
“Radiative decay of non-radiative surface plasmons excited by light,”
Z. Naturforsch [C], 23 2135
–2136
(1968). 0341-0382 Google Scholar
Z. Salamon, H. A. Macleod, and G. Tollin,
“Surface plasmon resonance spectroscopy as a tool for investigating the biochemical and biophysical properties of membrane protein systems. II: Applications to biological systems,”
Biochim. Biophys. Acta, 1331 131
–152
(1997). 0006-3002 Google Scholar
E. Matveeva, J. Malicka, I. Gryczynski, Z. Gryczynski, and J. R. Lakowicz,
“Multi-wavelength immunoassays using surface plasmon-coupled emission,”
Biochem. Biophys. Res. Commun., 313 721
–726
(2004). https://doi.org/10.1016/j.bbrc.2003.12.010 0006-291X Google Scholar
H. Li, L. Lin, and S. Xie,
“Refractive index of human whole blood with different types in the visible and near-infrared ranges,”
Proc. SPIE, 3914 517
–521
(2000). https://doi.org/10.1117/12.388073 0277-786X Google Scholar
A. Ghatak and K. Thyagarajan,
“Material dispersion,”
An Introduction to Fiber Optics, 80
–82 Cambridge University Press, Cambridge, UK
(1998). Google Scholar
B. D. Gupta and A. K. Sharma,
“Sensitivity evulation of a multi-layered surface plasmon resonance based fiber optic sensor: a theoretical study,”
Sens. Actuators B, 107 40
–46
(2005). https://doi.org/10.1016/j.snb.2004.08.030 0925-4005 Google Scholar
A. K. Sharma and B. D. Gupta,
“Influence of temperature on the sensitivity and signal-to-noise ratio of fiber optic surface plasmon resonance sensor,”
Appl. Opt., 45 151
–161
(2006). https://doi.org/10.1364/AO.45.000151 0003-6935 Google Scholar
|