
|
|
1.IntroductionMacular pigment (MP) has been a topic of interest in ophthalmologic research for many years. Currently, MP is studied mainly because of the proposed link between low levels of macular pigment optical density (MPOD) and an increased risk of developing age-related macular disease.1, 2 MP is composed of the hydroxyl-carotenoids lutein (L) and zeaxanthin (Z).3 Location and spatial distribution of the MP have been vigorously studied in the past using both in vitro and in vivo methods. The MPOD has its peak at or near the fovea and decreases rapidly with increasing eccentricity.4, 5, 6, 7, 8, 9 Studies show that the MP is mainly located along the fibers of Henle,5 but also in the photoreceptor outer segments.10 In the central of the retina, the fibers of Henle are radially oriented due to the displacement between the photoreceptors and the ganglion cells to which they project. The length of Henle fibers is between 400 and .11 This must in some way influence the amount of MP that can be deposited and its spatial distribution across the retina. Corresponding to the maximum cone density at the fovea,12 the fibers of Henle are most numerous, centrally, and it is presumably for this reason that the MP reaches its peak density at the fovea. It might be expected that there is a straightforward relationship between foveal architecture and spatial distribution of MP, but thus far, the literature has been inconclusive on this issue.13, 14, 15 The most widely used method to determine MPOD is heterochromatic flicker photometry (HFP). A small (in most studies about size) visual stimulus emits alternating light of two different wavelengths, blue light , which is absorbed by the MP, and green light , which is not absorbed by the MP. Because of the prereceptor location of the MP in the retina, incident light first passes through, and is attenuated by, the MP (which has a peak absorption of ) before reaching the photoreceptors.5, 8, 16 Given that MP has its peak concentration foveally or just parafoveally and decreases rapidly with eccentricity, flicker-based techniques typically use a central (foveal peak MPOD) and peripheral measurement point. The peripheral measurement is used as a reference point for the central measurement and is assumed to be zero. In most HFP devices, subjects are instructed to fixate the stimulus and indicate when flicker is minimized. The current device, however, is designed for subjects to respond when flicker is first observed.9 In any case, a higher intensity of the blue test light is needed when performing the central measurement because of the presence of the blue-light-attenuating MP. MPOD is then determined as the log ratio between the central and peripheral measurements. One of the difficulties in studying MP and its spatial distribution is the fact that two of the most popular techniques for its measurement, HFP and retinal reflectometry, appear to show systematic differences, and it is toward this issue that this paper is addressed. Delori commented on the differences between his reflectance and psychophysical measurements at length and attempted to account for the disparity between a scanning laser ophthalmoscope and flicker-based MPOD data by making a correction for the area sampled.17 The issue is also considered in some detail in Berendschot and van Norren.18 They point out that a straightforward comparison between reflectometry- and flicker-based techniques is complicated by the peakedness of the distribution of MP and the fact that the flicker techniques rely on a zero reference point at around . However, recent studies using a reflection technique show that MP seems to have a definitive, albeit small, value at .6, 19, 20 Some of the early papers on the measurement of MPOD in humans proposed that, when flicker photometric methods are used, observers detect the flicker at the edge of the target when setting flicker thresholds.21 This idea was tested in detail by Hammond 4 They used a small target and compared MPOD obtained at peripherally with that obtained with a target presented centrally. On the basis that observers use the edge of the target, effectively at , the high correlation between the two measurements supported the so-called edge hypothesis. They confirmed the idea that using a flickering target underestimates the true central value by an amount depending on half the height of the spatial profile. This issue was also addressed by van der Veen from a different perspective; they compared central MP measurements using retinal reflectometry and flicker photometry.9 As has been described previously, there were systematic differences between the two measurements, with the reflectometry method giving higher values than the flicker photometric technique. However, if the measurement was corrected by a factor that assumes an exponential falloff of at , as recommended in Hammond, there were only negligible differences between the two methods.4 The experiments described here were designed to extend this observation by comparing retinal reflectometry and flicker photometric methods for a range of different eccentricities. The main objective was to compare MP profiles obtained with the two devices in order to account for the numerical differences between them. A second objective of practical importance, as discussed below, was to establish whether observers utilize the edge of the flickering target irrespective of eccentricity when setting flicker thresholds. 2.Methods2.1.SubjectsSpatial MPOD profiles were compared in the right eyes of 19 healthy individuals (13 women, 6 men) aged , without any ocular pathology, diabetes, or hypertension. All subjects were of Northern European origin, except for one who was of Southern European ancestry. All subjects had a best-corrected visual acuity of 0.8 or better, with refraction between and . Study participants were recruited from the University of Maastricht, University Eye Clinic Maastricht, the Netherlands, and University of Manchester, UK. Written informed consent was obtained for all participants. Research adhered to the tenets of the Declaration of Helsinki. All subjects underwent MPOD determination by spectral fundus reflectance and HFP consecutively, on one day. 2.2.Spectral Fundus ReflectanceSpatial profiles were obtained by analyzing the spectral fundus reflectance with the MP reflectometer (MPR)22 Essentials of this setup are summarized as follows. The image of the filament of a halogen lamp is relayed to the pupil plane of the eye. The intensity of the light entering the eye is Troland. A spot with a diameter centred on the fovea is illuminated, and the light that reflects from this spot is measured. An image of the retinal spot is focused on an optical fiber that has a mask on its tip to define a diameter spot of at the retinal plane. The fiber is the receiving part of a spectrometer with a range of and an optical resolution of [full width at half maximum (FWHM)]. To keep instrument’s stray light to a minimum, the detection channel does not overlap with the illumination system. A chin rest and temple pads were used to help maintain head position. Measurements were performed without pupil dilatation. MPOD was determined by a full spectral analysis of the reflected light. In brief, the incoming light is assumed to reflect at the inner limiting membrane, at the infoldings/disks in cone/rod outer segments and at the sclera. Using known spectral characteristics of the different absorbers within the eye (lens, MP, melanin, blood), the densities of the pigments and percent reflectance at the interfaces are optimized to fit the measured data at all wavelengths.20, 23 Note that this method used does not compare macula and periphery and gives an absolute estimate of MP. For a detailed discussion of this analysis see Berendschot 24 and Berendschot and van Norren.25 To determine MPOD values at different eccentricities, we modified the MPR by adding five fixation points at 1, 2, 4, 6, and temporally to the central measurement field of . A single measurement on the MPR takes . We used the mean of five measurements. A major advantage of this technique is that it can be used to separate the contributions of L and Z to the overall macular pigment as has been described in van der Kraats 20 In the present paper, we have calculated the “true” shape of the MP profile by taking account of the (very different) spatial profiles of the L and Z.26 This is achieved by averaging true shapes of the L and Z distribution over the measuring field and fitting the outcomes with the MPR data. The true shape of the MP profile is then just the sum of L and Z spatial distributions. 2.3.HFPHFP was used to asses MPOD psychophysically using an MPS 9000 (called M|POD in Europe and QuantifEye in the USA). This device employs a technique for obtaining the minimum flicker photometry and has been described by Van der Veen 9 Effectively, the minimum flicker point for a series of blue-green ratios is obtained as the temporal frequency is ramped as described below. Thus, a flicker-detection criteria is used in which observers press a button when they detect flicker. This is in contrast with, as is conventional, adjusting luminance ratio until flicker is minimized.9 The test consists of two stages. First, the observer’s overall sensitivity to flicker is determined. The flickering rate is gradually reduced (at ) from above flicker threshold until the observer detects flicker. This is repeated five times, and the mean luminance contrast of the five settings is noted. The luminance contrast of the two lights (green and blue) is normalized for that particular subject so that they are in the middle of their sensitivity range. Subsequently, the actual measurement begins, where the subjects starts by fixating the central stimulus, composed of alternating flicker of blue and green LEDs with bandwidth . It should be noted that the spectral output of the LEDs does not match exactly the action spectrum of the MP. There is a small correction for this in the software that drives the device. The correction is fully discussed in van der Veen 9 The flicker frequency is again ramped down from above the critical flicker fusion frequency. In this main part of the test, a series of different luminance ratios of the two lights is tested. Each luminance ratio is presented in turn. The subject presses a button when flicker appears for the particular blue-green ratio. As the sequence proceeds, a distinctive V-shaped curve is generated in a graph of green-blue luminance ratio versus temporal frequency. During this sequence, the trained operator can immediately determine if the measurements have been performed correctly by monitoring the shape of the curve. The minimum of the curve represents the isoluminant point for the two lights. The same sequence is then repeated for eccentric fixation so that a second V-shaped curve is obtained. The difference between the minima of the two curves is used to determine the MPOD. For a detailed description of this technique, see van der Veen 9 To measure MPOD at different eccentricities, the device was modified with eccentric fixation targets at 0.5, 1, 2, 4, 5, 6, 7, and along the horizontal meridian. A sequence of settings, each generating a V-shaped curve, was obtained when the observers viewed each fixation point in turn. Values for MPOD could then be calculated by referencing to the green-blue ratio at , assumed to be zero in the usual way. Correct fixation was ensured because the operator was able to monitor the development of the V-shape function during the procedure. A noisy, or inconsistent, V-shape is an indication that fixation is unsteady, and the operator can pause the trial to emphasis the importance of correct fixation to the subject. 3.Results and Model AnalysisFigure 1 presents data obtained with the MP screener [(MPS) MPS 9000] compared to those obtained with the MPR for the central measurements ( , ). It is clear that the flicker technique underestimates MPOD compared to the reflectometry based method (Student’s T-test, ), as seen from the line with slope equal to 1. The relationship seen here between data from the flicker methods and the MPR is very similar to that described in van der Veen 9 Figures 2a and 2b show mean raw data from the reflectometry- and flicker-based methods plotted in terms of eccentricity. In Fig. 2a, we show mean MPR data (open squares) with the MPS 9000 as a dotted line. For clarity, Fig. 2b shows mean MPS 9000 data (open circles) with the MPR as a dotted line. There are quite systematic differences between the two data sets in terms of eccentricity. First, as seen in Fig. 1, MPR central values are always greater than MPS 9000 values. However, as can be seen in Figs. 2a and 2b, the data sets tend to converge as eccentricity increases. An important note is that the mean value for the MPR at is 0.04. However, the MPS 9000 uses this point as a reference and therefore assumes it to be zero. Hence, increasing all MPS 9000 values by 0.04 would make the data sets considerably more compatible. The issue of the divergence between the two data sets from remains, however. To address this we have analyzed the spatial profile of the MP in more detail by taking in to account the distributions of the L and Z. Fig. 1Scatter plot of the MPOD obtained by the MPS versus data from the MPR for the central measurements. The solid line indicates a perfect match between the two methods. 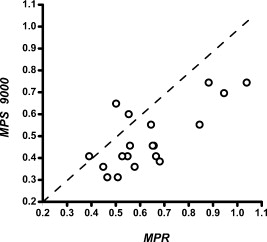 Fig. 2Mean MPOD values from the reflectometry- and flicker-based methods as a function of eccentricity: (a) Mean MPR data (open squares, solid line) with the MPS 9000 as a dotted line and (b) mean MPS 9000 data (open circles, solid line) with the MPR as a dotted line.  Figure 3 shows mean L and Z optical density as a function of eccentricity obtained from the MPR and their sum (i.e., the MPOD). The spatial profiles have their peak at the foveal center and decrease with eccentricity. Because of this peakedness, the size of the retinal field probed has a major effect on MPOD outcomes. The MPR samples over a field, which implies that, in particular, at small eccentricities the measured data will differ from the actual data. To determine these actual data, we assumed that an exponential decreasing function with eccentricity for both the L and Z profiles give an accurate representation of the actual spatial profile of these carotenoids. The L and Z optical densities as measured by the MPR, and , respectively, are then given by Here, is the eccentricity, is the peak optical density, and is the steepedness of the exponential decreasing function. The subscripts L and Z refer to the separate distributions of lutein and zeaxanthin. To determine the actual distribution (i.e., , , , and ), we used a -square minimization procedure to optimize , , , and such that and fitted the measured MPR data best for all eccentricities, simultaneously, in which all measured data points contributed equally. This was done for each subject separately. It resulted in mean values of , , , and . The dashed lines in Fig. 3 are the modeled L and Z profiles, which are parametrized by these mean values. As expected for low eccentricities, the new calculated MPOD profile (solid line, which is just the sum of the L and Z profiles) has higher values than those measured, in particular, for the steeper Z-profile–dominated region of the distribution. Note also that lutein optical density has a finite, nonzero value at eccentricity (mean , range 0.001–0.119).Fig. 3Mean L optical density (open triangles) and Z optical density (open circles) as a function of eccentricity obtained with the MPR. The solid squares show the MPOD (i.e., the sum of the L and Z contributions). Dashed lines are model fits under the assumption that the distribution has an exponential decay with eccentricity. For details see the text.  Figure 4 shows MPOD as a function of eccentricity for the MPS 9000 and the MPR. The MPS 9000 data have been corrected in the following ways. As a first step, we added for each subject the modeled optical density at , as determined by the MPR analysis, to the MPS data points at all eccentricities as described above. In Fig. 4, this shows as a vertical shift upward. Now, for all eccentricities of , there was very good agreement between the MPOD values obtained from the MPR and the values derived from the MPS. Fig. 4MPOD as a function of eccentricity. Open squares are the measurements obtained by the MPS. The solid line is an estimate of the actual MPOD profile, determined from a model fit on the data from the MPR. Circles depict MPS data that have been modified to fit the solid line best. For details see the text.  In order to account for the remaining differences between the two techniques at 0 and , as a second step we calculated for each subject the eccentricity at which the modeled distribution, calculated from the L and Z profiles would yield the same result as given by the MPS 9000. This is rather straightforward because the modeled distribution is parametrized by the sum of two exponentially decreasing function with eccentricity. In line with the hypothesized edge effect, we found that on average, observers set flicker thresholds at when the target was presented at , and at when the target was presented at . In Fig. 4, this induced an additional horizontal shift for the two lowest eccentricities. 4.DiscussionThis study showed a strong correlation between the HFP and the fundus reflectance technique for measuring MPOD spatial profiles. For central measuring only (i.e. at ), we found a correlation of , similar as in a previous studies using the same two devices ( , ).9 However, correlation analyses only reveal the strength of the relation between techniques but does not necessarily reveal agreement in an absolute sense. As can be seen in Figs. 2a and 2b, fundus reflectance data show slightly higher values than HFP data. This is especially noticeable in the central measurements, which tend to lie under the line indicating perfect correlation. The difference between the two methods compared here could be a direct consequence of the previously described edge effect. As suggested by other studies, HFP methods do not necessarily generate accurate central MPOD estimates and tend to underestimate the central values.9, 17 This applies particularly for central measurements in subjects with a steep central peakedness of MPOD, perhaps with disproportionally more Z. When they use the edge of the stimulus to determine flicker, and therefore determine flicker more eccentrically, their MPOD value will differ more from the central peak MPOD than in individuals who have a more gradual decay of MPOD.4, 17, 21, 27 This means that when subjects fixate a HFP stimulus, and use the edge of the stimulus to determine flicker, the measurement is based on an eccentricity of rather than, as in the reflectometry, taking an average over the sampling area. Therefore, assuming a peak MPOD at , HFP measures lower than true values. The analysis described in Section 3 is intended to model this effect and to quantify the strength of the relationship between the two techniques. The advantage of the MPR is that it enables the determination of both the L and Z profiles separately. This allowed us to model the actual L and Z profiles that constitutes the profile measured by the MPR, which averages over a field. It does so by assuming an exponential decreasing function with eccentricity for both L and Z, averaging these modeled profiles over the measuring field and fitting the outcomes with the MPR data, as described in detail above. Thus, we determined the modeled MPOD profile (i.e., the sum of the L and Z profiles). It is this distribution that should be used to model the edge effect. First, it must be noted that at eccentricity, the MPOD still has a finite, nonzero value. This contradicts the assumption, made in all HFP-based methods, that at this eccentricity MP is absent. Therefore, initially the each individuals modeled value at , as determined with the MPR, was added to their HFP values at all eccentricities. For all eccentricities larger than this resulted in a good agreement between HFP estimates and MPR data, clearly noticeable from Fig. 4. This implies that for these eccentricities there is no need to introduce an edge effect because the observers sample over the entire area of the target when it is viewed eccentrically. This is what might be expected. Sensitivity, particularly to the high spatial frequency components of the edge of the stimulus, declines rapidly with eccentricity. Observers then rely of the entire stimulus, effectively its low spatial frequency components, to detect the target and its flicker. After this “dc” correction, HFP measurements obtained at 0 and eccentricity, still differed from each other. In order to also obtain an agreement in absolute sense at eccentricities of , on average we had to shift the point to , and the data point to . In particular, the individual Z profiles vary considerably, , as also observed by others.6, 28, 29, 30, 31 This makes it impossible to have a single correction factor to calculate the peak MPOD from its value at eccentricity, because subjects with a peaked distribution will have much lower optical densities at than subjects with a broad distribution. A solution for this could be found in using extremely small stimuli, as performed by Hammond, who used a stimulus at eccentricity.4 This stimulus and its location correspond to that of someone using the edge of a stimulus. High correlation between the data obtained by Hammond with a target at and a test target, centrally fixated, again provide proof that subjects indeed use the edge of a stimulus to determine flicker.4 In conclusion, we present a solution for comparison between fundus reflectometry- and flicker-based methods that holds promise for future comparison of data obtained between the two and could be used to correct for a probable underestimation of MP values obtained by HFP if the spatial profile is known. As a rule of thumb, when measuring MPOD profiles with HFP methods, adding 0.05 DU to all eccentricities will give very good agreement with reflectance. The value at should be adjusted by a further factor that will depend on the steepness of the individual MPOD spatial distributions. ReferencesS. Beatty, I. J. Murray, D. B. Henson, D. Carden, H. Koh, and M. E. Boulton,
“Macular pigment and risk for age-related macular degeneration in subjects from a Northern European population,”
Invest. Ophthalmol. Visual Sci., 42
(2), 439
–446
(2001). 0146-0404 Google Scholar
R. A. Bone, J. T. Landrum, S. T. Mayne, C. M. Gomez, S. E. Tibor, and E. E. Twaroska,
“Macular pigment in donor eyes with and without AMD: a case-control study,”
Invest. Ophthalmol. Visual Sci., 42
(1), 235
–240
(2001). 0146-0404 Google Scholar
R. A. Bone, J. T. Landrum, and S. L. Tarsis,
“Preliminary identification of the human macular pigment,”
Vision Res., 25
(11), 1531
–1535
(1985). https://doi.org/10.1016/0042-6989(85)90123-3 0042-6989 Google Scholar
B. R. Hammond Jr., B. R. Wooten, and D. M. Snodderly,
“Individual variations in the spatial profile of human macular pigment,”
J. Opt. Soc. Am. A, 14
(6), 1187
–1196
(1997). https://doi.org/10.1364/JOSAA.14.001187 0740-3232 Google Scholar
D. M. Snodderly, J. D. Auran, and F. C. Delori,
“The macular pigment. II. spatial distribution in primate retinas,”
Invest. Ophthalmol. Visual Sci., 25
(6), 674
–685
(1984). 0146-0404 Google Scholar
T. T. Berendschot and D. van Norren,
“Macular pigment shows ringlike structures,”
Invest. Ophthalmol. Visual Sci., 47
(2), 709
–714
(2006). https://doi.org/10.1167/iovs.05-0663 0146-0404 Google Scholar
F. C. Delori, D. G. Goger, C. Keilhauer, P. Salvetti, and G. Staurenghi,
“Bimodal spatial distribution of macular pigment: evidence of a gender relationship,”
J. Opt. Soc. Am. A, 23
(3), 521
–538
(2006). https://doi.org/10.1364/JOSAA.23.000521 0740-3232 Google Scholar
D. M. Snodderly, P. K. Brown, F. C. Delori, and J. D. Auran,
“The macular pigment. I. absorbance spectra, localization, and discrimination from other yellow pigments in primate retinas,”
Invest. Ophthalmol. Visual Sci., 25
(6), 660
–673
(1984). 0146-0404 Google Scholar
R. L. van der Veen, T. T. Berendschot, F. Hendrikse, D. Carden, M. Makridaki, and I. J. Murray,
“A new desktop instrument for measuring macular pigment optical density based on a novel technique for setting flicker thresholds,”
Ophthalmic Physiol. Opt., 29
(2), 127
–137
(2009). https://doi.org/10.1111/j.1475-1313.2008.00618.x 0275-5408 Google Scholar
L. M. Rapp, S. S. Maple, and J. H. Choi,
“Lutein and zeaxanthin concentrations in rod outer segment membranes from perifoveal and peripheral human retina,”
Invest. Ophthalmol. Visual Sci., 41
(5), 1200
–1209
(2000). 0146-0404 Google Scholar
N. Drasdo, C. L. Millican, C. R. Katholi, and C. A. Curcio,
“The length of Henle fibers in the human retina and a model of ganglion receptive field density in the visual field,”
Vision Res., 47
(22), 2901
–2911
(2007). https://doi.org/10.1016/j.visres.2007.01.007 0042-6989 Google Scholar
C. A. Curcio, C. L. Millican, K. A. Allen, and R. E. Kalina,
“Aging of the human photoreceptor mosaic: evidence for selective vulnerability of rods in central retina,”
Invest. Ophthalmol. Visual Sci., 34
(12), 3278
–3296
(1993). 0146-0404 Google Scholar
S. H. Liew, C. E. Gilbert, T. D. Spector, J. Mellerio, F. J. Van Kuijk, S. Beatty, F. Fitzke, J. Marshall, and C. J. Hammond,
“Central retinal thickness is positively correlated with macular pigment optical density,”
Exp. Eye Res., 82
(5), 915
–920
(2006). https://doi.org/10.1016/j.exer.2005.10.014 0014-4835 Google Scholar
J. M. Nolan, J. M. Stringham, S. Beatty, and D. M. Snodderly,
“Spatial profile of macular pigment and its relationship to foveal architecture,”
Invest. Ophthalmol. Visual Sci., 49
(5), 2134
–2142
(2008). https://doi.org/10.1167/iovs.07-0933 0146-0404 Google Scholar
R. L. van der Veen, S. Ostendorf, F. Hendrikse, and T. T. Berendschot,
“Macular pigment optical density relates to foveal thickness,”
Eur. J. Ophthalmol., 19
(5), 839
–841
(2009). 1120-6721 Google Scholar
J. Wu, S. Seregard, and P. V. Algvere,
“Photochemical damage of the retina,”
Surv. Ophthalmol., 51
(5), 461
–481
(2006). https://doi.org/10.1016/j.survophthal.2006.06.009 0039-6257 Google Scholar
F. C. Delori, D. G. Goger, B. R. Hammond, D. M. Snodderly, and S. A. Burns,
“Macular pigment density measured by autofluorescence spectrometry: comparison with reflectometry and heterochromatic flicker photometry,”
J. Opt. Soc. Am. A Opt. Image Sci. Vis, 18
(6), 1212
–1230
(2001). https://doi.org/10.1364/JOSAA.18.001212 1084-7529 Google Scholar
T. T. Berendschot and D. van Norren,
“On the age dependency of the macular pigment optical density,”
Exp. Eye Res., 81
(5), 602
–609
(2005). https://doi.org/10.1016/j.exer.2005.03.019 0014-4835 Google Scholar
P. Charbel Issa, R. L. van der Veen, A. Stijfs, F. G. Holz, H. P. Scholl, and T. T. Berendschot,
“Quantification of reduced macular pigment optical density in the central retina in macular telangiectasia type 2,”
Exp. Eye Res., 89
(1), 25
–31
(2009). https://doi.org/10.1016/j.exer.2009.02.006 0014-4835 Google Scholar
J. van de Kraats, M. J. Kanis, S. W. Genders, and D. van Norren,
“Lutein and zeaxanthin measured separately in the living human retina with fundus reflectometry,”
Invest. Ophthalmol. Visual Sci., 49
(12), 5568
–5573
(2008). https://doi.org/10.1167/iovs.08-1939 0146-0404 Google Scholar
J. S. Werner, S. K. Donnelly, and R. Kliegl,
“Aging and human macular pigment density: appended with translations from the work of Max Schultze and Ewald Hering,”
Vision Res., 27
(2), 257
–268
(1987). https://doi.org/10.1016/0042-6989(87)90188-X 0042-6989 Google Scholar
J. van de Kraats, T. T. Berendschot, S. Valen, and D. van Norren,
“Fast assessment of the central macular pigment density with natural pupil using the macular pigment reflectometer,”
J. Biomed. Opt., 11
(6), 064031
(2006). https://doi.org/10.1117/1.2398925 1083-3668 Google Scholar
J. van de Kraats, T. T. Berendschot, and D. van Norren,
“The pathways of light measured in fundus reflectometry,”
Vision Res., 36
(15), 2229
–2247
(1996). https://doi.org/10.1016/0042-6989(96)00001-6 0042-6989 Google Scholar
T. T. Berendschot, P. J. DeLint, and D. van Norren,
“Fundus reflectance—historical and present ideas,”
Prog. Retin Eye Res., 22
(2), 171
–200
(2003). https://doi.org/10.1016/S1350-9462(02)00060-5 1350-9462 Google Scholar
T. T. Berendschot and D. van Norren,
“Objective determination of the macular pigment optical density using fundus reflectance spectroscopy,”
Arch. Biochem. Biophys., 430
(2), 149
–155
(2004). https://doi.org/10.1016/j.abb.2004.04.029 0003-9861 Google Scholar
R. A. Bone, J. T. Landrum, L. M. Friedes, C. M. Gomez, M. D. Kilburn, E. Menendez, I. Vidal, and W. Wang,
“Distribution of lutein and zeaxanthin stereoisomers in the human retina,”
Exp. Eye Res., 64
(2), 211
–218
(1997). https://doi.org/10.1006/exer.1996.0210 0014-4835 Google Scholar
R. A. Bone, J. T. Landrum, and J. C. Gibert,
“Macular pigment and the edge hypothesis of flicker photometry,”
Vision Res., 44
(26), 3045
–3051
(2004). https://doi.org/10.1016/j.visres.2004.07.008 0042-6989 Google Scholar
F. C. Delori, D. Goger, P. Salvetti, C. Keilhauer, and G. Staurenghi,
“Spatial distribution of macular pigment in normal subjects,”
Invest. Ophthalmol. Visual Sci., 45
(5), 1288
(2004). 0146-0404 Google Scholar
A. G. Robson, J. D. Moreland, D. Pauleikhoff, T. Morrissey, G. E. Holder, F. W. Fitzke, A. C. Bird, and F. J. van Kuijk,
“Macular pigment density and distribution: comparison of fundus autofluorescence with minimum motion photometry,”
Vision Res., 43
(16), 1765
–1775
(2003). https://doi.org/10.1016/S0042-6989(03)00280-3 0042-6989 Google Scholar
M. Trieschmann, F. J. van Kuijk, R. Alexander, P. Hermans, P. Luthert, A. C. Bird, and D. Pauleikhoff,
“Macular pigment in the human retina: histological evaluation of localization and distribution,”
Eye, 22
(1), 132
–137
(2008). https://doi.org/10.1038/sj.eye.6702780 0950-222X Google Scholar
U. E. Wolf-Schnurrbusch, S. Wolf, D. Völker, C. Brinkmann, S. P. Rothenbuehler, and F. C. Delori,
“Spatial distribution of macular pigment and its relation to the fovea size,”
Invest. Ophthalmol. Visual Sci., 50
(5), 1724
(2009). https://doi.org/10.1167/iovs.08-2970 0146-0404 Google Scholar
|


