

|
|
|
Polarization-sensitive optical coherence tomography (PS-OCT) is an optical imaging technique that can provide not only cross sectional images with a high resolution approaching that of conventional histology, but also polarization information such as Stokes parameters, Jones and Mueller matrices, phase retardation, fast axis orientation, and the degree of polarization.1, 2, 3, 4 A number of medical applications using PS-OCT have been reported, such as dermatology, ophthalmology, and gynecology.5, 6, 7 Recent developments in PS-OCT have focused on frequency domain implementations using either a spectrometer [spectral-domain OCT (SD-OCT)] or a frequency-swept laser source [swept-source OCT (SS-OCT)] because of the sensitivity and imaging speed advantages over conventional time-domain OCT.8, 9, 10 Earlier versions of the SD-PS-OCT system required two spectrometers to detect two orthogonal states of light split by a polarization beamsplitter (PBS).11 However, this approach has disadvantages such as additional costs, larger-sized apparatuses, and hardware- and software-related difficulties with regard to trigger time control. To overcome these problems, several groups have proposed using a single camera in the region.12, 13, 14 Baumann 12 and Cense 13 demonstrated that two orthogonal states of light could be detected, side by side, using a single camera with , half of which detected the horizontal component, while the other half detected the vertical component. They used dispersive grating at different incident angles for the two components (or a specialized Wollaston prism). This is a relatively low-cost configuration, where the trigger control is simplified. However, if the two orthogonally polarized light rays reach the detector array at slightly different angles, the two spectra may not match exactly, which results in distorted spectra and differences of the full bandwidth associated with the rays.12, 14 Fan 14 also presented a single-spectrometer SD-PS-OCT configuration based on the full range of complex domain method for separating the vertical and horizontal polarization beam components. They used whole pixels of the camera for each polarization to avoid the spectral distortion between the two orthogonal components. To separate the two orthogonal components, they used different optical path-length differences for the vertically and horizontally polarized light. Complex conjugate mirror images were eliminated using a constant frequency modulation of the reference mirror. However, this method requires long calculation time because of the need for several postprocessing steps such as averaging, interpolation, full range complex image processing, and image shifting after data acquisition.14 In this work, we demonstrate a simple design for enabling the application of SD-PS-OCT to the region using a single line-scan InGaAs camera with and an optical switch. We obtained the intensity, phase retardation, and fast axis orientation images of a rat tail tendon ex vivo. A schematic of our system is shown in Fig. 1 . The polarization-sensitive low coherence interferometer used in the system is based on the original free-space PS-OCT system.1 A superluminescent diode (SLD) at (DenseLight Semiconductors Incorporated, Singapore) with a full-width-half-maximum of , which corresponds to a theoretical axial resolution of in air, and a power of , was used. Light from the SLD passes through the polarization controller (PC1) and PBS1 to produce horizontally polarized light with maximum optical power. The polarized light is split into the sample and reference arms. In the reference arm, light passes through a quarter-wave plate (QWP1) oriented at with respect to the horizontal axis, so that after double pass, the reflected light from the stationary mirror is in a linear polarized state. In the sample arm, after passing through the QWP2 oriented at to the horizontal plane, the light is circularly polarized when incident on the sample. The circularly polarized light reflected from the 2-D galvanometer passes through the telescope constructed with two convex lenses and an objective lens ( , Mitutoyo, Japan) with a long working distance of , as shown in the upper right corner of Fig. 1. This telescope is used to maintain a flat image plane while scanning. The lateral resolution of our system is approximately . Recombined light from the reference and sample arms is split into two orthogonally polarized states by PBS2. The horizontal and vertical polarization light rays are then delivered to the optical switch (Boston Applied Technologies, Incorporated, Woburna, Massachusetts), which transmits each polarized component toward a single spectrometer by turns. The optical switch is made of electro-optic material; it is a solid-state switch operating in free-space architecture without any moving parts. The insertion loss is minimal and an ultrahigh switching frequency can be achieved . The spectrometer is composed of a transmission diffraction grating ( , Wasatch Photonics, Logan, Utah), achromatic doublet lens ( , Thorlabs Incorporated, Newton, New Jersey), and InGaAs line-scan camera (Goodrich Corporation). The camera has , a resolution of , and a maximum line rate of . Fig. 1(a) Schematic of our PS-OCT system using a single spectrometer and a optical switch. (b) Timing diagrams to synchronize the line-scan camera with the optical switch. The synchronized line trigger (red) for the line-scan camera with the driving signal for the optical switch (blue). (Color online only.)  To synchronize the camera with the optical switch and the 2-D galvanometer, an analog output board with four channels (PCI-6711, National Instruments, Austin, Texas) was used. Figure 1 shows that: 1. a TTL signal of (red) is required for line trigger of the camera, and 2. a TTL signal of (blue) is needed to drive the optical switch. When the channel for the optical switch generates , the vertically polarized light is transmitted to the spectrometer. On the other hand, when the channel for the optical switch generates , the spectrometer detects the horizontally polarized light. Therefore, an A-scan speed of our system is half the speed of the camera. The other two channels of the analog output board generate triangular signals to control the 2-D galvanometer. While B-scanning, the galvanometer was moved by a step so that the two orthogonal signals could be obtained from the same location. After digitization with a frame grabber (PCIe-1427, National Instruments, Austin, Texas), the orthogonal datasets are rescaled, respectively, using the linear interpolation method, because the spectral domain data must be sampled as a function of the wavenumber . Figure 2 shows the raw spectra of the vertically polarized light (black) and the horizontally polarized light (red) after resampling into the -domain when light from the sample arm is blocked. Both spectra with an exact same bandwidth can be detected. Therefore, it should be noted that no software corrections were required. We used PC2 and PC3 to maximize the spectrometer’s efficiency and to correct the distorted spectra of two orthogonal light rays, because the efficiency of the grating and the camera depend to some extent on polarization states. After inverse Fourier transform, we can obtain the total reflected intensity, the phase retardation, and the fast orientation axis images by using equations in the previous paper.11, 12 Fig. 2The vertical (black) and horizontal (red) plane spectra after being resampled into the -domain by a method of the linear interpolation. (Color online only.) 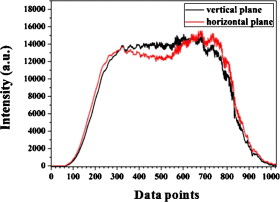 The interval between image pixels in the axial direction of an OCT image should be smaller than half the theoretical axial resolution to satisfy the Nyquist sampling theorem.15 Therefore, the spectrum full bandwidth detected by the spectrometer should be defined by .15 Using our SLD, has to be as broad as to achieve the theoretical axial resolution. However, a broader results in a low depth range, because a camera is a state of the art product. Instead, we chose a value of , because a depth range of at least is needed in most biological tissues. The axial resolution was measured to be in air. The interval value between image pixels in the axial direction was . This value is much greater than half the theoretical axial resolution, which is the main source of the broadening of the axial resolution. An InGaAs line-scan camera with a greater number of pixels can overcome this problem. The sensitivity of the system was approximately for an optical path difference of close to zero when the exposure time was . We could observe a decrease of approximately within a depth range of because of the depth-dependent sensitivity roll-off.10 To test the accuracy of the SD-PS-OCT system, we inserted a QWP into the sample arm between the objective lens and the sample mirror. When we rotated the QWP in steps of , from , we were able to measure the retardation with a constant value of , which shows that the SD-PS-OCT system is stable. To demonstrate the system’s performance in biological tissue, we obtained ex vivo images of a rat tail tendon. Figures 3 , 3, and 3 show the intensity, phase retardation, and fast axis orientation images, respectively. The images are constructed with 512 A-lines separated by in the lateral direction. We reconstructed 3-D volume images (Videos 1 and 2 ) from the intensity and phase retardation datasets using Amira 4.1 (Mercury Computer Systems, Chelmsford, MA). Fig. 3Ex vivo PS-OCT images of the rat tail tendon obtained using Jones matrix formalism. (a) Intensity, (b) phase retardation with grayscale from 0 (black) to (white), and (c) fast axis orientation with grayscale from (black) to (white). 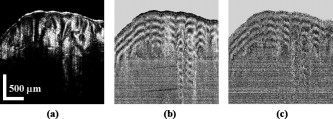 Intensity 3-D volume movie of the rat tail tendon. Each 3-D image has 512 ( axis) ( axis) ( axis) voxels (MPEG, 3.9 MB). .  Phase retardation 3-D volume movie of the rat tail tendon. Each 3-D image has 512 ( axis) ( axis) ( axis) voxels (MPEG, 3.3 MB). . 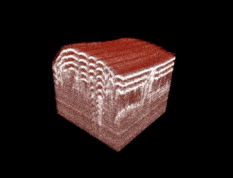 In conclusion, we have developed a new PS-OCT system based on the spectral domain method at the region. We used a high-speed InGaAs line-scan camera and an optical switch to detect the two orthogonal polarizations of light with a single spectrometer. Because we detected the vertically and horizontally polarized light by turns, the line rate of our SD-PS-OCT is half the speed of the line-scan camera. The axial resolution, depth range, and sensitivity of our system are , , and , respectively. To demonstrate the system’s performance in biological tissue, we obtained the intensity, phase retardation, and fast axis orientation images of a rat tail tendon. AcknowledgmentsThis research was supported by a grant (2009K001280) from the Brain Research Center of the 21st Century Frontier Research Program and a grant (20090090250) from Basic Research Program through the National Research Foundation of Korea (NRF) funded by the Ministry of Education, Science, and Technology, Republic of Korea. ReferencesM. R. Hee,
D. Huang,
E. A. Swason, and
J. G. Fujimoto,
“Polarization sensitive low coherence reflectometer for birefringence characterization and ranging,”
J. Opt. Soc. Am. B, 9 903
–908
(1992). https://doi.org/10.1364/JOSAB.9.000903 0740-3224 Google Scholar
S. Jiao and
L. H. V. Wang,
“Jones-matrix imaging of biological tissues with quadruple-channel optical coherence tomography,”
J. Biomed. Opt., 7 350
–358
(2002). https://doi.org/10.1117/1.1483878 1083-3668 Google Scholar
S. Jiao,
G. Yao, and
L. H. V. Wang,
“Depth-resolved two-dimensional Stokes vectors of backscattered light and Mueller matrices of biological tissue measured with optical coherence tomography,”
Appl. Opt., 39 6318
–6324
(2000). https://doi.org/10.1364/AO.39.006318 0003-6935 Google Scholar
S. W. Lee,
J. H. Kang,
J. Y. Yoo,
M. S. Kang,
J. T. Oh, and
B. M. Kim,
“Quantification of scattering changes using polarization-sensitive optical coherence tomography,”
J. Biomed. Opt., 13
(5), 054032
(2008). https://doi.org/10.1117/1.2976430 1083-3668 Google Scholar
M. C. Pierce,
J. Strasswimmer,
B. H. Park,
B. Cense, and
J. F. de Boer,
“Advances in optical coherence tomography imaging for dermatology,”
J. Invest. Dermatol., 123 458
–463
(2004). https://doi.org/10.1111/j.0022-202X.2004.23404.x 0022-202X Google Scholar
B. Cense,
T. C. Chen,
B. H. Park,
M. C. Pierce, and
J. F. de Boer,
“In vivo depth-resolved birefringence measurements of the human retinal nerve fiber layer by polarization-sensitive optical coherence tomography,”
Opt. Lett., 27 1610
–1612
(2002). https://doi.org/10.1364/OL.27.001610 0146-9592 Google Scholar
S. W. Lee,
“Optical diagnosis of cervical intraepithelial neoplasm (CIN) using polarization-sensitive optical coherence tomography,”
Opt. Express, 16 2709
–2719
(2008). https://doi.org/10.1364/OE.16.002709 1094-4087 Google Scholar
Y. Yasuno,
S. Makita,
Y. Sutoh,
M. Itoh, and
T. Yatgai,
“Birefringence imaging of human skin by polarization-sensitive spectral interferometric optical coherence tomography,”
Opt. Lett., 27 1803
–1805
(2002). https://doi.org/10.1364/OL.27.001803 0146-9592 Google Scholar
B. H. Park,
“Real-time fiber-based multi-functional spectral-domain optical coherence tomography at ,”
Opt. Express, 13 3931
–3944
(2005). https://doi.org/10.1364/OPEX.13.003931 1094-4087 Google Scholar
J. Zhang,
W. Jung,
J. S. Nelson, and
Z. Chen,
“Full range polarization-sensitive Fourier domain optical coherence tomography,”
Opt. Express, 12 6033
–6039
(2004). https://doi.org/10.1364/OPEX.12.006033 1094-4087 Google Scholar
E. Gotzinger,
M. Pircher, and
C. K. Hitzenberger,
“High speed spectral domain polarization sensitive optical coherence tomography of the human retina,”
Opt. Express, 13 10217
–10229
(2005). https://doi.org/10.1364/OPEX.13.010217 1094-4087 Google Scholar
B. Baumann,
E. Gotzinger,
M. Pircher, and
C. K. Hitzenberger,
“Single camera based spectral domain polarization sensitive optical coherence tomography,”
Opt. Express, 15 1054
–1063
(2007). https://doi.org/10.1364/OE.15.001054 1094-4087 Google Scholar
B. Cense,
M. Mujat,
T. C. Chen,
B. H. Park, and
J. F. de Boer,
“Polarization-sensitive spectral-domain optical coherence tomography using a single line scan camera,”
Opt. Express, 15 2421
–2431
(2007). https://doi.org/10.1364/OE.15.002421 1094-4087 Google Scholar
C. M. Fan,
Y. Wang, and
R. K. K. Wang,
“Spectral domain polarization sensitive optical coherence tomography achieved by single camera detection,”
Opt. Express, 15 7950
–7961
(2007). https://doi.org/10.1364/OE.15.007950 1094-4087 Google Scholar
M. Wojtkowski,
V. J. Srinivasan,
T. H. Ko,
J. G. Fujimoto,
A. Kowalczyk, and
J. S. Duker,
“Ultrahigh-resolution, high-speed, Fourier domain optical coherence tomography and methods for dispersion compensation,”
Opt. Express, 12 2404
–2422
(2004). https://doi.org/10.1364/OPEX.12.002404 1094-4087 Google Scholar
|


