|
|
1.IntroductionThe main function of the cardiovascular system is to provide, through perfused vascular beds, the necessities for living tissues and organs. The distributing arterial trees transport oxygen, humoral agents, and nutrients to the vital parts of the body; in the mean time, the venous trees collect metabolic wastes.1 Microcirculation, the distal functional unit of the cardiovascular system, provides exchange sites for gases, nutrients, metabolic wastes, and thermal energy between the blood and the tissues. Pathologic microcirculation reflects the breakdown of homeostasis in organisms, which ultimately leads to tissue inviability. Thus, in vivo microvascular imaging and characterization is of significant physiological, pathophysiological, and clinical importance. Well-established clinical imaging modalities such as magnetic resonance imaging (MRI), computed tomography (CT), positron emission tomography (PET), and ultrasound imaging have been adopted for vascular imaging.2, 3, 4, 5, 6, 7 However, these techniques often lack either sufficient spatial resolution or satisfactory contrast (or both) to be effective for microvascular imaging.8 To bridge this gap, optical microscopy has been widely used to dissect the delicate features of the microvasculature. Intravital microscopy (IVM), the gold standard for microcirculation studies, enables quantification of vessel count, diameter, length, density, permeability, and blood flow velocity.9 Nevertheless, to observe capillaries in vivo, IVM generally requires transillumination and surgical preparation, which disturb the intrinsic microvasculature and are restricted to limited anatomical sites. Moreover, conventional IVM lacks the depth resolution that is crucial for characterizing three-dimensional (3-D) microvascular morphology. Confocal microscopy and two-photon microscopy (TPM) avoid such invasive preparation and enable volumetric visualization of the microvasculature.10, 11 However, their imaging contrasts come primarily from exogenous fluorescent agents, which—though having been very successful in laboratory research—are still facing challenges in clinical translations.12 Orthogonal polarization spectral (OPS) imaging enables intrinsic microvascular imaging;13 however, it provides only a two-dimensional (2-D) visualization of the microvasculature and lacks the measurement consistency required for chronic studies.14 Doppler optical coherence tomography (D-OCT) demonstrates the intrinsic imaging of microvascular perfusion by extracting blood flow information,15 but its resolution and sensitivity are not yet sufficient to image single capillaries. More importantly, among the mainstream techniques already mentioned, only OPS imaging can assess the functional parameter of total hemoglobin concentration (HbT), and none of them have direct access to hemoglobin oxygen saturation —another important functional parameter. To measure in vivo, the following strategies have been adopted. First, Raman spectroscopy has been integrated into IVM; however, the resonance Raman signals generated in tissue compartments other than blood could interfere with the analysis of hemoglobin.16 Second, hyperspectral imaging has been integrated into optical coherence tomography (OCT); nevertheless, it requires transillumination and provides only 2-D mapping.17 Finally, TPM has recently made exciting progress in terms of label-free imaging.18, 19 With TPM, microvascular morphology and oxygenation have been imaged in vivo without fluorescence labeling; however, quantification is not yet available due to the limited signal-to-noise ratio19 (SNR). In contrast, photoacoustic tomography (PAT) can overcome these limitations. Photoacoustics, a physical phenomenon first reported for wireless communication,20 describes the generation of acoustic waves from an object absorbing pulsed or intensity-modulated optical irradiation. With technical advances in laser sources and ultrasonic detectors, photoacoustics was investigated by the biomedical imaging community for tomographic imaging. In PAT, the target is irradiated by a short-pulsed or intensity-modulated continuous-wave (cw) laser beam, and ultrasonic waves (referred to as photoacoustic waves) are induced as a result of the transient thermoelastic expansion.21, 22 By detecting the excited photoacoustic signals, PAT can reveal the physiologically specific absorption signatures of endogenous chromophores, such as hemoglobin and melanin in vivo. More importantly, with spectroscopic measurements, PAT can quantify hemoglobin oxygenation within single vessels, providing important metabolic information about the microcirculation. A comprehensive comparison of PAT with the well-established in vivo microvascular microscopy and clinical angiography can be found in Table 1 . Table 1Comparison between PAT and well-established in vivo microvascular microscopy and clinical angiography.
CM, confocal microscopy; US, ultrasound imaging. The advantages of PAT are summarized as follows. First, endogenous optical absorption contrast enables23, 24, 25 label-free imaging of the microvasculature with a high SNR. Second, in vivo vascular imaging of small animal models can cover the length scale from a superficial capillary25 to an abdominal aorta,26 demonstrating the potential of PAT to bridge the resolution and penetration gaps between microvascular microscopy and clinical angiography. Third, spectroscopic measurement enables vessel-by-vessel mapping of blood oxygenation.27, 28 Fourth, time-resolved ultrasonic detection avoids depth scanning. Finally, working in reflection or orthogonal mode noninvasively makes this technique applicable to more anatomical sites in vivo. This paper is focused on the photoacoustic imaging and characterization of the microvasculature; however, PAT is not limited to this application. General reviews on other aspects of PAT can be found in previously published papers.21, 22, 29, 30, 31 The rest of the paper is organized as follows. First, three different embodiments of PAT are reviewed, including photoacoustic microscopy (PAM), photoacoustic computed tomography (PACT), and photoacoustic endoscopy (PAE). Then, the strategies used to characterize functional microvascular parameters—such as HbT, , and blood flow—are discussed. Afterward, some representative applications of photoacoustic microvascular imaging are introduced, including both physiological studies and clinically translatable research. The paper ends with a short discussion of several technical advances and potential prospects. 2.PAT SystemPAT has three major forms of implementation. The first one, as just mentioned, is microscopy based on 2-D raster scanning. Optical-resolution photoacoustic microscopy25, 32, 33, 34, 35, 36 (OR-PAM) and acoustic-resolution photoacoustic microscopy24, 28, 37, 38, 39 (AR-PAM) fall into this category. The second form is computed tomography based on a circular-scanning single-element ultrasonic transducer,23, 40, 41, 42 a one-dimensional (1-D) linear/curved ultrasound array,26, 43, 44, 45, 46, 47, 48, 49, 50, 51, 52, 53, 54 a 2-D optical-interferometry-based acoustic sensor,55, 56, 57, 58, 59, 60 or other multiple-detector configurations, where a software- or hardware-based reconstruction algorithm is required to form an image. The third form is endoscopy,61 which has recently been advanced from 1-D sensing to 2-D imaging.62, 63 Another form of miniaturization is aimed at intravascular imaging.64, 65, 66 Table 2 compares various embodiments of PAT.24, 25, 38, 46, 60, 63, 67 In the interest of manuscript length, other novel designs68, 69, 70, 71 are not covered in detail. Table 2Comparison between different embodiments of PAT.
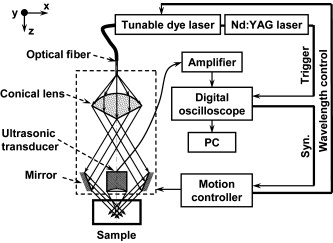
2.1.OR-PAMIn PAM, volumetric imaging is realized by point-scanning the dual foci of optical illumination and ultrasonic detection. To maximize the imaging sensitivity, these two foci are configured coaxially and confocally. In this case, the lateral resolution of PAM is determined by the product of the two point-spread functions (PSFs). Since capillary-level acoustic resolution requires very high ultrasonic frequency and thereby seriously limits the penetration depth, nearly diffraction-limited optical focusing is employed to achieve micrometer resolution. This technique is referred to as OR-PAM. OR-PAM, capable of resolving single red blood cells,72 was first reported for in vivo label-free capillary imaging,25 and later was refined for microhemodynamic studies34 and chronic microvascular imaging.33 As shown33 in Fig. 1 , the illumination source is a laser system consisting of a pump laser and a dye laser, which provides a wavelength-tunable output with a pulse width and a repetition rate of up to . The laser beam is reshaped by a pinhole and then focused by a microscope objective into a nearly diffraction-limited spot. An acoustic-optical beamsplitter, consisting of two right-angle prisms and a thin layer of silicone oil, is positioned under the objective lens to separate optical illumination and acoustic detection. A ultrasonic transducer is attached to the vertical side of the bottom prism. Generated photoacoustic signals are collected by an acoustic lens, redirected by the acoustic-optical beamsplitter, and received by the transducer. Through time-resolved ultrasonic detection and 2-D raster scanning along the transverse plane, complete volumetric information is recorded, and can be viewed in maximum amplitude projection (MAP) image [Fig. 2 ] or direct 3-D rendering [Fig. 2; video available in Ref. 34]. Recently, the imaging speed of OR-PAM has been significantly improved by utilizing galvanometer-based optical scanning; however, the SNR can be improved further.35 Fig. 2Representative microvascular network in a nude mouse ear imaged in vivo by OR-PAM: (a) maximum amplitude projection image and (b) 3-D morphology. Reproduced with permission from Ref. 34. 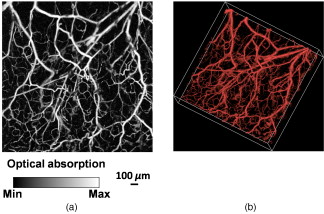 2.2.AR-PAMOR-PAM, relying on the nearly diffraction-limited optical focusing, has a penetration limit similar to that of the existing optical ballistic imaging modalities. To break through the so-called soft limit—one optical transport mean free path ( in biological tissues)—Maslov developed AR-PAM to probe, with high spatial resolution, photon absorption in the diffusive regime.37 As already mentioned, the lateral resolution of PAM is determined by the overlap of the acoustic and optical foci. Since ultrasonic scattering per unit path length in tissues is two to three orders of magnitude weaker than optical scattering,73 acoustic focusing is adopted to maintain a relatively high spatial resolution in deep tissues (up to several centimeters). Optical illumination is still weakly focused, enabling more efficient local photon energy deposition. This technique is referred to as AR-PAM. Figure 3 shows the most mature version74 of AR-PAM, called dark-field PAM. Here, a pulsed laser beam from a wavelength-tunable laser system is delivered through an optical fiber and reshaped by a conical lens to form a ring pattern. It is then weakly focused by an optical condenser lens to overlap the tight ultrasonic focus beneath the tissue. The optical illumination is solid only within the focal zone and is donut-shaped elsewhere, which greatly eliminates the surface signals. Moreover, with this dark-field configuration, an ultrasonic transducer can be placed within the dark zone, providing no interference with the optical illumination. A representative microvascular image acquired by AR-PAM is shown74 in Fig. 4 . Note that the spatial resolution, as well as the penetration depth, is highly scalable according to the ultrasonic frequency chosen.21 However, there is a trade-off between the spatial resolution and the penetration depth: higher ultrasonic frequency gives better acoustic resolution but also presents more acoustic attenuation in biological tissues. For example, a lateral resolution of and a maximum penetration of more than was achieved24, 75 with an ultrasonic center frequency of [acoustic lens numerical aperture (NA): 0.44]; a lateral resolution of and a penetration of up to was achieved38, 39 with a center frequency of (transducer /#: 1.33). When the acoustic resolution is larger than , the typical lateral resolution of human eyes at a normal observation distance, this instrument turns into an acoustic-resolution photoacoustic macroscope (AR-PAMac). Fig. 4Structural imaging of the subcutaneous microvasculature in a rat in vivo: (a) maximum amplitude projection image and (b) 3-D morphology. Reproduced with permission from Ref. 74.  2.3.Ultrasound-Array-Based Photoacoustic Computed Tomography (UA-PACT)Although PAM offers high resolution and sensitivity, the acoustic-optical confocal configuration is somewhat sophisticated, the 2-D raster scanning is usually time-consuming, and the depth of focus is sometimes insufficient to image tissues with uneven surfaces.76 The limited depth of focus, however, can be extended using the synthetic aperture algorithm based on a virtual detector concept.38, 77 To overcome all these limitations, the entire region of interest (ROI) is simultaneously excited by a full-field optical illumination, and the photoacoustic data acquired by an ultrasound array is numerically focused to essentially everywhere in the ROI for cross-sectional scan (B-scan) or volumetric imaging without mechanical scanning. This technique is referred to as UA-PACT, although the principle of PACT can be demonstrated with a single-element ultrasonic transducer.23, 67 Figure 5 shows a representative linear-array-based PACT system.46 The pulsed laser beam delivered via a multimode optic fiber is split into two routes. The two beams are reflected and then focused by their respective cylindrical lenses. Dark-field illumination is adopted to increase the local fluence, and thus a fast PAM laser (at repetition rate) can be utilized, in combination with a 48-element linear transducer array, to achieve real-time imaging. With this configuration, a B-scan frame rate and a volumetric frame rate have been achieved.46 Fig. 5Schematic of the 48-element linear-array-based PACT system. Reproduced with permission from Ref. 46. PCI: peripheral component interconnect; DAQ: data acquistion; LDPF: low-density polyethylene.  Besides the linear array, a curved transducer array has also been used in PACT to image the anatomical sites with curved surface contours, such as the brain or the peripheral joint. Figure 6 shows a representative curved-array-based PACT system.50 The laser beam from a wavelength-tunable laser system is expanded and homogenized to provide uniform incident fluence. A 512-element ring-shape array encircles the ROI to detect the photoacoustic signals. The detected signals are amplified and digitized before a software-based image reconstruction is performed. Since the optical illumination covers the whole ROI, which is much larger than the focal area in PAM, stronger laser pulse energy is required to maintain sufficient local fluence. In this case, a pump laser with higher pulse energy than the high-repetition-rate PAM laser is required, at the expense of the repetition rate . With this curved-array-based PACT system, a maximum imaging rate of with full tomographic resolution was achieved, which is limited by the data acquisition system. Although beyond the scope of this paper, note that Brecht recently has successfully demonstrated 3-D whole-body imaging of nude mice in vivo using a curved-array-based PAT system. 26 Fig. 6Schematic of the 512-element ring-array-based PACT system. Reproduced with permission from Ref. 50. MSPS: mega samples/s; MUX: multiplexer; FPGA: field-programmable gate array. 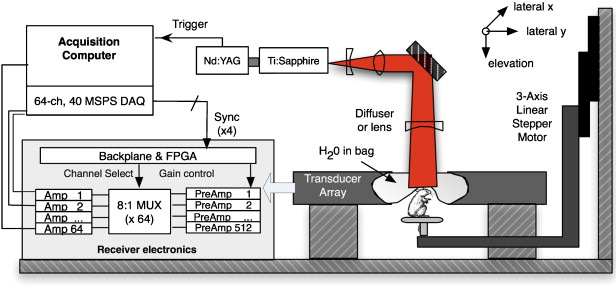 2.4.Optical-Detection-Based Photoacoustic Computed Tomography (OD-PACT)Although the piezoelectric ultrasound array has been widely used in PAT, its detection sensitivity falls off with decreasing element size. A higher frequency array offers higher spatial resolution at the expense of SNR. To overcome this limitation, several different optical methods have been proposed for ultrasonic detection.55, 56, 57, 58, 59, 60, 78, 79 So far, the Fabry-Pérot interferometer (FPI)-based PACT system56 (Fig. 7 ) shows the best performance among all the optical-detection methods. In this mechanism, a planar FPI is placed in contact with the tissue surface. Thus, the optical thickness of the FPI is modulated by the photoacoustic signal exiting the tissue. A focused cw probe beam is launched onto the FPI, and the local modulation in the optical thickness is encoded in the back-reflected interference signal generated by the FPI. A 2-D raster scanning of the focused probe beam will provide an ultrasonic pressure mapping on the tissue surface. A reconstruction algorithm will further recover the volumetric distribution of the tissue absorption60 (Fig. 8 ). Fig. 7Schematic of the FPI-based PACT system. Reproduced with permission from Ref. 56. OPO: optical parametric oscillator; DSO: digitizing oscilloscope.  Fig. 8FPI-based PACT of the vasculature in a human palm in vivo. Excitation wavelength is . Left, photograph of the imaged region; middle, volume rendered image; and right, lateral slices at different depths. The arrow A indicates the deepest visible vessel, which is located beneath the surface of the skin. Reproduced with permission from Ref. 60.  2.5.PAEAlthough PAM and PACT have broken through the soft limit in biological tissues, they cannot go beyond the hard limit in their present forms.21 However, deep imaging with adequate spatial resolution is highly desirable for the clinical translation of PAT, as numerous cardiovascular diseases lie in internal organs away from the skin surface. With minimally invasive endoscopy, efficient optical illumination and ultrasonic detection of interior organs can be achieved at distance from the skin surface far beyond the hard limit. A prototype of 1-D sensing PAE was reported by Viator, 61 and recently a B-mode PAE was developed.62, 63 Figure 9 shows the recently reported PAE system.62 In the endoscopic probe, the pulsed laser beam from a high-repetition-rate PAM laser is delivered by an optical fiber and emitted through the central hole in an ultrasonic transducer. A mirror, driven by a micromotor through two magnets, rotates both the optical illumination and the ultrasonic detection to accomplish a cross-sectional scan (Fig. 10 ). In the future, a spiral-scanning mechanism can be adopted from OCT endoscopy80 for volumetric imaging. Fig. 10(a) Photograph of a PAE-inserted intestinal tract. The yellow dotted arrow indicates the scanning direction. Photoacoustic images are represented in (b) Cartesian coordinates and (c) polar coordinates. The ROI is marked by white dotted circles in (a) and (b), and by a white block arrow in (c). Reproduced with permission from Ref. 62. (Color online only.)  3.Photoacoustic Characterization of Functional Microvascular ParametersBesides the microvascular morphology information that can be directly extracted from a 2-D (Ref. 81) or 3-D (Ref. 82) photoacoustic image, several important functional parameters, such as HbT, , and blood flow, are also available or potentially measurable on additional imaging acquisition and data processing. These functional parameters are closely related to local energy metabolism and have been widely used in neuroscience23, 83 and disease84, 85 studies. 3.1.Quantification of Total Concentration and Oxygen Saturation of HemoglobinIn photoacoustic measurements of HbT and , we assume that in the visible spectral range, oxyhemoglobin and deoxyhemoglobin (HbR) are the dominant absorbers in blood.27 Taking advantage of the oxygenation dependence in hemoglobin absorption, PAT can use spectral measurements to quantify the relative concentrations of and HbR within single microvessels, on which the relative HbT and absolute can be computed. Based on the preceding assumption, the blood absorption coefficient can be expressed as28 where is the local blood absorption coefficient at wavelength ; and are the molar extinction coefficients of HbR and , respectively, which can be found from previously published measurements;86, 87 [HbR] and are their relative concentrations at the local position. The detected photoacoustic signal amplitude is proportional to the product of and the local optical fluence.73 Assuming that the optical fluence is wavelength independent, we can replace by in Eq. 1 and calculate [HbR] and in relative values. Afterward, the can be computed asAlthough a dual-wavelength measurement is adequate to calculate , using more wavelengths is expected to yield more accurate results.28Here, the optical fluence is assumed to be wavelength independent, which is usually an approximation because of the wavelength dependence in tissue absorption and scattering. To recover accurate values, fluence compensation is necessary. Substantive work has been undertaken on this topic; multiple numerical-model-based88, 89, 90 and experimental-measurement-based27, 28 compensation strategies have been proposed. Although the numerical model works fairly well in phantom studies, it still requires further improvements to take into account the strong heterogeneity in the structure and composition of real biological tissues. Some experimental approaches are to measure the photoacoustic spectrum of an inserted neutral absorber in vivo 28 or the wavelength-dependent light transmission through a piece of excised tissue in vitro,27 which are quite invasive and represent tentative measures. Recently, Rajian employed an optical contrast agent to enhance the performance of spectroscopic photoacoustic techniques.91 The local optical fluence can be recovered by photoacoustic measurements with and without the contrast agent in a tissue phantom. This method is noninvasive and relatively simple. In vivo clinical application is highly likely. HbT can be computed in relative values as the summation of [HbR] and . Alternatively, HbT can also be directly measured in a relative manner. In the visible and near-IR regions of the hemoglobin absorption spectra,86 there are multiple isosbestic points (390, 422, 452, 500, 530, 545, 570, 584, and ) where the molar extinction coefficients of HbR and are equal. Thus, photoacoustic signals acquired at such wavelengths reflect HbT only, regardless of the hemoglobin oxygenation level. 3.2.Photoacoustic Flow MeasurementBlood flow, in combination with the current available photoacoustic measurements of HbT, of , and of vessel diameter, can enable the quantification of tissue oxygen metabolism, which can potentially be used to visualize neuroactivity or to measure hypermetabolism—a hallmark of cancer.22 However, pulsed or color Doppler ultrasound imaging is not ideal for measuring the microvascular blood flow due to limited sensitivity and spatial resolution. D-OCT has been very successful in blood flow mapping.92, 93, 94, 95 Nevertheless, the so-called interference fringe blurring limits its maximum detectable velocity.96 Recently, Fang invented photoacoustic Doppler flowmetry97, 98 (PADF), where the undergoing photoacoustic Doppler shift due to the relative motion between the photoacoustic source and the acoustic detector is measured to reveal the traveling speed of the photoacoustic source. Flow measurements based on the observed photoacoustic Doppler effect have been performed in both clear and turbid media. Figure 11 is a schematic of the PADF system.97 The targeted optically absorbing particle with a flow speed of is excited by an intensity-modulated laser beam. The photoacoustic process is the same as that for a stationary particle. Because of the particle motion, the photoacoustic wave detected by an ultrasonic transducer has a Doppler shift expressed as97 where is the intensity-modulation frequency, is the speed of sound, and is the angle between the propagating direction of the detected photoacoustic wave and the particle traveling direction. Given an experimentally measured , the particle flow speed can be computed.Fig. 11Schematic for the photoacoustic Doppler flowmetry system. Reproduced with permission from Ref. 97.  As discussed in Refs. 97, 98, the power spectrum of the measured photoacoustic Doppler signal broadens with increasing flow speed. Thus, the maximum detectable velocity by PADF is limited by the SNR because the spectral amplitude will eventually approach the noise level due to the spectral broadening. The current PADF system cannot detect flow speed greater than in turbid media because of the poor SNR of the intensity-modulated photoacoustic mechanism.98, 99 To measure in vivo blood flow at a higher speed, a PADF system with higher SNR is required. Theoretically, the minimum detectable velocity (velocity sensitivity) by PADF can be as low as , which is limited by the Brownian motion;97 however, the instability in the light-intensity modulation is expected to further degrade the velocity sensitivity. The experimentally measured98 velocity sensitivity of the current PADF system is , which is adequate to detect blood flow in capillaries (the average velocity is97 a fraction of mm/s). However, a better velocity sensitivity is highly desirable to cover some cases with extremely slow capillary flows, as reported in the dermis.100, 101 Moreover, PADF can detect the flow only along the ultrasonic axis.102 To image transverse flow and slow capillary flow, Fang and Wang102 developed an M-mode photoacoustic particle imaging velocimetry based on OR-PAM. A similar configuration was previously employed by Zharov 103, 104, 105 and Galauzha 106 for counting circulating cells in vivo. Recently, Li 107 and Wei 108 reported another photoacoustic flow measurement based on the wash-in analysis of gold nanorods. In the proposed method, high-energy laser pulses at the absorption peak of the nanorod are used to induce changes in the nanorod shape; consequently, the absorption peak of the nanorods is shifted, and the photoacoustic signal is significantly reduced. On the wash-in of new gold nanorods, the photoacoustic signal is retrieved. The replenishing rate of the nanorod is highly correlated with the flow speed. Thus, by analyzing the time-intensity curve of the photoacoustic signal, researchers can recover the flow information. 4.Photoacoustic Microvascular Imaging in BiomedicineHaving the capabilities of providing high endogenous contrast, good spatial and temporal resolutions, deep tissue penetration, and important morphological and functional information, PAT holds potentially broad applications in microvascular-related physiological, pathophysiological, and clinical studies. Only a few representative applications can be covered here, in the interest of manuscript length. More applications can be found in literature.65, 109 4.1.Microhemodynamic MonitoringVasodilation and vasomotion110, 111 are two important microhemodynamic activities in tissue oxygen regulation; however, the underlying mechanism of vasomotion remains elusive.110 Taking advantage of the high spatial and temporal resolutions of OR-PAM, Hu recently explored vasomotion and vasodilation in response to tissue oxygen variation.34 A representative microvascular network in a nude mouse ear was imaged by a dual-wavelength OR-PAM measurement under systemic normoxia (Fig. 12 ). According to the mapping, a B-scan position was selected for microhemodynamic monitoring, which contained an arteriole-venule pair [A1 and V1 in Fig. 12]. During the monitoring session, the physiological state of the mouse was switched between systemic hyperoxia and hypoxia. Vasomotion and vasodilation were clearly exhibited, respectively, by the oscillation and the expansion in vessel diameters [Figs. 13 and 13 ]. To provide quantitative analysis, the vessel diameter was estimated by the full width at half maximum (FWHM) value of the blood vessel signal in each B-scan [Fig. 13]. Data analysis [Figs. 13 and 13] suggested that arteriole A1 had a more significant vasomotion than did V1 under hyperoxia but with a similar oscillation frequency of (cpm), which is in good agreement with the observation from a previous invasive study.112 By isolating the vasodilation effect, an increase of in the arteriolar diameter and in the venular diameter under hypoxia was observed [Fig. 13], which agrees with a scanning laser fluorescent ophthalmoscopy study.113 The response time of vasodilation to systemic hypoxia is estimated to be . Fig. 12Structural and functional microvascular imaging of a nude mouse ear in vivo by OR-PAM: (a) structural image acquired at and (b) vessel-by-vessel mapping based on dual-wavelength (570 and ) measurements. The calculated values are shown in the color bar. PA, photoacoustic signal amplitude; A1, a representative arteriole; V1, a representative venule; yellow dashed line: the B-scan position for Fig. 13. Reproduced with permission from Ref. 34. (Color online only.)  Fig. 13Vasomotion and vasodilation in response to switching the physiological state between systemic hyperoxia and hypoxia: (a) B-scan monitoring of the changes in the cross section of arteriole A1 (movie available in the reference). (b) B-scan monitoring of the changes in the cross section of venule V1, (c) changes in arteriolar and venular diameters in response to changes in physiological state (raw data were smoothed via 60-point moving averaging to isolate the effect of vasodilation), (d) power spectrum of the arteriolar vasomotion tone, and (e) power spectrum of the venular vasomotion tone. Reproduced with permission from Ref. 34. 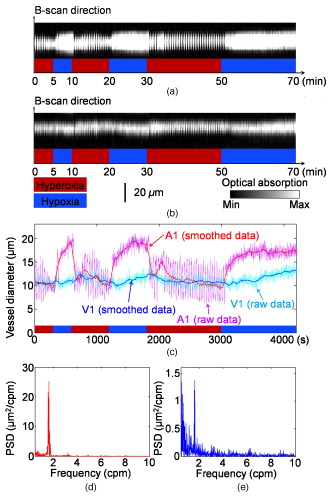 Some other hemodynamics—such as blood oxygenation variation in the mouse brain cortex, vessel response to photodynamic therapy, and blood/hemolymph sedimentation—have also been studied by PAT, as can be referenced in previously published papers.114, 115, 116, 117 4.2.Functional Chronic ImagingChronic imaging of the microcirculation enables direct visualization of long-term microhemodynamics, opening a window for tracing disease progression (for example, tumor angiogenesis24, 118, 119), neural plasticity, and functional recovery from pathological states. Recently, the capability of OR-PAM for functional chronic imaging was demonstrated by monitoring the wound-healing process in murine microvasculature in vivo.33 A microvascular network in a mouse ear was randomly picked out, and the central part was treated under a focused cw laser beam for to create a microvascular wound. The ROI was imaged, both before [Fig. 14 ] and immediately after the cw laser treatment [Fig. 14], as well as in the subsequent [Figs. 14(c-1) to 14(c-12)], using both OR-PAM and a commercial transmission-mode optical microscope. The results clearly show a four-step wound-healing process: (1) vessel regression and hemostasis [Fig. 14]; (2) inflammation induced vasodilation [Figs. 14(c-1) to 14(c-5)], and hypoxia facilitated angiogenesis [Figs. 14 and 14(c-1) to 14(c-5)]; (3) ingrowth of new capillaries to restore the microcirculation [Fig. 14(c-3)]; and (4) morphological and functional recovery [Fig. 14(c-12)]. This observation is confirmed by known physiology.120 Fig. 14In vivo monitoring of the healing process of a laser-induced microvascular lesion by optical-resolution photoacoustic microscopy: (a) before laser destruction, (b) immediately after laser destruction, and (c) on each of the subsequent . The left image in each part, (a) through (c-12) is a photograph taken by a commercial transmission-mode optical microscope; the middle one is the front view of the 3-D microvascular morphology acquired by an optical-resolution photoacoustic microscope at ; the right one is the maximum-amplitude projection image overlaid by the mapping of the laser-damaged region. Reproduced with permission from Ref. 33.  4.3.Tumor-Vascular InteractionsTumor progression depends on a number of sequential steps, including initial tumor-vascular interactions, recruitment of blood vessels, and tumor cells interacting with the surrounding microenvironment. The failure of a tumor to recruit new vasculature or to reorganize the existing surrounding vasculature results in a nonangiogenic and nonprogressing stable tumor.121 Thus, functional imaging of tumor-vascular interactions is of great clinical importance. Recently, spectroscopic photoacoustic tomography (SPAT) was applied in combination with molecular biomarkers to study the interrelationships between hemodynamics and tumor progression.85 Human U87 glioblastoma tumor cells were implanted stereotactically into young adult immunocompromised nude mice. One week after inoculation, IRDye800-c(KRGDf) was systematically administered through the tail vein to visualize newly formed tumor microvessels. Figure 15 shows the tumor angiogenesis image acquired by SPAT after the injection of IRDye800-c(KRGDf). Tumor hypoxia was also imaged by SPAT [Fig. 15]. Quantitative analysis reveals that the level in the tumor vasculature is more heterogeneous than that in the normal vessels, and the average in the tumor vasculature is at least 13% lower than that in the normal vasculature. Fig. 15Spectroscopic photoacoustic tomography of a nude mouse brain with a U87 glioblastoma xenograft in vivo: (a) composite of segmented molecular image of IRDye800-c(KRGDf) and structural image and (b) mapping. Reproduced with permission from Ref. 85.  With finer spatial resolution, PAT can directly visualize tumor angiogenesis.24 Figure 16 shows the AR-PAM imaging of a rat vascular network at three different time points: before, after, and after the subcutaneous inoculation of tumor cells. Tumor vasculature exhibits greater vessel complexity and higher density than the surrounding healthy tissue.24 Fig. 16Maximum-amplitude projection images of a microvascular network in a rat acquired in vivo by AR-PAM at the isosbestic optical wavelength of (A) before, (B) after, and (C) after subcutaneous inoculation with BR7C5 tumor cells. Reproduced with permission from Ref. 24. 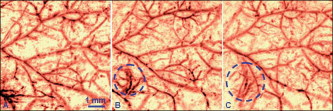 4.4.Neurovascular CouplingAdvances in brain imaging facilitate the fundamental understanding of cognitive phenomena and neurological diseases. However, the traditional procedure of using microelectrodes is quite invasive, thereby limiting the number of recordings and discouraging chronic study. Alternatively, downstream hemodynamics originating from the brain microcirculation has been recorded to retrace brain functions.83 PACT was applied to visualize the response in the brain cortex of rats to whisker stimulation.23 HbT with and without whisker stimulation are recorded sequentially at an isosbestic optical wavelength. Functional signal—the difference in photoacoustic signal strength recorded with and without stimulation—is expected to be from the stimulation-induced hemodynamic change. The experimental results show that vascular patterns in the activated regions match the distribution of functional signals well, indicating that the functional signals detected by PACT did result from hemodynamic changes in the blood vessels of the superficial cortex. Histological evaluation also shows a good colocalization between the whisker-barrel cortex and the activated regions in the PACT images. Note that OR-PAM has successfully demonstrated brain microvascular imaging down to single capillaries through intact mouse skulls in vivo.32 Functional brain mapping at micrometer resolution is anticipated. 5.Discussion and PerspectivesTaking advantage of the highly scalable spatial resolution and penetration depth, and of the unique optical absorption contrast, PAT will no doubt find its position in fundamental physiological research and clinical care, especially in the cardiovascular field. Several technical advances, as follows, might make it serve better. 5.1.System Refinement Toward Clinical ApplicationsPAT is safe for clinical applications as it generally delivers optical fluence well within the American National Standards Institute (ANSI) safety standards.21, 24, 75 AR-PAM has imaged the subcutaneous microvasculature in a human palm, showing24 a high contrast-to-noise ratio of . Several pilot clinical studies have been reported in imaging port-wine stains122, 123, 124 (PWS), HbT (Refs. 125, 126) and (Ref. 127). However, technical improvement is required to facilitate an effective clinical translation. For internal organ (such as gastrointestinal tract and prostate) imaging, PAE is an ideal tool. Recent progress in PAE is exciting;62, 63 nevertheless, its size must be further reduced to be compatible with generic endoscopes, and its spatial and temporal resolutions require improvements. For cutaneous applications, such as skin cancer detection and cutaneous vascular lesion diagnosis, a multiscale, handheld photoacoustic probe is required, which would enable users to select an optimal trade-off between the spatial resolution and the penetration depth for different clinical applications. Multimodality imaging, providing complementary information for more accurate diagnosis, is always favorable. PAT combined with confocal microscopy, TPM, OCT (Ref. 128), ultrasound imaging,47, 129, 130 or MRI (Ref. 131) will provide fruitful anatomical, functional, and molecular information. 5.2.SNR and Contrast EnhancementIn PAT, the high optical absorption of hemoglobin in the visible spectral region provides strong photoacoustic signals and high SNR at an ANSI-approved optical fluence level. However, the high absorption also prevents photons from penetrating into deeper regions. When the near-IR window is used for deep penetration, the photoacoustic signal from the microvasculature is compromised and typically requires averaging to enhance the SNR and contrast.21 Current strategies, such as the synthetic aperture focusing technique77, 132 (SAFT), the virtual point detection mechanism,133, 134 the adaptive beam forming method,135 and the exogenous vascular contrast agent136, 137, 138 have made remarkable progress. However, further exploration is required to escape from this dilemma. 5.3.Fluence CompensationAs discussed in Sec. 3.1, PAT is capable of imaging in microvasculature by comparing the experimentally measured photoacoustic spectrum with the known absorption spectra of HbR and . Using a spectroscopic analysis, the relative concentrations of HbR and can be recovered. However, spectroscopic problems such as this are more challenging in photoacoustic imaging mainly because PAT detects specific optical absorption—proportional to the product of the absorption coefficient and the local optical fluence—rather than the absorption coefficient.139 Accurate fluence compensation will promote PAT from qualitative or quasiquantitative characterization to a higher level, offering more robust quantitative analysis toward clinical applications. AcknowledgmentsThe authors appreciate Dr. Lynnea Brumbaugh’s close reading of the manuscript. The authors thank Drs. Konstantin Maslov, Bin Rao, and Christopher Favazza for helpful discussion. This work is sponsored in part by National Institutes of Health Grants R01 EB000712, R01 NS46214 (Bioengineering Research Partnerships), R01 EB008085, and U54 CA136398 (Network for Translational Research). L.V.W. has a financial interest in Microphotoacoustics, Inc., and Endra, Inc., which, however, did not support this work. ReferencesJ. K.-J. Li, Dynamics of the Vascular System, World Scientific, Singapore
(2004). Google Scholar
N. G. Costouros,
F. E. Diehn, and
S. K. Libutti,
“Molecular imaging of tumor angiogenesis,”
J. Cell. Biochem., 87 72
–78
(2002). https://doi.org/10.1002/jcb.10426 0730-2312 Google Scholar
D. L. Miller,
J. W. Reinig, and
D. J. Volkman,
“Vascular imaging with MRI: inadequacy in Takayasu’s arteritis compared with angiography,”
AJR, Am. J. Roentgenol., 146
(5), 949
–954
(1986). 0361-803X Google Scholar
M. Neeman,
“Functional and molecular MR imaging of angiogenesis: seeing the target, seeing it work,”
J. Cell. Biochem., 87 11
–17
(2002). https://doi.org/10.1002/jcb.10399 0730-2312 Google Scholar
U. Hoffmann,
M. Ferencik,
R. C. Cury, and
A. J. Pena,
“Coronary CT angiography,”
J. Nucl. Med., 47
(5), 797
–806
(2006). 0161-5505 Google Scholar
J. H. Rudd,
K. S. Myers,
S. Bansilal,
J. Machac,
C. A. Pinto,
C. Tong,
A. Rafique,
R. Hargeaves,
M. Farkouh,
V. Fuster, and
Z. A. Fayad,
“Atherosclerosis inflammation imaging with 18F-FDG PET: carotid, iliac, and femoral uptake reproducibility, quantification methods, and recommendations,”
J. Nucl. Med., 49
(6), 871
–878
(2008). https://doi.org/10.2967/jnumed.107.050294 0161-5505 Google Scholar
U. Schminke,
L. Motsch,
B. Griewing,
M. Gaull, and
C. Kessler,
“Three-dimensional power-mode ultrasound for quantification of the progression of carotid artery atherosclerosis,”
J. Neurol., 247
(2), 106
–111
(2000). https://doi.org/10.1007/PL00007790 0340-5354 Google Scholar
D. M. McDonald and
P. L. Choyke,
“Imaging of angiogenesis: from microscope to clinic,”
Nat. Med., 9
(6), 713
–725
(2003). https://doi.org/10.1038/nm0603-713 1078-8956 Google Scholar
A. M. Iga,
S. Sarkar,
K. M. Sales,
M. C. Winslet, and
A. M. Seifalian,
“Quantitating therapeutic disruption of tumor blood flow with intravital video microscopy,”
Cancer Res., 66
(24), 11517
–11519
(2006). https://doi.org/10.1158/0008-5472.CAN-06-1743 0008-5472 Google Scholar
E. Laemmel,
M. Genet,
G. Le Goualher,
A. Perchant,
J. F. Le Gargasson, and
E. Vicaut,
“Fibered confocal fluorescence microscopy (Cell-viZio) facilitates extended imaging in the field of microcirculation. A comparison with intravital microscopy,”
J. Vasc. Res., 41
(5), 400
–411
(2004). https://doi.org/10.1159/000081209 1018-1172 Google Scholar
D. Kleinfeld,
P. P. Mitra,
F. Helmchen, and
W. Denk,
“Fluctuations and stimulus-induced changes in blood flow observed in individual capillaries in layers 2 through 4 of rat neocortex,”
15741
–15746
(1998). Google Scholar
M. C. Pierce,
D. J. Javier, and
R. Richards-Kortum,
“Optical contrast agents and imaging systems for detection and diagnosis of cancer,”
Int. J. Cancer, 123
(9), 1979
–1990
(2008). https://doi.org/10.1002/ijc.23858 0020-7136 Google Scholar
W. Groner,
J. W. Winkelman,
A. G. Harris,
C. Ince,
G. J. Bouma,
K. Messmer, and
R. G. Nadeau,
“Orthogonal polarization spectral imaging: a new method for study of the microcirculation,”
Nat. Med., 5
(10), 1209
–1212
(1999). https://doi.org/10.1038/13529 1078-8956 Google Scholar
A. Bauer,
S. Kofler,
M. Thiel,
S. Eifert, and
F. Christ,
“Monitoring of the sublingual microcirculation in cardiac surgery using orthogonal polarization spectral imaging: preliminary results,”
Anesthesiology, 107
(6), 939
–945
(2007). https://doi.org/10.1097/01.anes.0000291442.69337.c9 0003-3022 Google Scholar
R. K. Wang,
S. L. Jacques,
Z. Ma,
S. Hurst,
S. R. Hanson, and
A. Gruber,
“Three dimensional optical angiography,”
Opt. Express, 15
(7), 4083
–4097
(2007). https://doi.org/10.1364/OE.15.004083 1094-4087 Google Scholar
I. P. Torres Filho,
J. Terner,
R. N. Pittman,
L. G. Somera 3rd, K. R. Ward,
“Hemoglobin oxygen saturation measurements using resonance Raman intravital microscopy,”
Am. J. Physiol. Heart Circ. Physiol., 289
(1), H488
–495
(2005). https://doi.org/10.1152/ajpheart.01171.2004 0363-6135 Google Scholar
M. C. Skala,
A. Fontanella,
H. Hendargo,
M. W. Dewhirst, and
J. A. Izatt,
“Combined hyperspectral and spectral domain optical coherence tomography microscope for noninvasive hemodynamic imaging,”
Opt. Lett., 34
(3), 289
–291
(2009). https://doi.org/10.1364/OL.34.000289 0146-9592 Google Scholar
D. Fu,
T. Ye,
T. E. Matthews,
B. J. Chen,
G. Yurtserver, and
W. S. Warren,
“High-resolution in vivo imaging of blood vessels without labeling,”
Opt. Lett., 32
(18), 2641
–2643
(2007). https://doi.org/10.1364/OL.32.002641 0146-9592 Google Scholar
D. Fu,
T. E. Matthews,
T. Ye,
I. R. Piletic, and
W. S. Warren,
“Label-free in vivo optical imaging of microvasculature and oxygenation level,”
J. Biomed. Opt., 13
(4), 040503
(2008). https://doi.org/10.1117/1.2968260 1083-3668 Google Scholar
A. G. Bell,
“On the production and reproduction of sound by light,”
Am. J. Sci., 20 305
–324
(1880). 0002-9599 Google Scholar
L. V. Wang,
“Tutorial on photoacoustic microscopy and computed tomography,”
IEEE J. Sel. Top. Quantum Electron., 14
(1), 171
–179
(2008). https://doi.org/10.1109/JSTQE.2007.913398 1077-260X Google Scholar
L. V. Wang,
“Prospects of photoacoustic tomography,”
Med. Phys., 35
(12), 5758
–5767
(2008). https://doi.org/10.1118/1.3013698 0094-2405 Google Scholar
X. Wang,
Y. Pang,
G. Ku,
X. Xie,
G. Stoica, and
L. V. Wang,
“Noninvasive laser-induced photoacoustic tomography for structural and functional in vivo imaging of the brain,”
Nat. Biotechnol., 21
(7), 803
–806
(2003). https://doi.org/10.1038/nbt839 1087-0156 Google Scholar
H. F. Zhang,
K. Maslov,
G. Stoica, and
L. V. Wang,
“Functional photoacoustic microscopy for high-resolution and noninvasive in vivo imaging,”
Nat. Biotechnol., 24
(7), 848
–851
(2006). https://doi.org/10.1038/nbt1220 1087-0156 Google Scholar
K. Maslov,
H. F. Zhang,
S. Hu, and
L. V. Wang,
“Optical-resolution photoacoustic microscopy for in vivo imaging of single capillaries,”
Opt. Lett., 33
(9), 929
–931
(2008). https://doi.org/10.1364/OL.33.000929 0146-9592 Google Scholar
H.-P. Brecht,
R. Su,
M. Fronheiser,
S. A. Ermilov,
A. Conjusteau,
A. Liopo,
M. Motamedi, and
A. A. Oraevsky,
“Optoacoustic 3D whole-body tomography: experiments in nude mice,”
Proc. SPIE, 7177 71770E
(2009). https://doi.org/10.1117/12.812319 0277-786X Google Scholar
X. Wang,
X. Xie,
G. Ku,
L. V. Wang, and
G. Stoica,
“Noninvasive imaging of hemoglobin concentration and oxygenation in the rat brain using high-resolution photoacoustic tomography,”
J. Biomed. Opt., 11
(2), 024015
(2006). https://doi.org/10.1117/1.2192804 1083-3668 Google Scholar
H. F. Zhang,
K. Maslov,
M. Sivaramakrishnan,
G. Stoica, and
L. V. Wang,
“Imaging of hemoglobin oxygen saturation variations in single vessels in vivo using photoacoustic microscopy,”
Appl. Phys. Lett., 90
(5), 053901
(2007). https://doi.org/10.1063/1.2435697 0003-6951 Google Scholar
S. K. Patch and
O. Scherzer,
“Photo- and thermo-acoustic imaging,”
Inverse Probl., 23
(6), S1
–S10
(2007). https://doi.org/10.1088/0266-5611/23/6/S01 0266-5611 Google Scholar
L. V. Wang,
“Multiscale photoacoustic microscopy and computed tomography,”
Nature Photon., 3 503
–509
(2009). https://doi.org/10.1038/nphoton.2009.157 1749-4885 Google Scholar
M. Xu and
L. V. Wang,
“Photoacoustic imaging in biomedicine,”
Rev. Sci. Instrum., 77
(4), 041101
(2006). https://doi.org/10.1063/1.2195024 0034-6748 Google Scholar
S. Hu,
K. Maslov,
V. Tsytsarev, and
L. V. Wang,
“Functional transcranial brain imaging by optical-resolution photoacoustic microscopy,”
J. Biomed. Opt., 14
(4), 040503
(2009). https://doi.org/10.1117/1.3194136 1083-3668 Google Scholar
S. Hu,
K. Maslov, and
L. V. Wang,
“In vivo functional chronic imaging of a small animal model using optical-resolution photoacoustic microscopy,”
Med. Phys., 36
(6), 2320
–2323
(2009). https://doi.org/10.1118/1.3137572 0094-2405 Google Scholar
S. Hu,
K. Maslov, and
L. V. Wang,
“Noninvasive label-free imaging of microhemodynamics by optical-resolution photoacoustic microscopy,”
Opt. Express, 17
(9), 7688
–7693
(2009). https://doi.org/10.1364/OE.17.007688 1094-4087 Google Scholar
Z. Xie,
S. Jiao,
H. F. Zhang, and
C. A. Puliafito,
“Laser-scanning optical-resolution photoacoustic microscopy,”
Opt. Lett., 34
(12), 1771
–1773
(2009). https://doi.org/10.1364/OL.34.001771 0146-9592 Google Scholar
F. Kong,
Y. C. Chen,
H. O. Lloyd,
R. H. Silverman,
H. H. Kim,
J. M. Cannata, and
K. K. Shung,
“High-resolution photoacoustic imaging with focused laser and ultrasonic beams,”
Appl. Phys. Lett., 94
(3), 033902
(2009). https://doi.org/10.1063/1.3073749 0003-6951 Google Scholar
K. Maslov,
G. Stoica, and
L. V. Wang,
“In vivo dark-field reflection-mode photoacoustic microscopy,”
Opt. Lett., 30
(6), 625
–627
(2005). https://doi.org/10.1364/OL.30.000625 0146-9592 Google Scholar
K. H. Song and
L. V. Wang,
“Deep reflection-mode photoacoustic imaging of biological tissue,”
J. Biomed. Opt., 12
(6), 060503
(2007). https://doi.org/10.1117/1.2818045 1083-3668 Google Scholar
K. H. Song and
L. V. Wang,
“Noninvasive photoacoustic imaging of the thoracic cavity and the kidney in small and large animals,”
Med. Phys., 35
(10), 4524
–4529
(2008). https://doi.org/10.1118/1.2977534 0094-2405 Google Scholar
X. Wang,
Y. Xu,
M. Xu,
S. Yokoo,
E. S. Fry, and
L. V. Wang,
“Photoacoustic tomography of biological tissues with high cross-section resolution: reconstruction and experiment,”
Med. Phys., 29
(12), 2799
–2805
(2002). https://doi.org/10.1118/1.1521720 0094-2405 Google Scholar
K. H. Song,
G. Stoica, and
L. V. Wang,
“In vivo three-dimensional photoacoustic tomography of a whole mouse head,”
Opt. Lett., 31
(16), 2453
–2455
(2006). https://doi.org/10.1364/OL.31.002453 0146-9592 Google Scholar
X. Wang,
Y. Pang,
G. Ku,
G. Stoica, and
L. V. Wang,
“Three-dimensional laser-induced photoacoustic tomography of mouse brain with the skin and skull intact,”
Opt. Lett., 28
(19), 1739
–1741
(2003). https://doi.org/10.1364/OL.28.001739 0146-9592 Google Scholar
R. J. Zemp,
R. Bitton,
M. L. Li,
K. K. Shung,
G. Stoica, and
L. V. Wang,
“Photoacoustic imaging of the microvasculature with a high-frequency ultrasound array transducer,”
J. Biomed. Opt., 12
(1), 010501
(2007). https://doi.org/10.1117/1.2709850 1083-3668 Google Scholar
R. J. Zemp,
L. Song,
R. Bitton,
K. K. Shung, and
L. V. Wang,
“Realtime photoacoustic microscopy in vivo with a ultrasound array transducer,”
Opt. Express, 16
(11), 7915
–7928
(2008). https://doi.org/10.1364/OE.16.007915 1094-4087 Google Scholar
R. J. Zemp,
L. Song,
R. Bitton,
K. K. Shung, and
L. V. Wang,
“Realtime photoacoustic microscopy of murine cardiovascular dynamics,”
Opt. Express, 16
(22), 18551
–18556
(2008). https://doi.org/10.1364/OE.16.018551 1094-4087 Google Scholar
L. Song,
K. Maslov,
R. Bitton,
K. K. Shung, and
L. V. Wang,
“Fast 3-D dark-field reflection-mode photoacoustic microscopy in vivo with a ultrasound linear array,”
J. Biomed. Opt., 13
(5), 054028
(2008). https://doi.org/10.1117/1.2976141 1083-3668 Google Scholar
R. G. Kolkman,
P. J. Brands,
W. Steenbergen, and
T. G. van Leeuwen,
“Real-time in vivo photoacoustic and ultrasound imaging,”
J. Biomed. Opt., 13
(5), 050510
(2008). https://doi.org/10.1117/1.3005421 1083-3668 Google Scholar
J. Gamelin,
A. Aguirre,
A. Maurudis,
F. Huang,
D. Castillo,
L. V. Wang, and
Q. Zhu,
“Curved array photoacoustic tomographic system for small animal imaging,”
J. Biomed. Opt., 13
(2), 024007
(2008). https://doi.org/10.1117/1.2907157 1083-3668 Google Scholar
X. Yang and
L. V. Wang,
“Three-dimensional photoacoustic tomography of small animal brain with a curved array transducer,”
Proc. SPIE, 7177 71770K
(2009). 0277-786X Google Scholar
J. Gamelin,
A. Maurudis,
A. Aguirre,
F. Huang,
P. Guo,
L. V. Wang, and
Q. Zhu,
“A fast 512-element ring array photoacoustic imaging system for small animals,”
Proc. SPIE, 7177 71770B
(2009). https://doi.org/10.1117/12.812406 0277-786X Google Scholar
B. Yin,
D. Xing,
Y. Wang,
Y. Zeng,
Y. Tan, and
Q. Chen,
“Fast photoacoustic imaging system based on 320-element linear transducer array,”
Phys. Med. Biol., 49
(7), 1339
–1346
(2004). https://doi.org/10.1088/0031-9155/49/7/019 0031-9155 Google Scholar
V. Kozhushko,
T. Khokhlova,
A. Zharinov,
I. Pelivanov,
V. Solomatin, and
A. Karabutov,
“Focused array transducer for two-dimensional optoacoustic tomography,”
J. Acoust. Soc. Am., 116
(3), 1498
–1506
(2004). https://doi.org/10.1121/1.1781710 0001-4966 Google Scholar
R. A. Kruger,
W. L. Kiser Jr., D. R. Reinecke, and
G. A. Kruger,
“Thermoacoustic computed tomography using a conventional linear transducer array,”
Med. Phys., 30
(5), 856
–860
(2003). https://doi.org/10.1118/1.1565340 0094-2405 Google Scholar
R. A. Kruger,
W. L. Kiser,
D. R. Reinecke,
G. A. Kruger, and
K. D. Miller,
“Thermoacoustic molecular imaging of small animals,”
Mol. Imaging, 2
(2), 113
–123
(2003). https://doi.org/10.1162/153535003322331993 1535-3508 Google Scholar
A. D. Yablon,
N. S. Nishioka,
B. B. Mikic, and
V. Venugopalan,
“Measurement of tissue absorption coefficients by use of interferometric photothermal spectroscopy,”
Appl. Opt., 38
(7), 1259
–1272
(1999). https://doi.org/10.1364/AO.38.001259 0003-6935 Google Scholar
E. Zhang,
J. Laufer, and
P. Beard,
“Backward-mode multiwavelength photoacoustic scanner using a planar Fabry-Perot polymer film ultrasound sensor for high-resolution three-dimensional imaging of biological tissues,”
Appl. Opt., 47
(4), 561
–577
(2008). https://doi.org/10.1364/AO.47.000561 0003-6935 Google Scholar
S. A. Carp and
V. Venugopalan,
“Optoacoustic imaging based on the interferometric measurement of surface displacement,”
J. Biomed. Opt., 12
(6), 064001
(2007). https://doi.org/10.1117/1.2812665 1083-3668 Google Scholar
B. P. Payne,
V. Venugopalan,
B. B. Mikic, and
N. S. Nishioka,
“Optoacoustic tomography using time-resolved interferometric detection of surface displacement,”
J. Biomed. Opt., 8
(2), 273
–280
(2003). https://doi.org/10.1117/1.1559727 1083-3668 Google Scholar
B. P. Payne,
V. Venugopalan,
B. B. Mikic, and
N. S. Nishioka,
“Optoacoustic determination of optical attenuation depth using interferometric detection,”
J. Biomed. Opt., 8
(2), 264
–272
(2003). https://doi.org/10.1117/1.1559731 1083-3668 Google Scholar
E. Z. Zhang,
J. G. Laufer,
R. B. Pedley, and
P. C. Beard,
“In vivo high-resolution 3D photoacoustic imaging of superficial vascular anatomy,”
Phys. Med. Biol., 54
(4), 1035
–1046
(2009). https://doi.org/10.1088/0031-9155/54/4/014 0031-9155 Google Scholar
J. A. Viator,
G. Paltauf,
S. L. Jacques, and
S. A. Prahl,
“Design and testing of an endoscopic photoacoustic probe for determination of treatment depth after photodynamic therapy,”
Proc. SPIE, 4256 16
–27
(2001). https://doi.org/10.1117/12.429311 0277-786X Google Scholar
J.-M. Yang,
K. Maslov,
H.-C. Yang,
Q. F. Zhou, and
L. V. Wang,
“Endoscopic photoacoustic microscopy,”
Proc. SPIE, 7177 71770N
(2009). 0277-786X Google Scholar
J.-M. Yang,
K. Maslov,
H.-C. Yang,
Q. F. Zhou,
K. K. Shung, and
L. V. Wang,
“Photoacoustic endoscopy,”
Opt. Lett., 34
(10), 1591
–1593
(2009). https://doi.org/10.1364/OL.34.001591 0146-9592 Google Scholar
S. Sethuraman,
S. R. Aglyamov,
J. H. Amirian,
R. W. Smalling, and
S. Y. Emelianov,
“Intravascular photoacoustic imaging using an IVUS imaging catheter,”
IEEE Trans. Ultrason. Ferroelectr. Freq. Control, 54
(5), 978
–986
(2007). https://doi.org/10.1109/TUFFC.2007.343 0885-3010 Google Scholar
S. Sethuraman,
J. H. Amirian,
S. H. Litovsky,
R. W. Smalling, and
S. Y. Emelianov,
“Spectroscopic intravascular photoacoustic imaging to differentiate atherosclerotic plaques,”
Opt. Express, 16
(5), 3362
–3367
(2008). https://doi.org/10.1364/OE.16.003362 1094-4087 Google Scholar
B. Wang,
E. Yantsen,
T. Larson,
A. B. Karpiouk,
S. Sethuraman,
J. L. Su,
K. Sokolov, and
S. Y. Emelianov,
“Plasmonic intravascular photoacoustic imaging for detection of macrophages in atherosclerotic plaques,”
Nano Lett., 9
(6), 2212
–2217
(2009). https://doi.org/10.1021/nl801852e 1530-6984 Google Scholar
G. Ku and
L. V. Wang,
“Deeply penetrating photoacoustic tomography in biological tissues enhanced with an optical contrast agent,”
Opt. Lett., 30
(5), 507
–509
(2005). https://doi.org/10.1364/OL.30.000507 0146-9592 Google Scholar
R. G. M. Kolkman,
E. Hondebrink,
W. Steenbergen, and
F. F. M. de Mul,
“In vivo photoacoustic imaging of blood vessels using an extreme-narrow aperture sensor,”
IEEE J. Sel. Top. Quantum Electron., 9
(2), 343
–346
(2003). https://doi.org/10.1109/JSTQE.2003.813302 1077-260X Google Scholar
R. G. M. Kolkman,
E. Hondebrink,
W. Steenbergen,
T. G. van Leeuwen, and
F. F. M. de Mul,
“Photoacoustic imaging of blood vessels with a double-ring sensor featuring a narrow angular aperture,”
J. Biomed. Opt., 9
(6), 1327
–1335
(2004). https://doi.org/10.1117/1.1805556 1083-3668 Google Scholar
J. J. Niederhauser,
D. Frauchiger,
H. P. Weber, and
M. Frenz,
“Real-time optoacoustic imaging using a Schlieren transducer,”
Appl. Phys. Lett., 81
(4), 571
–573
(2002). https://doi.org/10.1063/1.1495539 0003-6951 Google Scholar
J. J. Niederhauser,
M. Jaeger, and
M. Frenz,
“Real-time three-dimensional optoacoustic imaging using an acoustic lens system,”
Appl. Phys. Lett., 85
(5), 846
–848
(2004). https://doi.org/10.1063/1.1777820 0003-6951 Google Scholar
K. Maslov,
H. F. Zhang,
S. Hu, and
L. V. Wang,
“Optical-resolution confocal photoacoustic microscopy,”
Proc. SPIE, 6856 68561I
(2008). https://doi.org/10.1117/12.763889 0277-786X Google Scholar
L. V. Wang and
H. Wu, Biomedical Optics: Principles and Imaging, Wiley, Hoboken, NJ
(2007). Google Scholar
H. F. Zhang,
K. Maslov,
M. L. Li,
G. Stoica, and
L. H. V. Wang,
“In vivo volumetric imaging of subcutaneous microvasculature by photoacoustic microscopy,”
Opt. Express, 14
(20), 9317
–9323
(2006). https://doi.org/10.1364/OE.14.009317 1094-4087 Google Scholar
H. F. Zhang,
K. Maslov, and
L. V. Wang,
“In vivo imaging of subcutaneous structures using functional photoacoustic microscopy,”
Nat. Protoc., 2
(4), 797
–804
(2007). https://doi.org/10.1038/nprot.2007.108 1750-2799 Google Scholar
H. F. Zhang,
K. Maslov, and
L. V. Wang,
“Automatic algorithm for skin profile detection in photoacoustic microscopy,”
J. Biomed. Opt., 14
(2), 024050
(2009). https://doi.org/10.1117/1.3122362 1083-3668 Google Scholar
M. L. Li,
H. E. Zhang,
K. Maslov,
G. Stoica, and
L. V. Wang,
“Improved in vivo photoacoustic microscopy based on a virtual-detector concept,”
Opt. Lett., 31
(4), 474
–476
(2006). https://doi.org/10.1364/OL.31.000474 0146-9592 Google Scholar
G. Paltauf,
H. SchmidtKloiber, and
H. Guss,
“Light distribution measurements in absorbing materials by optical detection of laser-induced stress waves,”
Appl. Phys. Lett., 69
(11), 1526
–1528
(1996). https://doi.org/10.1063/1.117993 0003-6951 Google Scholar
K. P. Kostli,
M. Frenz,
H. P. Weber,
G. Paltauf, and
H. Schmidt-Kloiber,
“Optoacoustic tomography: time-gated measurement of pressure distributions and image reconstruction,”
Appl. Opt., 40
(22), 3800
–3809
(2001). https://doi.org/10.1364/AO.40.003800 0003-6935 Google Scholar
H. L. Fu,
Y. Leng,
M. J. Cobb,
K. Hsu,
J. H. Hwang, and
X. Li,
“Flexible miniature compound lens design for high-resolution optical coherence tomography balloon imaging catheter,”
J. Biomed. Opt., 13
(6), 060502
(2008). https://doi.org/10.1117/1.3037340 1083-3668 Google Scholar
R. G. Kolkman,
J. H. Klaessens,
E. Hondebrink,
J. C. Hopman,
F. F. de Mul,
W. Steenbergen,
J. M. Thijssen, and
T. G. van Leeuwen,
“Photoacoustic determination of blood vessel diameter,”
Phys. Med. Biol., 49
(20), 4745
–4756
(2004). https://doi.org/10.1088/0031-9155/49/20/006 0031-9155 Google Scholar
M. C. Pilatou,
N. J. Voogd,
F. F. M. de Mul,
W. Steenbergen, and
L. N. A. van Adrichem,
“Analysis of three-dimensional photoacoustic imaging of a vascular tree in vitro,”
Rev. Sci. Instrum., 74
(10), 4495
–4499
(2003). https://doi.org/10.1063/1.1605491 0034-6748 Google Scholar
D. Malonek and
A. Grinvald,
“Interactions between electrical activity and cortical microcirculation revealed by imaging spectroscopy: implications for functional brain mapping,”
Science, 272
(5261), 551
–554
(1996). https://doi.org/10.1126/science.272.5261.551 0036-8075 Google Scholar
J. P. Culver,
T. Durduran,
D. Furuya,
C. Cheung,
J. H. Greenberg, and
A. G. Yodh,
“Diffuse optical tomography of cerebral blood flow, oxygenation, and metabolism in rat during focal ischemia,”
J. Cereb. Blood Flow Metab., 23
(8), 911
–924
(2003). https://doi.org/10.1097/01.WCB.0000076703.71231.BB 0271-678X Google Scholar
M. L. Li,
J. T. Oh,
X. Y. Xie,
G. Ku,
W. Wang,
C. Li,
G. Lungu,
G. Stoica, and
L. V. Wang,
“Simultaneous molecular and hypoxia imaging of brain tumors in vivo using spectroscopic photoacoustic tomography,”
Proc. IEEE, 96
(3), 481
–489
(2008). https://doi.org/10.1109/JPROC.2007.913515 0018-9219 Google Scholar
W. G. Zijlstra,
A. Buursma, and
O. W. van Assendelft, Visible and Near Infrared Absorption Spectra of Human and Animal Hemoglobin, Determination and Application, VSP, BV, AH Zeist, Amsterdam, The Netherlands
(2000). Google Scholar
J. Laufer,
C. Elwell,
D. Delpy, and
P. Beard,
“In vitro measurements of absolute blood oxygen saturation using pulsed near-infrared photoacoustic spectroscopy: accuracy and resolution,”
Phys. Med. Biol., 50
(18), 4409
–4428
(2005). https://doi.org/10.1088/0031-9155/50/18/011 0031-9155 Google Scholar
J. Laufer,
D. Delpy,
C. Elwell, and
P. Beard,
“Quantitative spatially resolved measurement of tissue chromophore concentrations using photoacoustic spectroscopy: application to the measurement of blood oxygenation and haemoglobin concentration,”
Phys. Med. Biol., 52
(1), 141
–168
(2007). https://doi.org/10.1088/0031-9155/52/1/010 0031-9155 Google Scholar
K. Maslov,
H. F. Zhang, and
L. V. Wang,
“Effects of wavelength-dependent fluence attenuation on the noninvasive photoacoustic imaging of hemoglobin oxygen saturation in subcutaneous vasculature in vivo,”
Inverse Probl., 23
(6), S113
–S122
(2007). https://doi.org/10.1088/0266-5611/23/6/S09 0266-5611 Google Scholar
J. R. Rajian,
P. L. Carson, and
X. Wang,
“Quantitative photoacoustic measurement of tissue optical absorption spectrum aided by an optical contrast agent,”
Opt. Express, 17
(6), 4879
–4889
(2009). https://doi.org/10.1364/OE.17.004879 1094-4087 Google Scholar
Z. P. Chen,
T. E. Milner,
S. Srinivas,
X. J. Wang,
A. Malekafzali,
M. J. C. vanGemert, and
J. S. Nelson,
“Noninvasive imaging of in vivo blood flow velocity using optical Doppler tomography,”
Opt. Lett., 22
(14), 1119
–1121
(1997). https://doi.org/10.1364/OL.22.001119 0146-9592 Google Scholar
R. A. Leitgeb,
L. Schmetterer,
W. Drexler,
A. F. Fercher,
R. J. Zawadzki, and
T. Bajraszewski,
“Real-time assessment of retinal blood flow with ultrafast acquisition by color Doppler Fourier domain optical coherence tomography,”
Opt. Express, 11
(23), 3116
–3121
(2003). 1094-4087 Google Scholar
B. R. White,
M. C. Pierce,
N. Nassif,
B. Cense,
B. H. Park,
G. J. Tearney,
B. E. Bouma,
T. C. Chen, and
J. F. de Boer,
“In vivo dynamic human retinal blood flow imaging using ultra-high-speed spectral domain optical Doppler tomography,”
Opt. Express, 11
(25), 3490
–3497
(2003). 1094-4087 Google Scholar
R. K. Wang,
“Three-dimensional optical micro-angiography maps directional blood perfusion deep within microcirculation tissue beds in vivo,”
Phys. Med. Biol., 52
(23), N531
–537
(2007). https://doi.org/10.1088/0031-9155/52/23/N01 0031-9155 Google Scholar
A. H. Bachmann,
M. L. Villiger,
C. Blatter,
T. Lasser, and
R. A. Leitgeb,
“Resonant Doppler flow imaging and optical vivisection of retinal blood vessels,”
Opt. Express, 15
(2), 408
–422
(2007). https://doi.org/10.1364/OE.15.000408 1094-4087 Google Scholar
H. Fang,
K. Maslov, and
L. V. Wang,
“Photoacoustic Doppler effect from flowing small light-absorbing particles,”
Phys. Rev. Lett., 99
(18), 184501
(2007). https://doi.org/10.1103/PhysRevLett.99.184501 0031-9007 Google Scholar
H. Fang,
K. Maslov, and
L. V. Wang,
“Photoacoustic Doppler flow measurement in optically scattering media,”
Appl. Phys. Lett., 91
(26), 264103
(2007). https://doi.org/10.1063/1.2825569 0003-6951 Google Scholar
K. Maslov and
L. V. Wang,
“Photoacoustic imaging of biological tissue with intensity-modulated continuous-wave laser,”
J. Biomed. Opt., 13
(2), 024006
(2008). https://doi.org/10.1117/1.2904965 1083-3668 Google Scholar
D. R. Larson,
W. R. Zipfel,
R. M. Williams,
S. W. Clark,
M. P. Bruchez,
F. W. Wise, and
W. W. Webb,
“Water-soluble quantum dots for multiphoton fluorescence imaging in vivo,”
Science, 300
(5624), 1434
–1436
(2003). https://doi.org/10.1126/science.1083780 0036-8075 Google Scholar
S. J. Tang,
M. L. Gordon,
V. X. Yang,
M. E. Faughnan,
M. Cirocco,
B. Qi,
E. S. Yue,
G. Gardiner,
G. B. Haber,
G. Kandel,
P. Kortan,
A. Vitkin,
B. C. Wilson, and
N. E. Marcon,
“In vivo Doppler optical coherence tomography of mucocutaneous telangiectases in hereditary hemorrhagic telangiectasia,”
Gastrointest. Endosc., 58
(4), 591
–598
(2003). https://doi.org/10.1067/S0016-5107(03)01978-3 0016-5107 Google Scholar
H. Fang and
L. V. Wang,
“M-mode photoacoustic particle flow imaging,”
Opt. Lett., 34
(5), 671
–673
(2009). https://doi.org/10.1364/OL.34.000671 0146-9592 Google Scholar
V. P. Zharov,
E. I. Galanzha,
E. V. Shashkov,
N. G. Khlebtsov, and
V. V. Tuchin,
“In vivo photoacoustic flow cytometry for monitoring of circulating single cancer cells and contrast agents,”
Opt. Lett., 31
(24), 3623
–3625
(2006). https://doi.org/10.1364/OL.31.003623 0146-9592 Google Scholar
V. P. Zharov,
E. I. Galanzha,
E. V. Shashkov,
J. W. Kim,
N. G. Khlebtsov, and
V. V. Tuchin,
“Photoacoustic flow cytometry: principle and application for real-time detection of circulating single nanoparticles, pathogens, and contrast dyes in vivo,”
J. Biomed. Opt., 12
(5), 051503
(2007). https://doi.org/10.1117/1.2793746 1083-3668 Google Scholar
E. V. Shashkov,
M. Everts,
E. I. Galanzha, and
V. P. Zharov,
“Quantum dots as multimodal photoacoustic and photothermal contrast agents,”
Nano Lett., 8
(11), 3953
–3958
(2008). https://doi.org/10.1021/nl802442x 1530-6984 Google Scholar
E. I. Galanzha,
E. V. Shashkov,
V. V. Tuchin, and
V. P. Zharov,
“In vivo multispectral, multiparameter, photoacoustic lymph flow cytometry with natural cell focusing, label-free detection and multicolor nanoparticle probes,”
Cytometry, 73
(10), 884
–894
(2008). https://doi.org/10.1002/cyto.a.20587 0196-4763 Google Scholar
P. C. Li,
S. W. Huang,
C. W. Wei,
Y. C. Chiou,
C. D. Chen, and
C. R. Wang,
“Photoacoustic flow measurements by use of laser-induced shape transitions of gold nanorods,”
Opt. Lett., 30
(24), 3341
–3343
(2005). https://doi.org/10.1364/OL.30.003341 0146-9592 Google Scholar
C. W. Wei,
S. W. Huang,
C. R. Wang, and
P. C. Li,
“Photoacoustic flow measurements based on wash-in analysis of gold nanorods,”
IEEE Trans. Ultrason. Ferroelectr. Freq. Control, 54
(6), 1131
–1141
(2007). https://doi.org/10.1109/TUFFC.2007.367 0885-3010 Google Scholar
M. Yamazaki,
S. Sato,
D. Saitoh,
Y. Okada,
H. Ashida, and
M. Obara,
“Photoacoustic monitoring of neovascularities in grafted skin,”
Lasers Surg. Med., 38
(3), 235
–239
(2006). https://doi.org/10.1002/lsm.20272 0196-8092 Google Scholar
H. Nilsson and
C. Aalkjaer,
“Vasomotion: mechanisms and physiological importance,”
Mol. Interv., 3
(2), 79
–89
(2003). https://doi.org/10.1124/mi.3.2.79 Google Scholar
C. Aalkaer and
H. Nilsson,
“Vasomotion: cellular background for the oscillator and for the synchronization of smooth muscle cells,”
Br. J. Pharmacol., 144
(5), 605
–616
(2005). https://doi.org/10.1038/sj.bjp.0706084 0007-1188 Google Scholar
S. Bertuglia,
A. Colantuoni,
G. Coppini, and
M. Intaglietta,
“Hypoxia- or hyperoxia-induced changes in arteriolar vasomotion in skeletal muscle microcirculation,”
Am. J. Physiol. Heart Circ. Physiol., 260 H362
–H372
(1991). 0363-6135 Google Scholar
K. Lorentz,
A. Zayas-Santiago,
S. Tummala, and
J. J. Derwent,
“Scanning laser ophthalmoscope-particle tracking method to assess blood velocity during hypoxia and hyperoxia,”
Adv. Exp. Med. Biol., 614 253
–261
(2008). https://doi.org/10.1007/978-0-387-74911-2_29 0065-2598 Google Scholar
E. W. Stein,
K. Maslov, and
L. V. Wang,
“Noninvasive, in vivo imaging of blood-oxygenation dynamics within the mouse brain using photoacoustic microscopy,”
J. Biomed. Opt., 14
(2), 020502
(2009). https://doi.org/10.1117/1.3095799 1083-3668 Google Scholar
M. C. Pilatou,
R. I. Siphanto,
L. N. A. van Adrichem, and
F. F. M. de Mul,
“Photoacoustic monitoring of changes in the blood circulation,”
Rev. Sci. Instrum., 74
(1), 384
–386
(2003). https://doi.org/10.1063/1.1517185 0034-6748 Google Scholar
A. Landa,
J. J. Alvarado-Gil,
G. Gutierrez-Juarez, and
M. Vargas-Luna,
“Photoacoustic monitoring of real time blood and hemolymph sedimentation,”
Rev. Sci. Instrum., 74
(1), 377
–379
(2003). https://doi.org/10.1063/1.1512982 0034-6748 Google Scholar
L. Xiang,
D. Xing,
H. Gu,
D. Yang,
S. Yang,
L. Zeng, and
W. R. Chen,
“Real-time optoacoustic monitoring of vascular damage during photodynamic therapy treatment of tumor,”
J. Biomed. Opt., 12
(1), 014001
(2007). https://doi.org/10.1117/1.2437752 1083-3668 Google Scholar
R. I. Siphanto,
K. K. Thumma,
R. G. M. Kolkman,
T. G. van Leeuwen,
F. F. M. de Mul,
J. W. van Neck,
L. N. A. van Adrichem, and
W. Steenbergen,
“Serial noninvasive photoacoustic imaging of neovascularization in tumor angiogenesis,”
Opt. Express, 13
(1), 89
–95
(2005). https://doi.org/10.1364/OPEX.13.000089 1094-4087 Google Scholar
Y. Lao,
D. Xing,
S. Yang, and
L. Xiang,
“Noninvasive photoacoustic imaging of the developing vasculature during early tumor growth,”
Phys. Med. Biol., 53
(15), 4203
–4212
(2008). https://doi.org/10.1088/0031-9155/53/15/013 0031-9155 Google Scholar
A. F. Falabella and
R. S. Kirsner, Wound Healing, Talyor & Francis, Boca Raton, FL
(2005). Google Scholar
G. N. Naumov,
J. Folkman,
O. Straume, and
L. A. Akslen,
“Tumor-vascular interactions and tumor dormancy,”
APMIS, 116
(7–8), 569
–585
(2008). https://doi.org/10.1111/j.1600-0463.2008.01213.x 0903-4641 Google Scholar
J. A. Viator,
G. Au,
G. Paltauf,
S. L. Jacques,
S. A. Prahl,
H. Ren,
Z. Chen, and
J. S. Nelson,
“Clinical testing of a photoacoustic probe for port wine stain depth determination,”
Lasers Surg. Med., 30
(2), 141
–148
(2002). https://doi.org/10.1002/lsm.10015 0196-8092 Google Scholar
J. A. Viator,
B. Choi,
M. Ambrose,
J. Spanier, and
J. S. Nelson,
“In vivo port-wine stain depth determination with a photoacoustic probe,”
Appl. Opt., 42
(16), 3215
–3224
(2003). https://doi.org/10.1364/AO.42.003215 0003-6935 Google Scholar
R. G. Kolkman,
M. J. Mulder,
C. P. Glade,
W. Steenbergen, and
T. G. van Leeuwen,
“Photoacoustic imaging of port-wine stains,”
Lasers Surg. Med., 40
(3), 178
–182
(2008). https://doi.org/10.1002/lsm.20612 0196-8092 Google Scholar
R. O. Esenaliev,
Y. Y. Petrov,
O. Hartrumpf,
D. J. Deyo, and
D. S. Prough,
“Continuous, noninvasive monitoring of total hemoglobin concentration by an optoacoustic technique,”
Appl. Opt., 43
(17), 3401
–3407
(2004). https://doi.org/10.1364/AO.43.003401 0003-6935 Google Scholar
I. Y. Petrova,
R. O. Esenaliev,
Y. Y. Petrov,
H. P. Brecht,
C. H. Svensen,
J. Olsson,
D. J. Deyo, and
D. S. Prough,
“Optoacoustic monitoring of blood hemoglobin concentration: a pilot clinical study,”
Opt. Lett., 30
(13), 1677
–1679
(2005). https://doi.org/10.1364/OL.30.001677 0146-9592 Google Scholar
Y. Y. Petrov,
I. Y. Petrova,
I. A. Patrikeev,
R. O. Esenaliev, and
D. S. Prough,
“Multiwavelength optoacoustic system for noninvasive monitoring of cerebral venous oxygenation: a pilot clinical test in the internal jugular vein,”
Opt. Lett., 31
(12), 1827
–1829
(2006). https://doi.org/10.1364/OL.31.001827 0146-9592 Google Scholar
L. Li,
K. Maslov,
G. Ku, and
L. V. Wang,
“In-vivo imaging of microcirculation using integrated photoacoustic and optical-coherence microscopy,”
Proc. SPIE, 7177 71770I
(2009). 0277-786X Google Scholar
J. J. Niederhauser,
M. Jaeger,
R. Lemor,
P. Weber, and
M. Frenz,
“Combined ultrasound and optoacoustic system for real-time high-contrast vascular imaging in vivo,”
IEEE Trans. Med. Imaging, 24
(4), 436
–440
(2005). https://doi.org/10.1109/TMI.2004.843199 0278-0062 Google Scholar
A. B. Karpiouk,
S. R. Aglyamov,
S. Mallidi,
J. Shah,
W. G. Scott,
J. M. Rubin, and
S. Y. Emelianov,
“Combined ultrasound and photoacoustic imaging to detect and stage deep vein thrombosis: phantom and ex vivo studies,”
J. Biomed. Opt., 13
(5), 054061
(2008). https://doi.org/10.1117/1.2992175 1083-3668 Google Scholar
L. S. Bouchard,
M. S. Anwar,
G. L. Liu,
B. Hann,
Z. H. Xie,
J. W. Gray,
X. Wang,
A. Pines, and
F. F. Chen,
“Picomolar sensitivity MRI and photoacoustic imaging of cobalt nanoparticles,”
4085
–4089
(2009). Google Scholar
C. K. Liao,
M. L. Li, and
P. C. Li,
“Optoacoustic imaging with synthetic aperture focusing and coherence weighting,”
Opt. Lett., 29
(21), 2506
–2508
(2004). https://doi.org/10.1364/OL.29.002506 0146-9592 Google Scholar
X. M. Yang,
M. L. Li, and
L. H. V. Wang,
“Ring-based ultrasonic virtual point detector with applications to photoacoustic tomography,”
Appl. Phys. Lett., 90
(25), 251103
(2007). https://doi.org/10.1063/1.2749856 0003-6951 Google Scholar
X. M. Yang and
L. V. Wang,
“Photoacoustic tomography of a rat cerebral cortex with a ring-based ultrasonic virtual point detector,”
J. Biomed. Opt., 12
(6), 060507
(2007). https://doi.org/10.1117/1.2823076 1083-3668 Google Scholar
S. Park,
A. B. Karpiouk,
S. R. Aglyamov, and
S. Y. Emelianov,
“Adaptive beamforming for photoacoustic imaging,”
Opt. Lett., 33
(12), 1291
–1293
(2008). https://doi.org/10.1364/OL.33.001291 0146-9592 Google Scholar
Y. W. Wang,
X. Y. Xie,
X. D. Wang,
G. Ku,
K. L. Gill,
D. P. O’Neal,
G. Stoica, and
L. V. Wang,
“Photoacoustic tomography of a nanoshell contrast agent in the in vivo rat brain,”
Nano Lett., 4
(9), 1689
–1692
(2004). https://doi.org/10.1021/nl049126a 1530-6984 Google Scholar
X. Wang,
G. Ku,
M. A. Wegiel,
D. J. Bornhop,
G. Stoica, and
L. V. Wang,
“Noninvasive photoacoustic angiography of animal brains in vivo with near-infrared light and an optical contrast agent,”
Opt. Lett., 29
(7), 730
–732
(2004). https://doi.org/10.1364/OL.29.000730 0146-9592 Google Scholar
X. Yang,
S. E. Skrabalak,
Z. Y. Li,
Y. Xia, and
L. V. Wang,
“Photoacoustic tomography of a rat cerebral cortex in vivo with au nanocages as an optical contrast agent,”
Nano Lett., 7
(12), 3798
–3802
(2007). https://doi.org/10.1021/nl072349r 1530-6984 Google Scholar
B. T. Cox,
J. G. Laufer, and
P. C. Beard,
“The challenges for quantitative photoacoustic imaging,”
Proc. SPIE, 7177 717713
(2009). https://doi.org/10.1117/12.806788 0277-786X Google Scholar
|