
|
|
1.IntroductionIn the past decades, imaging of (patho) physiological processes in large (conduit) arteries has become increasingly important in the context of diseases such as atherosclerosis. Recently, we and others have put much effort into developing techniques to visualize vascular structure and function especially in large murine vessels. We recently published an ex vivo setup based on two-photon laser scanning microscopy (TPLSM), which enables structural and functional fluorescent imaging of intact, viable larger arteries of mice at a subcellular resolution.1 However, real-time in vivo imaging in these vessels at such a resolution has not been reported yet. Conventional intravital bright-field and fluorescence microscopy techniques are particularly suitable for imaging small blood vessels in thin transparent tissues where detection of fluorescent blood cells is possible up to a depth of . They enable among others advantages, visualization of blood cell-vessel wall interactions2, 3 and hemodynamic parameters.4 It was demonstrated that conventional intravital fluorescence microscopy also allows for detection of fluorescently labeled blood cells that interact with the vessel wall in large (atherosclerotic) arteries in mice5, 6, 7, 8 (diameter up to ). However, this technique is not suitable for imaging (subcellular) structures in the vessel wall of these large arteries. Image quality is strongly hampered by contributions from out-of-focus and scattered fluorescence, and rapidly decreases at deeper layers. This precludes the use of conventional intravital fluorescence microscopy for in vivo visualization of subcellular structures in the vessel wall of larger arteries. Confocal laser scanning microscopy offers excellent high-resolution images of vascular structures in vivo.9, 10 However, spatial resolution gradually deteriorates deeper in the sample due to out-of-focus scattered fluorescence light passing through the pinhole. Furthermore, the focal-to-nonfocal signal ratio decreases rapidly with depth, leading to poor penetration depth.11 In contrast, the spatial resolution of TPLSM is less affected by scattering. Two-photon excitation of fluorescent molecules uses a wavelength that is twice that of single photon excitation. This higher excitation wavelength is less susceptible to scattering. Furthermore, two-photon excitation occurs only in a small volume element (voxel) in the focal plane. Any light reaching the objective lens originates from the excited voxel, independent of the amount of scattering experienced by the emitted light. This results in preservation of spatial resolution in scattering tissues and optical sectioning. The combination of increased penetration depth, good optical sectioning, and subcellular resolution enables ex vivo TPLSM imaging of large arteries at high spatial resolution.1, 11, 12, 13, 14, 15 Also in vivo TPLSM has been reported in various relatively motionless tissues and structures, such as brain,16 kidney,17, 18, 19, 20, 21 microvasculature,22 skin,23, 24 and lymphatics.25 The complication of imaging of large arteries in vivo originates from cardiac and respiratory activity, which results in a repetitive but variable pattern of vessel movement. Random acquisition of images within this pattern will result in images that reflect different parts of vessel motion (between-frame motion artifacts). In this way, such images contain random parts of the vessel and are not mutually comparable. Furthermore, part of the vessel movement is captured within each image, resulting in image distortion (in-frame motion artifacts). In conventional fluorescence microscopy, image distortion can be eliminated by using flashed illumination at the right period during the cardiac and respiratory cycles. Unfortunately, TPLSM does not allow instantaneous image acquisition, since image composition is based on point-by-point scanning through the optical section. The diameter of large arteries in small rodents is about , and their distention is significantly larger than the thickness of the optical section, which is only about in TPLSM. This induces image distortion and challenges its use in imaging of large arteries in vivo.11 Some researchers have evaded this problem by temporarily stopping blood flow.26 This approach, however, severely disrupts the physiological conditions in these vessels. Moreover, it cannot be used to visualize dynamic processes such as blood cell-vessel wall interactions. In other imaging modalities, such as magnetic resonance imaging, triggered image acquisition is used to overcome these motion artifacts. In this study, we propose and test whether for applications of TPLSM in vivo, motion artifacts can be minimized by making several adaptations to the acquisition mode. one is whether acceleration of image acquisition will decrease image distortion. This can be achieved by reducing the number of pixels or the pixel dwell-times (or a combination of both). A drawback of accelerated image acquisition is a reduction of signal-to-noise ratio (SNR). Second, the acquisition of each separate image in a time sequence should start at a specific, fixed moment of the cardiac and respiration cycle. This potentially results in a series of images that all contain a similar part of the moving arterial wall, thus limiting between-frame motion artifacts. Finally, the application of specific image processing tools may improve overall image quality. Imaging was performed in surgically exposed arteries of anesthetized mice and rats, which were stained with specific fluorescent markers. As a proof of principle for the method and its applicability for testing molecular imaging agents in vivo, damage-induced exposure of the thin subendothelial collagen sheet was visualized using collagen-targeted quantum dots. 2.Materials and Methods2.1.AnimalsAll experiments were in line with institutional guidelines and approved by the local ethics committee on the use of laboratory animals. Mice (C57BL6/J; ) were anesthetized using subcutaneous administration of a mixture of ketamin (Nimatek, Eurovet, Cuijck, The Netherlands) and xylazin (Xylazin, Ceva Sante Animale BV, Naaldwijk, The Netherlands) in a volume of . Anesthesia was maintained by subcutaneous injection of of the same xylazin-ketamin mixture every . Rats (Wistar-Kyoto; ) were anesthetized by a single intraperitoneal injection of urethane . All anesthetics were dissolved in saline. Body temperature was monitored using a rectal probe (PT100 sensor, Watlow, United Kingdom) and maintained at approximately by a heating platform (TH60-SMZ, Linkam Scientific Instruments, United Kingdom). 2.2.Tissue Preparation and InstrumentationAnimals were placed in the supine position. In mice, the right common carotid artery was surgically exposed up to the bifurcation.5 In rats, the abdominal region was surgically opened to expose the left renal artery. To simplify discrimination between artery and surrounding tissues in both preparations, a thin black plastic sheet was placed underneath the artery segments without stretching the vessel. Exposed areas were kept moist with saline at all time during the experiment. In both species, the left jugular vein was cannulated for administration of fluorescent dyes. Blood pressure was measured through a catheter inserted in the left femoral artery and linked to two blood pressure sensors (Baxter Uniflow, Baxter B.V., Utrecht, The Netherlands); the first sensor was used to monitor blood pressure and, hence, the hemodynamic condition of the animal. The second blood pressure signal was used as input for image triggering (see later in the paper). All catheters and blood pressure probes were filled with heparin ( in saline). To stabilize respiration, the trachea was intubated and ventilated with normal air using a ventilator (mouse: Minivent 845, Hugo Sachs Electronic GmbH, Germany; rat: Harvard rodent respirator, Harvard Apparatus, Massachusetts). As heart rate and also vessel motion may vary slightly from changes in intrathoracic pressure due to breathing, a respiration sensor (Graseby, Wicklow, Ireland) was placed on top of the chest to obtain a (relative) respiration signal for the trigger unit. In a number of mice , no (forced) ventilation was used to investigate the effect of spontaneous breathing on image motion and triggering. 2.3.Fluorescent LabelingNuclei of viable cells were labeled by topical and/or intravenous administration of the viable cell membrane permeable DNA/RNA markers SYTO13 or SYTO41 (Molecular Probes, Leiden, The Netherlands). Eosin (Molecular Probes) was used as a specific fluorescent marker for elastin. SYTO13 and SYTO41 (both ) and eosin were dissolved in saline and administered topically on the artery. In four rats and three mice, SYTO13 was infused intravenously ( of a solution in saline) to more specifically stain the endothelial cell nuclei and blood cells. Circulating blood platelets, cytoplasm of leukocytes, and cells in the arterial wall were labeled fluorescently by intravenous administration (i.v.) of acridin red (Chroma-Gesellschaft Schmidt GmbH, Germany; in saline with 5% ethanol; a bolus of in mice or in rats). Collagen (types I and III) in the tunica adventitia was visualized by second-harmonic generation (SHG). The subendothelial collagen layer (type IV) is too thin and located too deep to be detected by SHG on our system, especially in vivo.1, 2 Therefore, subendothelial collagen, which is luminally exposed on damage to the endothelium, was visualized using collagen-specific CNA3512, 27 labeled with green-fluorescent quantum dots [CNA35-QD525; i.v. containing CNA35-biotin and streptavidin coated quantum dots (Invitrogen)]. Propidium iodide was used to label nonviable cells (PI; Invitrogen; of a solution applied topically). 2.4.Damage-Induced Subendothelial Collagen ExposureIn a subset of experiments, the carotid artery of mice was pinched with a fine-tipped forceps for to induce damage across the vessel wall. In our ex vivo setup, this procedure has been shown to be effective both in inducing cell damage across the vessel wall,1 and in uncovering the subendothelial collagen layer.12 Then, the CNA35-QD525 solution was infused i.v. to label exposed subendothelial collagen.27 Furthermore, propidium iodide was applied topically to label nonviable cells. 2.5.Image AcquisitionA Nikon E600FN microscope (Nikon Corporation, Tokyo, Japan) connected to a Biorad 2100 MP multiphoton system (Biorad, Hemel Hempstead, United Kingdom) was used for TPLSM as previously described.1, 28 A -pulsed Ti:sapphire laser (Spectra Physics Tsunami, Mountain View, California) was used as the excitation source tuned and mode-locked at . Excitation powers at the sample varied from . Either a or a water dipping objective was used [numerical aperture (NA) 0.8 and 1.0, respectively] for TPLSM recordings. A water dipping objective (NA 0.5) was used in combination with a halogen cold light source (Schott KL 200, Schott AG, Mainz, Germany) to locate the exposed vessels. To detect the emitted fluorescent signals, three photomultiplier tubes were used. These were tuned to correspond with parts of the emission spectra of the fluorescent markers applied, aiming to find a balance between minimal bleed-through versus maximal signal reception.1 Images of were obtained for each color channel and combined into one RGB image. Series of 20 to 100 subsequent images were recorded (time series). Acquisition of each separate image was started by a trigger pulse derived from a trigger unit (see later in the paper). Optimal image acquisition time was determined empirically depending on heart rate (see later in the paper). Table 1 summarizes possible image acquisition times and settings of the system. Image acquisition times applied in this paper varied from , depending on matrix size, pixel dwell-time, line speed, and artery/species. When imaging at , optical zoom is automatically applied to reduce total scan area, and hence, image acquisition time. As an advantage, spatial resolution is increased. Furthermore, line speeds of are achieved through bidirectional scanning, which increases scanning speed (requiring no or less optical zoom), and also results in (correctable) interlacing errors (see later in the paper). Image acquisition time can also be decreased by using double and quadruple line scanning modes, where two or four lines are scanned at the same time. This results in a decrease of spatial resolution in the vertical direction ( direction), which can be corrected by applying additional zoom at the cost of FOV. Objects of interest should therefore be aligned in such a way that the maximum spatial resolution is obtained in the required direction. Table 1Image acquisition characteristics.
aIntroduction of (correctable) interlacing errors due to bidirectional scanning. Scanning modes indicate whether 1, 2, or 4 lines are scanned at the same time. Double and quadruple modes increase scanning speed, but decrease spatial resolution in vertical direction. FOV: field of view; image acquisition times assume frames of 256×256pixels . 2.6.TriggeringThe respiration sensor and one of the blood pressure sensors were connected to an electrocardiogram (ECG)-trigger unit (Rapid Biomedical, Würzburg, Germany), originally designed for application in magnetic resonance imaging. However, an ECG could not be used as input, since positioning of an objective lens on the animal strongly disturbed the recorded electrical activity. Therefore, the blood pressure signal derived from the femoral artery was fed into the ECG input, which resulted in modification of the signal. The output trigger signal was coupled to the trigger/synchronizer input port of the instrumentation control unit of the TPLSM system. The trigger unit displayed both respiration and modified blood pressure signals, and a threshold could be set for each (Fig. 1 ). The blood pressure signal was used as the primary determinant for the trigger moment, aiming to generate one trigger pulse per cardiac cycle. Furthermore, the influence of respiration on motion artifacts was minimized using the respiratory signal. Whenever the respiratory signal exceeded its threshold (during inspiration), triggering was disabled. If, however, the respiration signal was below threshold and the modified blood pressure signal crossed its threshold while rising, a trigger pulse was generated, initiating the acquisition of a single optical section. A trigger delay for both blood pressure and respiration could also be set. This simplified the search for an optimal trigger moment (during diastole and expiration) without the need for adjustment of the actual blood pressure signal, respiration signal, or thresholds. Fig. 1Recording of trigger pulse, modified blood pressure, and respiration signals. A recording of the output signals from the trigger unit (modified blood pressure and respiration) and the trigger pulses derived from them. Data were acquired in a ventilated mouse. The blood pressure signal is modified as it is connected to an ECG-input. Nevertheless, it can be used as input for triggering. (a): Trigger settings and generation of trigger pulses; thresholds for respiration and modified blood pressure are indicated by horizontal dashed lines. When the respiration signal is below threshold (expiration), triggering is enabled (gray bars). During the first cardiac cycle a trigger pulse is generated, as triggering was enabled when modified blood pressure crossed threshold upwards (vertical dotted line). The next two cardiac cycles, however, did not lead to the generation of a trigger pulse, as the modified blood pressure rose above threshold when triggering was disabled. In the fourth cycle, a trigger pulse is again generated. A trigger delay could be set and is marked by asterisks. The settings for thresholds and delay were determined empirically. Motion artifacts were smallest when imaging in the diastolic phase of the cardiac cycle. (b): A recording for the duration of , clearly showing that trigger pulses are generated in an irregular pattern.  Trigger pulse, modified blood pressure, and respiration signals from the trigger unit and absolute blood pressure signal were digitally recorded using the acquisition system M-PAQ in combination with the acquisition software package IDEEQ (IDEE, Maastricht, The Netherlands). The sampling rate was . Figure 1 shows such a recording for the duration of . Total frame time, start time of each subsequent image, and time gap between two subsequent optical sections (frames) were recorded using the TPLSM acquisition software (Lasersharp 6.0; Biorad). 2.7.Image ProcessingImage reconstructions were performed using the Image-Pro Plus 6.0 software (Media Cybernetics Inc., Silver Spring, Maryland). To further improve overall image quality, interlacing errors were corrected if needed (see results). Furthermore, Fourier transformation was performed to discriminate the original image frequencies (that lie around the origin, i.e., in the corners of the periodic spectrum plot) from higher noise and interlacing frequencies. The undesirable higher frequencies were then filtered out by multiplying the Fourier-spectra with a mask based on a 2-D Gaussian weighted function, thus improving SNR. Filtering in the Fourier domain and correction for interlacing inaccuracy were performed using software tools developed with the Mathematica 6.0 software package with “Digital Image Processing” (Wolfram Research Inc., Champaign, Illinois), and the “Front-end Vision” and “MathvisionTools” plugins (Eindhoven University of Technology, The Netherlands). 3.Results3.1.Cardiac and Respiratory ActivityDuring in vivo imaging, each image should be acquired well within one cardiac cycle to avoid image distortion (in-frame) and between-frame motion artifacts. In anesthetized mice, the duration of one cardiac cycle varied from ( ; reference values for nonanesthetized mice: ). This observed cardiac depression is a known side effect of the applied ketamin/xylazin anesthesia.29 In rats, anesthetized with urethane (which has less profound effects on heart rate), the cardiac cycle duration varied from ( ; reference values ).30 Anesthetized animals were ventilated; rats at a rate of and mice at a rate of with a tidal volume of . Some mice were allowed to breathe spontaneously, showing an anesthesia-induced respiratory depression over time (mean respiration rate at the start of imaging and at the end of the experiment). Therefore, experimentation time was limited in these animals. On the other hand, arterial movement due to breathing had a lower frequency in these mice and could thus be overcome more easily. Results obtained in artificially damaged carotid arteries were obtained this way. A drawback of unventilated triggering is a less regular respiratory activity, which might impede accurate triggering. 3.2.Nontriggered In Vivo ImagingIn view of the heart rates already given, image acquisition times should be shorter than in mice and in rats to limit motion distortion. Such short image acquisition times can be achieved either by increasing the line scan rate or decreasing the number of lines per image (matrix size). The first method, however, decreases the pixel dwell-time at the cost of a lower SNR and, at higher rates, is accompanied by an automatic optical zoom resulting in a smaller FOV (Table 1). The second method results in lower pixel resolution, which can be resolved only by using an equivalent optical zoom. Comparison of several typical acquisition rates for imaging of an ex vivo mounted artery revealed that imaging at yielded optical sections with a sufficient large FOV (no optical zoom is induced) and relatively good overall image quality. However, this frequency was not high enough for in vivo imaging since acquisition time exceeded a complete cardiac cycle and therefore all motions within this cycle were captured in each single image (Fig. 2 and Video 1 ; mouse carotid artery). Fig. 2Nontriggered in vivo TPLSM at normal (ex vivo) scan rates. Three subsequent optical sections (a) to (c) of a left carotid artery of a C57Bl6/J mouse obtained in vivo without application of external triggering. Image acquisition time was ( ; normal scanning mode; ). The schematic drawing on the left indicates the position of the optical sections in the vessel wall; vSMC, vascular smooth muscle cell; FOV, field of view; bars indicate . Cell nuclei (SYTO13, green) and extracellular matrix (SHG of adventitial collagen, blue; autofluorescence of elastin, red) are visible. All sections are disturbed by motion artifacts, which cause the arterial wall (blue arrow) to appear as a curved structure. Moreover, every optical section contains different parts of the (moving) vessel wall. The typical morphology and orientation of the smooth muscle cell nuclei (green) is hardly recognizable; the position of the lumen is unclear.  Nontriggered in vivo TPLSM at normal (ex vivo) scan rates. Time series recorded in a left carotid artery of a C57Bl6/J mouse in vivo without application of external triggering. Image acquisition time was ( ; normal scanning mode; ). The FOV was approximately . Cell nuclei (SYTO13, green) and extracellular matrix (SHG of adventitial collagen, blue; autofluorescence of elastin, red) are visible. All sections are disturbed by motion artifacts which cause the arterial wall to appear as a curved structure. Moreover, every optical section contains different parts of the moving vessel wall. The typical morphology and orientation of the smooth muscle cell nuclei (green) is hardly recognizable; the position of the lumen is unclear (QuickTime, ). (Color online only.) . 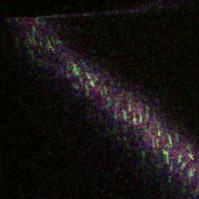 As published before, increasing the image acquisition rate in vivo eliminates large motion artifacts from at least some of the optical sections in a time series.11 Nevertheless, most of the images obtained this way are of low quality due to movements of the sample, loss of focus on the sample, or even complete disappearance of the vessel from the FOV. 3.3.Triggered In Vivo ImagingTriggered image acquisition of each optical section resulted in subsequent images that (almost) all display the same part of the artery during the same phase of movement. Consequently, the obtained optical sections are mutually comparable. As in untriggered imaging, higher frame rates yielded better results than rates of the order of cardiac rates, as images are acquired in a shorter part of the cardiac cycle. Therefore, a more stable period can be found using shorter image acquisition times (Fig. 3 and Video 2 ; rat renal artery, image acquisition time ; cardiac cycle duration ). Fig. 3Triggered in vivo TPLSM at high scan rates. Five successive optical sections (a) to (e) of the left renal artery of a Wistar-Kyoto rat in vivo obtained by triggered acquisition at an image acquisition time of ( ; normal scanning mode; ). Cardiac cycle duration was . Schematic drawing displays the position of the optical sections; vSMC, vascular smooth muscle cell; FOV, field of view; bars indicate . Artery was labeled topically for cell nuclei (SYTO13, green) and systemically for cytoplasm of (blood) cells and platelets (acridin red, orange). The successive optical sections contain the same part of the artery. In the tunica adventitia, collagen (SHG, blue) and nuclei (arrowhead) are visible; vSMC nuclei (white arrow) are observable in the tunica media. Moreover, an adhesive blood cell (encircled by white dotted line) is visible against the vessel wall in several successive images. The lumen appears orange due to circulating unbound acridin red.  Triggered in vivo TPLSM at high scan rates. Stable recording of the left renal artery of a Wistar-Kyoto rat in vivo obtained by triggered acquisition at an image acquisition time of . The FOV was approximately . The artery was labeled topically for cell nuclei (SYTO13, green) and systemically for cytoplasm of (blood) cells and platelets (acridin red, orange). The nuclei of the smooth muscle cells are labeled by both probes (yellow). SHG of collagen (blue) is visible in the tunica adventitia. Images show no distortion and between-frame motion is very small due to triggered acquisition. (QuickTime, ). (Color online only.) . 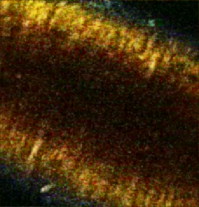 Series of subsequent optical sections with the smallest impact of image distortion and between-frame motion disturbances were obtained when images were acquired within the diastolic phase of the cardiac cycle. However, trigger pulses were generated at peaks of the modified blood pressure signal. Therefore, a trigger delay was used to start image acquisition in diastole, which could easily be introduced via the trigger unit. The amount of delay required for stable imaging was determined empirically. The timing of image acquisition in (part of) the systolic phase of the cardiac cycle resulted in images with large motion artifacts and strong deformations of the tissue, even at higher imaging rates (not shown). In rat renal arteries, triggered imaging often resulted in more stable images and smaller motion disturbances than in mouse carotid arteries. This finding was to be expected as the more distally located renal artery suffers less from thoracic movement or deformation due to respiration. Also, the heart rate in rats was lower. 3.4.Image ProcessingThe overall image quality suffered from the fast acquisition rates that affect the SNR, due to short pixel dwell-times [Fig. 4 ]. The SNR was enhanced using Fourier spectrum-based noise filtering [Fig. 4]. Additionally, fast image acquisition using scan rates of (Table 1) resulted in images that appeared to exhibit stretched details in the horizontal direction. To reduce total acquisition time, odd scan lines of the matrix are automatically scanned from left to right and even scan lines from right to left (bidirectional scanning), instead of scanning each horizontal line from left to right (unidirectional scanning; standard for lower frame rates). Image analysis of bidirectionally scanned images revealed that in comparison with the odd scan lines, the even scan lines of the image matrix were shifted in the horizontal direction (varying from ), causing blurred images. Correction of this interlacing inaccuracy resulted in remarkably sharper images [Fig. 4]. As a consequence, the image matrix size was also reduced in the horizontal direction, reflecting a slightly smaller FOV. Fig. 4Image enhancement. The effects of image processing applied to one of the optical sections of the series of images as shown in Fig. 3; (a) raw image of the data file, as shown in fig. 3, the image appears fuzzy and the smooth muscle cell nuclei (white arrow) are hardly recognizable as separate structures; (b) the same optical section after correction for inaccurate line positioning (interlacing error), the image already appears sharper and the smooth muscle cell nuclei (white arrow) appear separated and an adhesive blood cell (encircled by white dotted line) is more clearly visible; and (c) filtering in the Fourier domain further improves SNR of the image. Also, the nuclei of smooth muscle cells (white arrow) are more apparent.  3.5.In Vivo Molecular Imaging of Exposed Subendothelial CollagenIn a subset of experiments, the carotid artery of mice was damaged to expose the thin subendothelial collagen sheet, which was labeled using CNA35-conjugated quantum dots.27 Propidium iodide (PI) was used as a cell viability assay. The damaging procedure dramatically increased the number of PI positive (i.e., nonviable) cells across the vessel wall, including the endothelium [Figs. 5 and 5 ]. Furthermore, subendothelial collagen, which is normally covered by endothelial cells and can not be reached by CNA35-QD525, was now exposed and could be labeled with CNA35-QD525 resulting in a bright green labeled layer. This thin layer was visualized at a subcellular level in vivo, and is clearly located between the smooth muscle and endothelial cell nuclei [Fig. 5], which can be distinguished based on morphology and location in the vessel wall.1 The collagen in the adventitial layer (as shown by SHG) was not labeled with CNA35-QD525, which indicates that the elastic laminae were still intact and prevented CNA35-QD525 labeling over the vessel wall. Fig. 5Imaging of subendothelial collagen prior to and after mechanical damage. Optical sections of a left carotid artery of a C57Bl6/J mouse obtained in vivo with application of external triggering. Images were recorded at double scanning mode, resulting decreased spatial resolution in the vertical direction ( direction). Image acquisition time was ( ; double scanning mode; ). Cardiac cycle duration was . Schematic drawings on the left indicate the position of the optical sections in the vessel wall; PI, propidium iodide; FOV, field of view; ROI, region of interest; bars indicate . Mouse carotid artery in vivo after injection of PI (red) and CNA35-QD525 (green) (a) prior to and (b) after pinching. (a) Prepinching; some PI-positive cells (red) can be found in the adventitia (blue SHG, arrowhead) due to surgery; (b) postpinching; the image distortion (white arrow) in the top part indicates that part of the image was not recorded during the diastolic phase; by selecting an ROI (blue dotted area) a stable window can be defined; and (c) ROI from (b). Almost all cell nuclei are PI-positive (red; i.e., have a compromised outer cell membrane) and, therefore, a labeled collagen sheet (green) can be observed located between endothelial cell nuclei (round and closest to the lumen; blue arrows) and smooth muscle cell nuclei (elongated; purple arrow). Adventitial collagen is not labeled by quantum dots, but can be identified by SHG (blue, arrowhead).  4.DiscussionWe showed the feasibility of in vivo imaging of structures in the wall of large elastic arteries of mice and rats at a subcellular resolution. Moreover, we visualized the thin collagen sheet present under the endothelium after damaging the vessel wall. It is the first time the subendothelial collagen layer has been imaged in vivo in vessels of this size. Application of fluorescently labeled CNA35 combined with in vivo triggered TPLSM imaging might prove a valuable tool to investigate the role of subendothelial collagen in the onset or progression of (unstable) atherosclerotic plaques.12, 28 Furthermore, it demonstrates the enormous potential for stable detection of small vascular structures deep in the tissue, such as subcellular atherosclerotic plaque components,28 and the endothelial glycocalyx.31 In vivo imaging in larger arteries is severely challenged due to in-frame and between-frame motion artifacts. We showed that a combination of short image acquisition times and triggering on cardiac and respiratory cycles can for the most part overcome these problems (cf., Videos 1 and 2). Although image distortion may still occur (Fig. 5), the influence of between-frame vessel wall movement on image stability is greatly reduced. Triggering on blood pressure signal proved to be most effective to improve image quality as vessel motion is mainly governed by pulse wave deformation (cardiac activity). This is especially true for rat renal arteries. Therefore, application of a more sophisticated solid state pressure transducer catheter (Millar transducer without fluid column, as applied in Ref. 32), which yields more stable and accurate blood pressure signals, may enhance the precision of triggering and, thus, provide more accurate timing of image acquisition. This would reduce between-frame motion artifacts even further. Image distortion due to vessel motion was reduced by applying shorter image acquisition times (typically in rat renal arteries and in mouse carotid arteries). Assuming that the duration of the diastolic phase is about half the cardiac cycle, stable images can be acquired in animals with heart rates varying from (0.34 and per cardiac cycle, respectively) with these settings. If necessary, image acquisition times could be shortened to match higher heart rates (Table 1). However, there is a trade-off between reduction of distortion and SNR. Short image acquisition times also dictate small image matrix sizes. As a consequence, pixel resolution is not optimal. Furthermore, high excitation powers are required to generate sufficient signal. This will lead to increased photodegradation of the fluorescent markers, which causes the SNR to drop over time. In the data presented here, however, photodegradation was not observed to hamper experiments significantly. Interestingly, quantum dots are hardly vulnerable to photobleaching,33 making them ideal candidates for more lengthy in vivo measurements. The experiments were performed using a combination of different fluorescent markers, each with their own excitation maximum. At the chosen excitation wavelengths , this meant that the probes could all be excited sufficiently but not optimally. Again, quantum dots are the exception to this rule, as they have broad excitation spectra, with only very small emission peaks. Theoretically, the axial resolution of our system would be around , depending on the excitation wavelength and the NA of the objective used. As discussed elsewhere,1, 28 a more realistic value would be , depending on the location in the vessel. This can for the larger part be explained by a mismatch between the refractive index of the vessel wall components and the objective, which accumulates with increasing depth. Furthermore, the axial resolution will deteriorate when imaging deeper in (scattering) tissue, albeit to a lesser extent than with conventional microscopy. Using double or quadruple scanning modes to reduce image acquisition time limited spatial resolution in the vertical direction ( direction). Still, even nonoptimal by aligned structures could be imaged at a sufficient resolution (Fig. 5). Applying short image acquisition times also decreased the SNR. Using simple and straightforward image processing algorithms, the SNR could be improved. Other image processing techniques could be explored to guarantee optimal postacquisition SNR improvement. Acquisition SNR can also be improved by narrowing the pulse width of the excitation light, which would enhance the probability of the two-photon excitation.34 As a consequence, signal strength and, thus, SNR increases, which is beneficial for the image quality of accelerated image acquisition. On the other hand, a smaller pulse width would result in increased photodegradation of the fluorescent marker, thus counteracting the increase in signal strength. Novel high-speed two-photon microscopes22, 35 enable image acquisition at video rates and will therefore be less hampered by image distortion while providing good SNRs. Still, triggered acquisition is required to limit between-frame motion artifacts. The present triggering method can easily be applied to these systems. As already discussed, setting up in vivo experiments based on two-photon microscopy means balancing acquisition speed with heart rate and SNR, excitation wavelength with excitation spectra of fluorescent probes and penetration depth, and excitation power with penetration depth and photodegradation (length of experiment). The limitation of the presented system is sampling rate, since the generation of a trigger pulse is dependent on both the cardiac and the respiratory cycle. This means that the delay between images may vary between one and three to four cardiac cycles (Fig. 1). All taken together, the actual sampling rate of triggered image acquisition in the present system is . This is relatively low for imaging of fast functional processes in the vessel wall, such as calcium or nitric oxide dynamics or tracking of moving objects such as blood cells. Nevertheless, slow or stable interactions can still be studied, as shown in Fig. 3. This is also underlined in Video 3 labeled topically and systemically with SYTO13. The video clearly shows cells with lobed nuclei, acquired from a carotid artery of a ventilated mouse. Cell nuclei were slowly moving in the lumen near the vessel wall. These optical sections were obtained at the end of the experiment, where the blood pressure of the mouse had dropped below , while heart rate was unaltered. Although the physiological relevance of these images should be interpreted with care, they do underline the vast potential of triggered in vivo TPLSM imaging. 10.1117/1.3281672.3Triggered in vivo TPLSM provides subcellular resolution. Time series recorded in a carotid artery of a ventilated mouse. Cell nuclei were labeled topically and systemically with SYTO13 (green). Cells with lobed nuclei can be distinguished from smooth muscle cells (oriented in vertical direction), and are slowly moving in the lumen near the vessel wall. These optical sections were obtained at the end of the experiment, where the blood pressure of the mouse had dropped below , while heart rate was unaltered. The physiological relevance of the visualized phenomenon is still unclear, but it shows the subcellular resolution of triggered TPLSM in vivo. (QuickTime, ). (Color online only.) .  In conclusion, the presented method creates new opportunities for in vivo (molecular) imaging at a subcellular level of structures in the (diseased or damaged) arterial wall. Furthermore, 3-D imaging of the arterial wall might be possible, especially when the stability and accuracy of triggering on blood pressure is optimized. In addition, it can be used as a platform for in vivo testing and validation of novel molecular agents (e.g., targeted quantum dots33) as it provides detailed information regarding the behavior of such agents in large arteries in vivo. We showed this tool to be very suitable for CNA35-mediated in vivo collagen imaging. AcknowledgmentsWe thank Evelien Hermeling and Jeroen Hameleers from Maastricht University, Department of Biomedical Engineering, for their help with signal analysis and technical assistance. ReferencesR. T. Megens,
S. Reitsma,
P. H. Schiffers,
R. H. Hilgers,
J. G. De Mey,
D. W. Slaaf,
M. G. oude Egbrink, and
M. A. van Zandvoort,
“Two-photon microscopy of vital murine elastic and muscular arteries. Combined structural and functional imaging with subcellular resolution,”
J. Vasc. Res., 44
(2), 87
–98
(2007). https://doi.org/10.1159/000098259 1018-1172 Google Scholar
M. A. van Gestel,
S. Reitsma,
D. W. Slaaf,
V. V. Heijnen,
M. A. Feijge,
T. Lindhout,
M. A. van Zandvoort,
M. Elg,
R. S. Reneman,
J. W. Heemskerk, and
M. G. Egbrink,
“Both ADP and thrombin regulate arteriolar thrombus stabilization and embolization, but are not involved in initial hemostasis as induced by micropuncture,”
Microcirculation (Philadelphia), 14
(3), 193
–205
(2007). 1073-9688 Google Scholar
M. G. Oude Egbrink,
G. H. Janssen,
K. Ookawa,
D. W. Slaaf,
R. S. Reneman,
X. H. Wehrens,
K. J. Maaijwee,
N. Ohshima,
H. A. Struijker Boudier, and
G. J. Tangelder,
“Especially polymorphonuclear leukocytes, but also monomorphonuclear leukocytes, roll spontaneously in venules of intact rat skin: involvement of E-selectin,”
J. Invest. Dermatol., 118
(2), 323
–326
(2002). https://doi.org/10.1046/j.0022-202x.2001.01693.x 0022-202X Google Scholar
J. Bosman,
G. J. Tangelder,
M. G. Oude Egbrink,
R. S. Reneman, and
D. W. Slaaf,
“Local application of adenosine induces an increase of capillary diameter in skeletal muscle of anesthetized rabbits,”
J. Vasc. Res., 33
(2), 111
–118
(1996). https://doi.org/10.1159/000159138 1018-1172 Google Scholar
S. Massberg,
K. Brand,
S. Gruner,
S. Page,
E. Muller,
I. Muller,
W. Bergmeier,
T. Richter,
M. Lorenz,
I. Konrad,
B. Nieswandt, and
M. Gawaz,
“A critical role of platelet adhesion in the initiation of atherosclerotic lesion formation,”
J. Exp. Med., 196
(7), 887
–896
(2002). https://doi.org/10.1084/jem.20012044 0022-1007 Google Scholar
E. E. Eriksson,
J. Werr,
Y. Guo,
P. Thoren, and
L. Lindbom,
“Direct observations in vivo on the role of endothelial selectins and alpha(4) integrin in cytokine-induced leukocyte-endothelium interactions in the mouse aorta,”
Circ. Res., 86
(5), 526
–533
(2000). 0009-7330 Google Scholar
E. E. Eriksson,
X. Xie,
J. Werr,
P. Thoren, and
L. Lindbom,
“Direct viewing of atherosclerosis in vivo: plaque invasion by leukocytes is initiated by the endothelial selectins,”
FASEB J., 15
(7), 1149
–1157
(2001). https://doi.org/10.1096/fj.00-0537com 0892-6638 Google Scholar
Y. Huo,
A. Schober,
S. B. Forlow,
D. F. Smith,
M. C. Hyman,
S. Jung,
D. R. Littman,
C. Weber, and
K. Ley,
“Circulating activated platelets exacerbate atherosclerosis in mice deficient in apolipoprotein E,”
Nat. Med., 9
(1), 61
–67
(2003). https://doi.org/10.1038/nm810 1078-8956 Google Scholar
D. B. Murphy, Fundamentals of Light Microscopy and Electronic Imaging, Wiley-Liss, New York
(2001). Google Scholar
J. Pawley, Handbook of Biological Confocal Microscopy, Springer, New York
(2006). Google Scholar
M. van Zandvoort,
W. Engels,
K. Douma,
L. Beckers,
M. Oude Egbrink,
M. Daemen, and
D. W. Slaaf,
“Two-photon microscopy for imaging of the (atherosclerotic) vascular wall: a proof of concept study,”
J. Vasc. Res., 41
(1), 54
–63
(2004). https://doi.org/10.1159/000076246 1018-1172 Google Scholar
R. T. Megens,
M. G. Oude Egbrink,
J. P. Cleutjens,
M. J. Kuijpers,
P. H. Schiffers,
M. Merkx,
D. W. Slaaf, and
M. A. van Zandvoort,
“Imaging collagen in intact viable healthy and atherosclerotic arteries using fluorescently labeled CNA35 and two-photon laser scanning microscopy,”
Mol. Imaging, 6
(4), 247
–260
(2007). 1535-3508 Google Scholar
T. Boulesteix,
A. M. Pena,
N. Pages,
G. Godeau,
M. P. Sauviat,
E. Beaurepaire, and
M. C. Schanne-Klein,
“Micrometer scale ex vivo multiphoton imaging of unstained arterial wall structure,”
Cytometry, Part A, 69
(1), 20
–26
(2006). https://doi.org/10.1002/cyto.a.20196 1552-4922 Google Scholar
D. E. Ferrara,
D. Weiss,
P. H. Carnell,
R. P. Vito,
D. Vega,
X. Gao,
S. Nie, and
W. R. Taylor,
“Quantitative 3D fluorescence technique for the analysis of en face preparations of arterial walls using quantum dot nanocrystals and two-photon excitation laser scanning microscopy,”
Am. J. Physiol. Regulatory Integrative Comp. Physiol., 290
(1), R114
–123
(2006). 0363-6119 Google Scholar
P. Maffia,
B. H. Zinselmeyer,
A. Ialenti,
S. Kennedy,
A. H. Baker,
I. B. McInnes,
J. M. Brewer, and
P. Garside,
“Images in cardiovascular medicine. Multiphoton microscopy for 3-dimensional imaging of lymphocyte recruitment into apolipoprotein-E-deficient mouse carotid artery,”
Circulation, 115
(11), e326
–328
(2007). https://doi.org/10.1161/CIRCULATIONAHA.106.658492 0009-7322 Google Scholar
K. Svoboda,
W. Denk,
D. Kleinfeld, and
D. W. Tank,
“In vivo dendritic calcium dynamics in neocortical pyramidal neurons,”
Nature, 385
(6612), 161
–165
(1997). https://doi.org/10.1038/385161a0 0028-0836 Google Scholar
S. L. Ashworth and
G. A. Tanner,
“Fluorescent labeling of renal cells in vivo,”
Nephron Physiol., 103
(2), p91
–96
(2006). https://doi.org/10.1159/000090626 Google Scholar
K. W. Dunn,
R. M. Sandoval,
K. J. Kelly,
P. C. Dagher,
G. A. Tanner,
S. J. Atkinson,
R. L. Bacallao, and
B. A. Molitoris,
“Functional studies of the kidney of living animals using multicolor two-photon microscopy,”
Am. J. Physiol.: Cell Physiol., 283
(3), C905
–916
(2002). 0363-6143 Google Scholar
K. W. Dunn and
P. A. Young,
“Principles of multiphoton microscopy,”
Nephron Exp. Nephrol., 103
(2), e33
–40
(2006). https://doi.org/10.1159/000090614 Google Scholar
J. J. Kang,
I. Toma,
A. Sipos,
F. McCulloch, and
J. Peti-Peterdi,
“Quantitative imaging of basic functions in renal (patho)physiology,”
Am. J. Physiol. Renal Physiol., 291
(2), F495
–502
(2006). https://doi.org/10.1152/ajprenal.00521.2005 Google Scholar
A. Sipos,
I. Toma,
J. J. Kang,
L. Rosivall, and
J. Peti-Peterdi,
“Advances in renal (patho)physiology using multiphoton microscopy,”
Kidney Int., 72
(10), 1188
–1191
(2007). https://doi.org/10.1038/sj.ki.5002461 0085-2538 Google Scholar
T. P. Padera,
B. R. Stoll,
P. T. So, and
R. K. Jain,
“Conventional and high-speed intravital multiphoton laser scanning microscopy of microvasculature, lymphatics, and leukocyte-endothelial interactions,”
Mol. Imaging, 1
(1), 9
–15
(2002). https://doi.org/10.1162/153535002753395662 1535-3508 Google Scholar
J. A. Palero,
H. S. de Bruijn,
A. van der Ploeg van den Heuvel,
H. J. Sterenborg and
H. C. Gerritsen,
“Spectrally resolved multiphoton imaging of in vivo and excised mouse skin tissues,”
Biophys. J., 93
(3), 992
–1007
(2007). https://doi.org/10.1529/biophysj.106.099457 0006-3495 Google Scholar
J. A. Palero,
G. Latouche,
H. S. de Bruijn,
A. van der Ploeg van den Heuvel,
H. J. Sterenborg, and
H. C. Gerritsen,
“Design and implementation of a sensitive high-resolution nonlinear spectral imaging microscope,”
J. Biomed. Opt., 13
(4), 044019
(2008). https://doi.org/10.1117/1.2953180 1083-3668 Google Scholar
T. Worbs,
T. R. Mempel,
J. Bolter,
U. H. von Andrian, and
R. Forster,
“CCR7 ligands stimulate the intranodal motility of T lymphocytes in vivo,”
J. Exp. Med., 204
(3), 489
–495
(2007). https://doi.org/10.1084/jem.20061706 0022-1007 Google Scholar
W. Yu,
J. C. Braz,
A. M. Dutton,
P. Prusakov, and
M. Rekhter,
“In vivo imaging of atherosclerotic plaques in apolipoprotein E deficient mice using nonlinear microscopy,”
J. Biomed. Opt., 12
(5), 054008
(2007). https://doi.org/10.1117/1.2800337 1083-3668 Google Scholar
R. A. Boerboom,
K. N. Krahn,
R. T. Megens,
M. A. van Zandvoort,
M. Merkx, and
C. V. Bouten,
“High resolution imaging of collagen organisation and synthesis using a versatile collagen specific probe,”
J. Struct. Biol., 159
(3), 392
–399
(2007). https://doi.org/10.1016/j.jsb.2007.04.008 1047-8477 Google Scholar
R. T. Megens,
M. G. Oude Egbrink,
M. Merkx,
D. W. Slaaf, and
M. A. van Zandvoort,
“Two-photon microscopy on vital carotid arteries: imaging the relationship between collagen and inflammatory cells in atherosclerotic plaques,”
J. Biomed. Opt., 13
(4), 044022
(2008). https://doi.org/10.1117/1.2965542 1083-3668 Google Scholar
B. J. Janssen,
T. De Celle,
J. J. Debets,
A. E. Brouns,
M. F. Callahan, and
T. L. Smith,
“Effects of anesthetics on systemic hemodynamics in mice,”
Am. J. Physiol. Heart Circ. Physiol., 287
(4), H1618
–1624
(2004). https://doi.org/10.1152/ajpheart.01192.2003 0363-6135 Google Scholar
J. Oosting,
H. A. Struijker-Boudier, and
B. J. Janssen,
“Autonomic control of ultradian and circadian rhythms of blood pressure, heart rate, and baroreflex sensitivity in spontaneously hypertensive rats,”
J. Hypertens., 15
(4), 401
–410
(1997). https://doi.org/10.1097/00004872-199715040-00011 0263-6352 Google Scholar
S. Reitsma,
D. W. Slaaf,
H. Vink,
M. A. van Zandvoort, and
M. G. Oude Egbrink,
“The endothelial glycocalyx: composition, functions, and visualization,”
Pfluegers Arch., 454
(3), 345
–359
(2007). https://doi.org/10.1007/s00424-007-0212-8 0031-6768 Google Scholar
S. S. Rensen,
P. M. Niessen,
J. M. van Deursen,
B. J. Janssen,
E. Heijman,
E. Hermeling,
M. Meens,
N. Lie,
M. J. Gijbels,
G. J. Strijkers,
P. A. Doevendans,
M. H. Hofker,
J. G. De Mey, and
G. J. van Eys,
“Smoothelin-B deficiency results in reduced arterial contractility, hypertension, and cardiac hypertrophy in mice,”
Circulation, 118
(8), 828
–836
(2008). https://doi.org/10.1161/CIRCULATIONAHA.107.743690 0009-7322 Google Scholar
L. Prinzen,
R. J. Miserus,
A. Dirksen,
T. M. Hackeng,
N. Deckers,
N. J. Bitsch,
R. T. Megens,
K. Douma,
J. W. Heemskerk,
M. E. Kooi,
P. M. Frederik,
D. W. Slaaf,
M. A. van Zandvoort, and
C. P. Reutelingsperger,
“Optical and magnetic resonance imaging of cell death and platelet activation using annexin a5-functionalized quantum dots,”
Nano Lett., 7
(1), 93
–100
(2007). https://doi.org/10.1021/nl062226r 1530-6984 Google Scholar
G. McConnell,
“Improving the penetration depth in multiphoton excitation laser scanning microscopy,”
J. Biomed. Opt., 11
(5), 054020
(2006). https://doi.org/10.1117/1.2360593 1083-3668 Google Scholar
R. Kurtz,
M. Fricke,
J. Kalb,
P. Tinnefeld, and
M. Sauer,
“Application of multiline two-photon microscopy to functional in vivo imaging,”
J. Neurosci. Methods, 151
(2), 276
–286
(2006). https://doi.org/10.1016/j.jneumeth.2005.12.003 0165-0270 Google Scholar
|
|||||||||||||||||||||||||||||||||||||||||||||||||||||||||||||||


