
|
|
|
Recently there has been considerable interest in employing the photoacoustic effect to tomographically image biological tissues, both in vitro and in vivo.1, 2, 3, 4, 5 Termed photoacoustic tomagraphy (PAT), the emerging technique employs pulses of light to transiently generate thermoelastic tissue expansion, with a magnitude that depends on the local tissue’s optical and thermoacoustic properties. The excited tissue’s expansion and ensuing contraction give rise to a propagating broadband ultrasonic wave whose intensity is proportional to photon absorption and whose travel time is proportional to depth, subject to intervening tissue absorption, scattering, and dispersion. Measurements of the acoustic wave’s intensity and arrival time are made outside the sample with piezoelectric pressure transducers, from which 3-D maps of photon absorption can be reconstructed. To enable deeper tissue penetration of photons for acoustic wave production, near-infrared light of wavelengths between 700 and is used to exploit the modest translucency of most mammalian tissues at these wavelengths. Inherent imaging contrast arises from differences in the optical absorption of various tissues and their constituents, like the ten-fold difference in light absorption of blood from that of surrounding tissue.1 Since the number of intrinsic imaging contrast agents found in vivo is limited, a variety of exogenous contrast agents have been developed to broaden the repertoire of PA targets that include near-infrared fluorescent dyes (e.g., indocyanine green),2, 3, 4 carbon nanotubes,5 and metallic nanoparticles.6, 7, 8, 9 For this work, we selected gold nanorods (GNRs) as the platform of study, due to their easily tuned optical absorption and high biocompatibility. Previous studies have shown the longitudinal surface plasmon resonance of GNRs to be highly sensitive to nanorod size and aspect ratio, with strong correlation of those parameters to the wavelength and efficiency of photon absorption.10 Under pulsed laser excitation of sufficient energy to generate PA waves in vivo, however, transmission electron microscopy (TEM) studies have found significant permanent deformation of nanorods that correlated with adverse changes in the nanoparticle’s optical absorption, with increasing cumulative energy deposition resulting in blue-shifted, less intense absorption spectra for the longitudinal surface plasmon.11 Although several groups have exploited this laser-inducible shift in the GNRs’ peak absorption of near-infrared light to characterize fluid flow,12, 13 the consequential distortion and reduction of PA signal intensity severely limits its applicability to studies that permit replenishment of the contrast agent. To ameliorate thermally induced deformation of GNRs used in PAT, we postulated that encasing the GNRs in a layer of amorphous silica (GNR-Si) might prove helpful; that, because of its rigidity and optically transparency at near-infrared wavelengths, silica might provide the GNR with the mechanical stability necessary to preclude deformation while minimizing photon absorption and scattering within itself. Moreover, amorphous silica’s biocompatibility and biodegradability are well established, with it having been successfully used in a number of bioimaging and biosensing applications.14 In this work, bare GNRs with aspect ratios were prepared as described by Nikoobakht and El-Sayed,15 and then coated with porous silica using the single-step synthesis reported by Gorelikov and Matsuura.16 GNR and GNR-Si (approximately particles/L) morphologies were characterized with transmission electron microscopy (Hitachi H-7650 TEM), as shown in Fig. 1 . Fig. 1(a) TEM images and Mie-Gans theory spectra fits for GNRs [left, 1(a)] and GNRs-Si [right, 1(a)] prior to laser irradiation. (b) Photoacoustic imaging system used in the studies.  As shown in Fig. 1, a Nd:YAG laser (LS-2132U, LOTIS TII, Minsk, Belarus) operating at was used to pump a widely tunable Ti:sapphire laser (CF-125, SOLAR TII, Minsk, Republic of Belarus), delivering pulses of light at a pulse repetition frequency of . The laser’s output beam was attenuated with a lens before entering a water tank that held a Rexolite 1422 (San Diego Plastics, California) tube phantom bearing of GNR or GNR-Si in water. PA signals were detected with a commercial piezoelectric transducer (V303, Panametrics) immersed in the tank that possessed a center frequency of and a line focal depth of . The pressure transducer’s output was amplified with an ultrasonic receiver (5077PR, Panametrics, Waltham, Massachusetts) and recorded at a rate of on a PC-mounted, laser-triggered data acquisition card (CompuScope 14200, Gage, Lachine, Quebec, Canada). In Fig. 2 we present the PA signal intensity of GNR and GNR-Si as a function of repeated laser excitation for two different photon fluences. Signals were normalized to their respective initial values (i.e., maxima) and fit to the single exponential curves. Early PA signal intensities of GNR and GNR-Si were found to be approximately equal to one another [PA signal intensities were 48.81 for GNR and 44.28 for GNR-Si in Fig. 2; and 123 for GNR and 126.3 for GNR-Si in Fig. 2], suggesting that the thermal-acoustic impedance mismatch—introduced by the silica layer between the metal nanorod and its aqueous surroundings—was of little consequence to the formation of acoustic waves. When exposed to of coherent light [Fig. 2], the PA signal intensity of GNR decays rapidly during the first to 57% of its initial value, and decreases further to 45% of its initial value after . When GNR-Si is subjected to identical laser irradiation, however, the PA signal decays only to 86% of its initial maximal intensity during the first , and remains relatively constant at that level thereafter. Fig. 2Normalized PA signal intensity (dotted lines) and their exponential fitted curves (solid lines) for GNRs (gray) and GNRs-Si black), as a function of time, for laser irradiations of (a) and (b) .  Increasing the excitation photon fluence further resulted in considerable degradation of the PA response from both GNR and GNR-Si [Fig. 2]. At exposures of [the ANSI Z136 maximum permissible exposure (MPE) of human skin to visible/near-visible coherent light] the PA signal intensity of GNR decays very rapidly to 45% of its initial value within the first , and decreases further to 37% of its initial strength after . By comparison, exposures of GNR-Si resulted in the average PA signal intensity decaying to 58% of its initial value after , and remaining stable thereafter—quite unlike the continuing decay exhibited by GNR’s PA signal. Increasing the photon fluence to showed no effect on the PA signal generated by GNR-Si, with an intensity approximately 60% of that of its initial value after , and remaining stable thereafter. To verify that these changes in PA signal intensity with time and photon fluence arose from the deformation of nanorods and not some other source, we made a series of TEM and optical absorption spectrum (DU800 UV, Beckman) measurements, as shown in Fig. 3 . When subjected to exposures of , TEM studies revealed that a significant fraction of the original bare GNRs [upper left, Fig. 3] had deformed into rounder, lower aspect ratio entities, while spectroscopy showed the longitudinal surface plasmon’s absorption peak had flattened and blue-shifted [center left, Fig. 3]. GNR-Si [upper right, Fig. 3], however, did not exhibit such behavior at these levels of irradiation, being able to, more or less, maintain their original morphology and absorption spectrum [center right, Fig. 3]. Fig. 3TEM images, optical absorption spectra, and Mie-Gans theory spectra fits for exposures of GNRs [(a) left] and GNRs-Si [(a) right], and for exposures of GNRs [(b) left] and GNRs-Si [(b) right]. 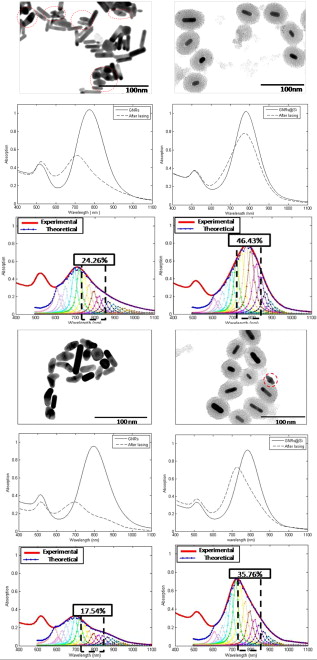 When GNRs were subjected to photon fluences of , TEM studies showed that the overwhelming majority of bare GNR had distorted into either oblate/prolate spheroids or bent, v-shaped cylinders—with the longitudinal plasmon’s absorption peak height reduced to roughly that of the transverse plasmon’s (aspect ratio -independent) peak [left, Fig. 3]. In contrast, TEM morphology and absorption spectra measurements of GNR-Si demonstrated relatively modest differences between 21.20 and irradiated specimens, with less than a 10% height reduction and a blue-shift in the longitudinal plasmon’s absorption peak for higher doses [right, Fig. 3]. Thus, postirradiated GNR-Si retained many of the structural and optical attributes of preirradiated GNR-Si, consistent with PA signal intensity measurements. Unfortunately, both sample preparation and practical limits on the number of samples/images that can be analyzed often result in TEM yielding statistically poor representations of nanorod aspect ratio distributions. To address this shortcoming in our analysis based on TEM measurements, we fitted our empirically derived inhomogeneously broadened optical absorption spectra to multiple calculated homogeneously broadened absorption spectra that were each synthesized via Mie-Gans theory for a collection of single-aspect-ratio nanorods.17 The weighting/frequency of each aspect ratio’s calculated spectra used in fitting measured spectra was determined iteratively by a least squares solution of minimum normal between discretized forms of the measured and calculated spectra at a given wavelength. The individually weighted, calculated absorption spectra and their summation for different laser exposures of GNR and GNR-Si are shown in Figs. 1 and 3. As the graphs illustrate, the percentage of GNRs with aspect ratios between 3.75 and 4.75, which reflect nanorods with longitudinal surface plasmon absorption peaks at wavelengths close to that of our GNR before laser deformation , decreased from 61.0 to 24.3% after exposure, and down to 17.5% after exposure, while corresponding exposures of GNR-Si resulted in decreases from 64.3 to 46.4 to 35.8%, respectively. We note, however, that care must be exercised when interpreting the aspect ratio distributions of more thermally deformed nanorods via this method since, as TEM images like that of Figs. 3 and 3 show, a number of nanorods become angular/bent with repeated laser irradiation, and thus no longer satisfy the smoothness of topology assumed by either the Mie theory or Gans extension of the Mie theory. Indeed, under such circumstances, rigorous application of the discrete dipole approximation (DDA) may be more appropriate than Mie-Gans modeling, albeit at far greater computational expense, since both scattering and absorption efficiencies must be considered (due to their comparable magnitudes), and large numbers of point dipoles [perhaps on nonperiodic lattices that preclude fast Fourier transform (FFT) simplification, or inclusion of higher-order multiple excitations] will be needed to approximate light scattering/absorption by irregular surfaces (e.g., vertices, crevices) and ensure convergence of optical properties.18, 19 Moreover, surface plasmons and intraband transitions tend to obscure many of the spectral fine structure that otherwise characterize light scattering/absorption by angular metallic (nongold) nanoparticles.20, 21 Thus there is considerable a-priori concern as to the ability of DDA methods to uniquely describe the distribution of both gold nanopractice sizes and shapes responsible for a particular optical signature. To determine if the stability conferred by silica encasement on nanorod morphology actually resulted in improved PA imaging contrast and stability, the system shown in Fig. 1 was used but with the ultrasonic transducer, now driven by a precision linear stage (HR8, Nanomotion, Yokneam, Israel). A phantom comprised of a -diam tube filled with cotton and either GNR or GNR-Si was placed within the tank, orthogonal to the transducer. During a scan, discrete PA measurements were made as the transducer was stepped in increments across the tube’s minor axis to provide 1-D cross sectional views. PA contrast assessment was made by including cotton packing material within the phantom to provide a source of nonuniform GNR or GNR-Si distribution. For these nontomographic studies, the MPE photon fluence of was used to provide clinically relevant signal-to-noise ratios (SNRs) in imaging. In Fig. 4 we show PA intensity images of tubes filled with GNR (top) and GNR-Si (bottom), derived from samplings that began (left) and (right) after commencement of continuous laser irradiation. As the circled regions of Fig. 4 emphasize, GNR suffered considerable loss of image detail as laser exposure continued—a situation not observed in GNR-Si, whose PA image appears largely unchanged at later time points. Sequential comparison of the intensity in each image of a given tube also revealed a similar loss of information with time, with the intensity of GNR decreasing by after , while that of GNRs at Si decreased by only from their respective initial values [Fig. 4], consistent with earlier, nonimaging PA signal intensity measurements. Fig. 4(a) Cross sectional PA images of tubes containing GNRs (upper) or GNRs-Si (lower) made from data acquired during the first (left) and sixth (right) intervals of continuous laser irradiation. (b) Semiquantification of PA signal intensity decay with time/exposure of GNRs and GNRs-Si, derived via subtraction of each tube’s image from the corresponding pixels of a tube’s first image in the sequence. Circled regions highlight areas of significant signal loss.  In summary, we have synthesized and evaluated both bare and amorphous silica-coated GNRs in an effort to determine whether the confinement of GNRs by rigid silica would improve their utility as photoacoustic contrast agents. TEM and optical absorption studies of bare GNR versus. GNR-Si revealed the latter to have significantly greater resistance than bare GNR to thermal deformation under repeated laser irradiation, without diminution of the longitudinal surface plasmon’s absorption efficiency, even at photon fluences more than three times the MPE. PA signals generated by GNR-Si similarly demonstrated commensurately greater resistance to degradation of signal intensity with repetitive pulsing than did uncoated GNRs, enabling much longer, high-contrast imaging sessions than previously possible. The prolongation of high-contrast imaging and easy surface functionalization for targeting ligand binding afforded by the amorphous silica coating suggest GNR-Si to be a significant step toward the clinical translation of PAT. AcknowledgmentsThe study was conducted with the support of NHRI Intramural Research grant MED-097-PP-04 from National Health Research Institutes of Taiwan; and with grant NSC-97-3011-P-002-009 from the National Science Council of Taiwan. Technical assistance from Yu-Ching Chen on TEM images was much appreciated. ReferencesM. Xu and
L. V. Wang,
“Photoacoustic imaging in biomedicine,”
Rev. Sci. Instrum., 77
(4), 041101
(2006). https://doi.org/10.1063/1.2195024 0034-6748 Google Scholar
X. Wang,
G. Ku,
M. A. Wegiel,
D. J. Bornhop,
G. Stoica, and
L. V. Wang,
“Noninvasive photoacoustic angiography of animal brains in vivo with near-infrared light and an optical contrast agent,”
Opt. Lett., 29
(7), 730
(2004). https://doi.org/10.1364/OL.29.000730 0146-9592 Google Scholar
G. Kim,
S. W. Huang,
K. C. Day,
M. O’Donnell,
R. R. Agayan,
M. A. Day,
R. Kopelman, and
S. Ashkenazi,
“Indocyanine-green-embedded PEBBLEs as a contrast agent for photoacoustic imaging,”
J. Biomed. Opt., 12
(4), 044020
(2007). https://doi.org/10.1117/1.2771530 1083-3668 Google Scholar
G. Ku and
L. V. Wang,
“Deeply penetrating photoacoustic tomography in biological tissues enhanced with an optical contrast agent,”
Opt. Lett., 30
(5), 507
(2005). https://doi.org/10.1364/OL.30.000507 0146-9592 Google Scholar
A. De la Zerda,
C. Zavaleta,
S. Keren,
S. Vaithilingam,
S. Bodapati,
Z. Liu,
J. Levi,
B. R. Smith,
T. J. Ma,
O. Oralkan,
Z. Cheng,
X. Chen,
H. Dai,
B. T. Khuri-Yakub, and
S. S. Gambhir,
“Carbon nanotubes as photoacoustic molecular imaging agents in living mice,”
Nat. Nanotechnol., 3
(9), 557
(2008). https://doi.org/10.1038/nnano.2008.231 1748-3387 Google Scholar
J. A. Copland,
M. Eghtedari,
V. L. Popov,
N. Kotov,
N. Mamedova,
M. Motamedi, and
A. A. Oraevsky,
“Bioconjugated gold nanoparticles as a molecular based contrast agent: implications for imaging of deep tumors using optoacoustic tomography,”
Mol. Imaging Biol., 6
(5), 341
(2004). https://doi.org/10.1016/j.mibio.2004.06.002 1536-1632 Google Scholar
K. H. Song,
C. Kim,
C. M. Cobley,
Y. Xia, and
L. V. Wang,
“Near-infrared gold nanocages as a new class of tracers for photoacoustic sentinel lymph node mapping on a rat model,”
Nano Lett., 9
(1), 183
(2009). https://doi.org/10.1021/nl802746w 1530-6984 Google Scholar
K. Kim,
A. Agarwal,
S. W. Huang,
M. F. Denny,
M. J. Kaplan,
S. Ashkenazi,
M. Donnell, and
N. A. Kotov,
“Photoacoustic imaging of early inflammatory response using gold nanorods,”
Appl. Phys. Lett., 90
(22), 223901
(2007). https://doi.org/10.1063/1.2743752 0003-6951 Google Scholar
M. Eghtedari,
A. Oraevsky,
J. A. Copland,
N. A. Kotov,
A. Conjusteau, and
M. Motamedi,
“High sensitivity of in vivo detection of gold nanorods using a laser optoacoustic imaging system,”
Nano Lett., 7
(7), 1914
(2007). https://doi.org/10.1021/nl070557d 1530-6984 Google Scholar
L. Tong,
Q. Wei,
A. Wei, and
J. X. Cheng,
“Gold nanorods as contrast agents for biological imaging: optical properties, surface conjugation, and photothermal effects,”
Photochem. Photobiol., 85
(1), 21
(2009). https://doi.org/10.1111/j.1751-1097.2008.00507.x 0031-8655 Google Scholar
S. S. Chang,
C. W. Shih,
C. D. Chen,
W. C. Lai, and
C. R. C. Wang,
“The shape transition of gold nanorods,”
Langmuir, 15 701
(1999). https://doi.org/10.1021/la980929l 0743-7463 Google Scholar
P. C. Li,
S. W. Huang,
C. W. Wei,
Y. C. Chiou,
C. D. Chen, and
C. R. Wang,
“Photoacoustic flow measurements by use of laser-induced shape transitions of gold nanorods,”
Opt. Lett., 30
(24), 3341
(2005). https://doi.org/10.1364/OL.30.003341 0146-9592 Google Scholar
C. K. Liao,
S. W. Huang,
C. W. Wei, and
P. C. Li,
“Nanorod-based flow estimation using a high-frame-rate photoacoustic imaging system,”
J. Biomed. Opt., 12
(6), 064006
(2007). https://doi.org/10.1117/1.2812704 1083-3668 Google Scholar
P. Tallury,
K. Payton, and
S. Santra,
“Silica-based multimodal/multifunctional nanoparticles for bioimaging and biosensing applications,”
Nanomedicine, 3
(4), 579
(2008). https://doi.org/10.2217/17435889.3.4.579 1743-5889 Google Scholar
B. Nikoobakht and
M. A. El-Sayed,
“Preparation and growth mechanism of gold nanorods (NRs) using seed-mediated growth method,”
Chem. Mater., 15
(10), 1957
(2003). https://doi.org/10.1021/cm020732l 0897-4756 Google Scholar
I. Gorelikov and
N. Matsuura,
“Single-step coating of mesoporous silica on cetyltrimethyl ammonium bromide-capped nanoparticles,”
Nano Lett., 8
(1), 369
(2008). https://doi.org/10.1021/nl0727415 1530-6984 Google Scholar
S. Eustis and
M. A. El-Sayed,
“Determination of the aspect ratio statistical distribution of gold nanorods in solution from a theoretical fit of the observed inhomogeneously broadened longitudinal plasmon resonance absorption spectrum,”
J. Appl. Phys., 100
(4), 44324
(2006). https://doi.org/10.1063/1.2244520 0021-8979 Google Scholar
B. T. Draine and
P. J. Flatau,
“Discrete-dipole approximation for scattering calculations,”
J. Opt. Soc. Am. A, 11
(4), 1491
–1499
(1994). https://doi.org/10.1364/JOSAA.11.001491 0740-3232 Google Scholar
A. Brioude,
X. C. Jiang, and
M. P. Pileni,
“Optical properties of gold nanorods: dda simulations supported by experiments,”
J. Phys. Chem. B, 109 13138
–13142
(2005). https://doi.org/10.1021/jp0507288 1089-5647 Google Scholar
K. L. Kelly,
E. Coronado,
L. L. Zhao, and
G. C. Schatz,
“The optical properties of metal nanoparticles: the influence of size, shape, and dielectric environment,”
J. Phys. Chem. B, 107 668
–677
(2003). https://doi.org/10.1021/jp026731y 1089-5647 Google Scholar
I. O. Sosa,
C. Noguez, and
R. G. Barrera,
“Optical properties of metal nanoparticles with arbitrary shapes,”
J. Phys. Chem. B, 107 6269
–6275
(2003). https://doi.org/10.1021/jp0274076 1089-5647 Google Scholar
|


