|
|
1.IntroductionNear-infrared fluorescence diffuse optical tomography (FDOT) has been the subject of intense interest for probing molecular beacons associated with tumor proliferation, growth, and metastasis.1, 2, 3, 4, 5, 6, 7, 8, 9, 10, 11, 12, 13, 14 FDOT has been successfully demonstrated for imaging tissue phantoms,2, 5, 12, 13 molecular probes in small animals,6, 8, 10, 11 and exogenous contrast agents in human brain7 and breast.9 However, it has been a technical challenge for FDOT to localize deeply seated tumors and to accurately reconstruct low fluorophore concentrations because of the intense light scattering and strong background fluorescence in biological tissue.12, 13, 15, 16 Several techniques have been developed to localize deeply seated fluorophores by using guidance from other imaging modalities such as diffuse optical tomography13, 16, 17, 18 and magnetic resonance imaging (MRI)19 to improve target localization and fluorophore quantification. Unlike multimodality imaging approaches, we have introduced an optical-only imaging reconstruction method that separately estimates the target structural parameters such as target center (depth and spatial and locations) and size, and also reconstructs the functional properties such as fluorophore concentration. The principle of the technique is that the amplitude ratio and phase difference of measured fluorescence signals excited by a single source and received by any two detectors are found to be independent of, or weakly dependent on, fluorophore concentration and lifetime.20 Therefore, the amplitude ratio and phase difference measured from multiple source-detector pairs can be used to estimate the target structural information. With the available target structural information, a dual-zone mesh technique, previously developed by our group for optical absorption and scattering imaging,21, 22, 23 can be employed to reconstruct fluorophore concentration. By separating the imaging procedure into two steps, both the structural and functional parameters can be accurately recovered.20 In this work, we extend the technique to image deeply seated intact animal tumors injected with vascular endothelial growth factor conjugated with the near-infrared dye cyanine 7 (VEGF/Cy7) and fluorescence phantoms of Cy7 with concentrations as low as . Our initial results demonstrate that it is feasible to use this technique for probing deeply seated small tumors in breast. In the current understanding of cancer progression mechanisms, tumors stimulate excessive development of their own vasculature through a process known as angiogenesis. Active angiogenesis within tumors has been shown to promote tumor progression and facilitate invasion and metastasis to distant sites. A major contributor to tumor angiogenesis is the overproduction of a signaling protein, vascular endothelial growth factor (VEGF), which enhances angiogenesis. VEGF itself is expressed in nearly all solid tumors arising from the breast,24 colon, ovary, and prostate, and thus is a potential target for tumor diagnosis and therapy. VEGF binds to, and is internalized by, receptor proteins (VEGFR) on the membranes of endothelial cells, triggering growth of new vessels to meet increasing metabolic demands. VEGF conjugates with different organic dyes, and radionuclides have been studied by different groups for imaging and monitoring of tumor treatment.25, 26, 27, 28, 29, 30 Our study is motivated by the potential for noninvasive breast imaging of molecular VEGF markers for early breast cancer detection using a novel scVEGF/Cy tracer, a single-chain (sc) VEGF26 site-specific derivative conjugated with Cy5.5 near-infrared fluorescent dye. 2.Materials and Methods2.1.Imaging SystemWe have constructed a frequency-domain system to study the fluorescence properties of VEGF/Cy7. The excitation source consists of a pigtailed laser diode (Thorlabs Incorporated, Newton, New Jersey) sequentially delivered to nine multimode fibers distributed on a hand-held probe (see Fig. 1 ) using a optical switch (Piezosystem, Jena, Germany). The optical probe surface was painted black to make an absorption boundary with an effective reflection coefficient approximately equal to zero.31 The laser output at the optical probe was . 14 fiber bundles (Fiber Instrument Sales Incorporated, Oriskany, New York), each in diameter and distributed throughout the probe, sequentially collected the fluorescence and excitation light with an optical bandpass filter placed in and out of the light path, respectively. A shared detection assembly sampled received photons at each fiber bundle location. The assembly consisted of a sealed photomultiplier tube (model number R928, Hamamatsu, Bridgewater, New Jersey) plus associated optics that was linearly translated across the array of fiber bundle tips with a stepper motor (Applied Motion Products, Watsonville, California). Details of the assembly, denoted at the collimation system and filter (CSF) in Fig. 1, are shown in Fig. 2 . The experimental time for collection of one set of data from nine source locations and 14 detection locations was approximately . A sketch of the optical probe is shown in Fig. 2, where the smaller filled circles are sources and the larger filled circles are the fiber bundle detectors. Only source-detector pairs with separations greater than were used for the image reconstruction process, enabling use of a diffusion approximation model. Fig. 1Diagram of the frequency-domain system with optical probe and arrangements for imaging experiments. Legend: OS is oscillator; LD is laser diode; LO is local oscillator; BP is bandpass; Pre-amp is preamplifier; Amp is amplifier; CSF is collimation system and filter; PMT is photomultiplier tube; and PC is personal computer. Measurement and reference signals are collected by the computer, and the optical switches are controlled by the same computer. Four laser diodes were in the system, but only one was used for the reported experiments. 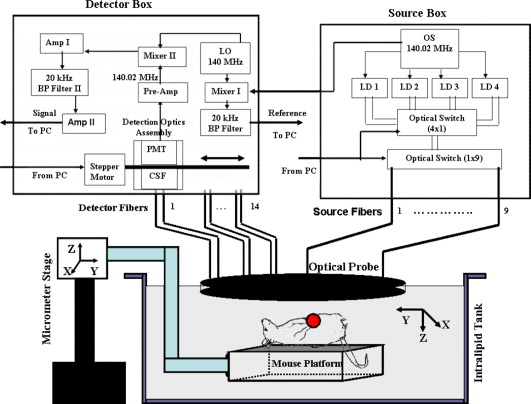 To maximize sensitivity and imaging depth, the design of the detection optics must ensure that the residual excitation and stray light produce responses that are at or below the system electronic and detector noise floors. Different optical designs have been reported to achieve high signal-to-noise ratios.32, 33, 34 Hwang 32 reviewed approaches for efficient collection of fluorescence signals in phantom and animal studies. Several optical filter designs were employed to achieve high optical densities for collection of weak fluorescent signals. Our system employed several measures to achieve rejection of nonfluorescent signals in excess of . First, the photomultiplier tube (PMT) aperture was restricted to match the incident focused light beam, and all detection optics were mounted in black lens tubes (Thorlabs Incorporated, Newton, New Jersey) encased within a light-sealed flat-black enclosure with the fiber bundles. Second, for fluorescence measurements, a dual-stage interference filter integrated on a single substrate (model number HQ800/60 M, Chroma Technologies, Rockingham, Vermont) removed excitation and stray light. The broadband filter was designed for greater than isolation at 690 wavelength (spectrophotometer-limited measurement of better than ), and all other optics were antireflection-coated to prevent spurious reflections that could affect the rejection efficiency. Strict control of the collimation of the incident light on the excitation filters to within is critical for rejection performance. Because the large detector fiber bundles used to improve light collection efficiency increase beam divergence, near-infrared achromatic lenses with long focal lengths of 30 and (AC254-035-B and AC254-030-B, Thorlabs, Newton, New Jersey) were used to achieve the required degree of collimation. The effectiveness of the optical rejection was verified by temporary addition of an absorptive filter that did not change the noise floor of the system over the full range of PMT bias voltages. The combination of high collection efficiency fiber bundles and low-loss, high-rejection optics enabled high sensitivity detection of sub- fluorescent targets to depths of two centimeters. 2.2.Phantom PreparationPhantom studies were performed to validate our approach. In these experiments, a 0.6% Intralipid solution (Fresenius Kabi, Uppsala, Sweden) infused with of Cy7 fluorescent dye (GE Healthcare, Waukesha, Wisconsin) was used to emulate a semi-infinite turbid background medium. The background medium yielded calibrated optical properties of absorption coefficient and reduced scattering coefficient at the excitation wavelength , and and at the emission wavelength (see Table 1 ). Calibration of source strengths and detector gains as well as the Intralipid optical properties was performed by using a least-squares fitting procedure.21 Briefly, in this calibration the excitation power of different source positions, gains of different detector positions, and the slopes of amplitude and phase measurements versus source-detector separations were estimated by fitting the measured data using a semi-infinite diffusion model with an absorption boundary condition.21 The background absorption and reduced scattering coefficients were readily obtained from the estimated slopes of amplitude and phase measurements. Table 1Optical properties of background 0.6 % Intralipid and Cy7 dye. The absorption coefficient is μa , μs′ is the reduced scattering coefficient, and ε is the extinction coefficient. Maximum extinction coefficient of Cy7 in water is 0.20cm−1μM−1 at 747nm .
The spectral dependence of the Cy7 extinction coefficient was measured by an 8453 UV-visible diode array spectrometer (Hewlett-Packard, Waldbronn, Germany) and values are listed in Table 1. The targets consisted of transparent cylindrical glass tubes of diameter and height (volume, , ) filled with 0.6% Intralipid and Cy7 concentrations of . The tubes were submerged one by one in the Intralipid background solution as depicted in Fig. 1. An adjustable micrometer stage was used to control the depth of the target. For phantoms and tumors, the center location of the target was aligned with the center of the probe, which was also the position of the central source of the probe shown in Fig. 2. The lateral alignment was performed by adjusting the target position to intercept the laser output from the central source position while viewing the target with a hand-held mirror held at to the probe prior to Intralipid submersion. The spot size of the laser beam was at the measured target depths. Through this process, the depth of the target was precisely controlled and the and positions were controlled to within as determined by the divergence of the beam at the measured depths. Our dual-zone mesh imaging algorithm, used for accurately reconstructing fluorophore concentration, is discussed in Sec. 3.2. 2.3.Mouse TumorsSCID/Ncr (Balb/c background) mice were injected with 5 million MDA231luc cells26 at the mammary fat pad, and tumors grew to approximately size in a few weeks. Tumor-bearing mice were injected intravenously via the retro-orbital sinus with scVEGF/Cy7 conjugate (injection dose is listed in Table 2 ), which was allowed to circulate for one hour prior to sacrificing for imaging experiments. The scVEGF/Cy7, characterized by a fluorescence peak at , was prepared by conjugating the derivative of a single-chain (sc) VEGF with Cy7 as described for scVEGF/Cy5.5 in Ref. 26. Animal protocol was approved by the Institutional Animal Care and Use Committee of University of Connecticut. During the experiment, the euthanized mouse was placed on a thin glass plate, head-to-tail along the axis, with the mammary fat pad facing the imaging probe, as shown in Fig. 1. The mouse and the plate were submerged in the intralipid and imaged using the same procedures as in the phantom experiments. Table 2Concentrations of scVEGF/Cy-7 injected into two mice.
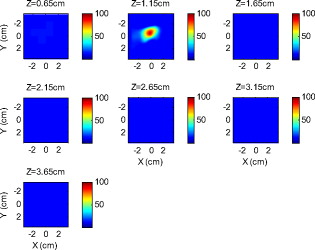
Because of the requirement for a matching medium for diffuse optical imaging and the slower data acquisition speed of our system, the mice were euthanized before imaging to avoid unnecessary pressure to live animals. Backer 26 reported that the near-infrared fluorescence images persist for several hours after scVEGF/Cy injection and remain nearly constant for at least . This is because the Cy5.5 dye remains inside the cell long after the protein is digested. scVEGF-based tracers are internalized by endothelial cells via VEGFR-2 (vascular endothelial growth factor receptor-2)-mediated endocytosis.26 Because of internalization, Cy5.5 fluorescence can be detected in tumor cryosections and in harvested tumors.26 Thus our fluorescence measurements made immediately after euthanization should closely represent what would be anticipated under in-vivo conditions. 3.Theoretical Analysis3.1.Structural Parameters EstimationEarlier, we demonstrated a novel technique for simultaneous estimation of target structural parameters and image reconstruction of fluorophore concentration.20 A brief description of the theory is given here for the sake of completeness. The fluorescence fluence excited by a point source located at and detected by a point-like detector located at can be expressed as35: where is a spatial variable and represents the target region where the fluorophore is located. is the source strength, and is the diffusion coefficient. Subscripts “ex” and “fl” indicate that the variables are measured at the excitation and emission wavelengths, respectively. The quantities , , and are the quantum yield, lifetime, and extinction coefficient of the fluorophore, respectively. is the appropriate Green’s function, is the modulation frequency, and is the fluorophore concentration. Note that in our imaging setup, the diameter of the source fibers was and the diameter of the detection fibers was . Only source and detector pairs that were separated by at least were used for structural parameter calculations and image reconstruction. Therefore, the point-like source and detector assumption used in analysis is a valid approximation for our experiments.The ratio of the fluorescence fluences excited by a source at and detected by two detectors at and can be obtained as: From Eq. 2 we can see that the only difference between the numerator and the denominator is the term , which depends on the positions of the two different detectors and position of the target. This observation was validated by simulations and phantom experiments as reported in Ref. 20. For convenience, we define two variables to describe the ratio of the fluorescence fluences: the amplitude of the ratio and the phase of the ratio , which can be written as: Both parameters are functions of the target depth and size.35 For the low contrast targets, the weak fluorescence signal from the target is embedded with the background signals. Difficulties have been faced to extract the useful target structural parameters from the total fluorescence signal, which is the summation of the background and target fluorescence signals. In our data processing for phantoms, the measured background signal was subtracted from the total signal, and the real and imaginary parts of the subtracted signal were used for amplitude and phase calculation. For the mouse experiments where background signal subtraction was not feasible, we used longer separated source-detector pairs (nearly ) as per the observations in Ref. 20. After the background signals were subtracted from the target signal and/or the closer source-detector pair contributions were removed, the amplitude and phase were calculated for each measurement. The phase for a measurement is given by A small constant number of about 0.003 was added to the denominator (real part of fluorescence fluency) of Eq. 5 to improve the robustness of phase calculation in the presence of noise. This empirical approach is often used in signal processing to condition the weak signals, and it is very similar in concept to a regulation approach for conditioning an ill-conditioned matrix by adding a small empirical number to the diagonal of the matrix. The new equation for phase is given as: After the amplitudes and phases were calculated for each source-detector pair, the ratios of amplitudes and phases for all pairs of measurements were taken for structural parameter calculations. Using an extrapolated boundary condition with a semi-infinite geometry, the amplitude and phase of the fluorescence photon density wave for a known target at any position can be generated analytically.31 Therefore, the amplitude ratio and phase difference at any two positions can be calculated.35, 36 When multiple sources and detectors are present, different combinations of any two detectors for a given source can be selected to obtain the ratios of fluorescence fluences. Because our optical probe consists of nine sources and 14 detectors, for each source a total of 91 phase differences and 91 amplitude ratios can be obtained. Thus a total of 1638 measurements can be taken to determine the structural parameters, which is an overdetermined problem because we have a total of 252 ( : 126 amplitudes and 126 phases) measurements. Multiple ratios, analytically obtained, from a known target with known fluorophore concentration and known target structural parameters (location and size) were fitted to the multiple ratios of the measured experimental data from a target with unknown structural parameters (location and size). A chi-square fitting technique was used to calculate the error between the analytically generated data and the experimentally measured data. The simplex downhill optimization36, 37 method was used for error minimization by varying the unknown target structural parameters. The final target structural parameters were obtained when the algorithm converged with error less than a certain limit. 3.2.Functional Parameter and Image ReconstructionTo reconstruct absorption and/or fluorescence images, a normalized Born approximation has been widely used.2, 38, 39 This normalization eliminates unknown system parameters, i.e., source strengths, gains of different detectors, background optical properties of the tissue, coupling efficiency to the tissue, etc. In our earlier paper,20 we normalized the target fluorescence measurement with the background fluorescence data for image reconstruction. This normalization method works well only for targets embedded in a homogeneous medium of high target-to-background contrast. For targets embedded in both homogeneous and heterogeneous media, normalization of the fluorescence measurement with the excitation data has been shown to work well,38, 39 because this procedure minimizes the background scattering and absorption, and reconstructs the intrinsic fluorophore concentration of the target. This normalized Born ratio is adopted in this study and is given as: where is the normalized Born ratio, is the fluorescence measurement at after subtraction of the system noise measurement without any fluorophores or targets in the background medium, and is the excitation measurement at .For inversion, a dual-zone mesh method was used to reconstruct the fluorophore concentrations. Because the target center is available from the structural parameters, we divide the imaging region into two parts, the background (B) and target (L) region.20 We then discretized the target region of imaging volume into a finer grid , and the background region of volume into a coarser grid . Equation 7 can be expressed as a matrix equation when multiple measurements are available: where is the normalized Born ratio and corresponds to the value on the left-hand side of Eq. 7. and are the weight matrices for the target region and background region, respectively. has dimension of and has dimension of . is the total number of measurements. and are the total number of voxels in the target region and the background region, respectively . and are the vector representations of the distribution of total fluorophore concentrations in the target and background regions, respectively. By using this dual-zone mesh, the total number of voxels with unknown concentration can be comparable to the total number of measurements, so that the inverse problem is less underdetermined. Only three iterations were needed for reconstruction to converge to a stable solution. In addition, because the target fluorophore concentration is generally higher than that of the background, the total fluorophore quantity in the target over a smaller voxel is similar to that of the background in a larger voxel, so that Eq. 8 is appropriately scaled for inversion. The distribution of fluorophore concentrations in target and background regions was recovered at the end by dividing the total fluorophore quantity by the appropriate voxel sizes. Because the voxel size of the coarse mesh is 100 times larger than that of the fine mesh, background artifacts are suppressed. Thus the dual-zone mesh approach significantly improves the fluorophore quantification and target-to-background contrast. The total least-squares method and the conjugate gradient technique were used to iteratively solve Eq. 8.20, 21, 22, 23Depth ( -axis) estimations of the target position were found to be accurate to within 10%. The estimates of and coordinates, however, had larger errors that increased with the depth of the target. The typical deviations of the and positions from the expected positions were in both directions with experimental uncertainty due to the laser beam size at the measured depths (Sec. 2.2). In our calculations, the targets were assumed to be spherical targets and the radii of the reconstructed targets ranged from 10 to 50% of the true target size.20 The errors in the location estimations were lower for cylindrical Cy7 tube phantoms and higher for mouse tumors. Because of the - and -location uncertainties of up to , the fine-mesh target volume in the reconstructions was fixed to . Our dual-zone mesh method is robust to structure estimation errors in and dimensions but sensitive to depth.22, 23, 40 If a target was reconstructed at an inaccurate depth, the fluorophore concentration would be either under-reconstructed or over-reconstructed. Because the structural estimation algorithm introduced in Ref. 20 and validated in this work is accurate in estimating depth, the approach provides sufficient accuracy for use with the dual-zone mesh method for imaging reconstruction. 4.Results4.1.Phantom StudiesAn example of a fluorescence image of a Cy7 target of diameter and height in a Cy7 background and 0.6% Intralipid medium is shown in Fig. 3 . The Born normalization we used here eliminates the unknown-background optical properties, so the particular background medium does not affect the image reconstruction. From the structural parameter calculation, it was found that the target was located at depth ( axis). Because the target size estimate was not accurate (an error of 25% in this particular case) image reconstruction was performed over the entire volume with a finer mesh at depth and a coarse mesh at all other depths. In Fig. 3, the first depth slice is reconstructed at from the probe surface and the last slice is at . The spatial dimensions of each slice are , corresponding to the probe size used. The thickness of each slice corresponds to in depth. The fluorescence image appeared at the third slice of the fine mesh region . The percentage of the true target fluorophore concentration reconstructed at depth is 86% . Fig. 3Reconstructed fluorescence image of a Cy7 target in background at reconstructed depth. The first slice is reconstructed at depth and the last one is at . The increment in each slice is in depth.  To quantify our approach, one set of experiments was performed for targets with fluorophore concentrations of at different depths . The target depth was controlled by a micrometer stage, as explained earlier. We estimated the target depth from the chi-square fitting technique as shown in Fig. 4 , and the estimated depth was used for fluorescence image reconstruction. The axis shows the experimental depth measured from the micrometer stage, and the axis shows the depths estimated from fitting. The results demonstrate that the techniques are able to reconstruct target depths with concentrations as low as for depths up to , and at depths up to . Each measurement at a particular depth for a given target was repeated three times, and the parameters were reconstructed for all the measurements. The reconstructed depths in Fig. 4 are the means of the three measurements with the standard deviations shown as error bars. Fig. 4The reconstructed depth using the optical estimation algorithm plotted against the experimentally measured depth for different concentrations of targets at several depths.  The fluorescence images were reconstructed at the estimated depths obtained from chi-square fitting (from Fig. 4). Figure 5 shows the fluorophore concentrations reconstructed at different depths (from Fig. 4) for various target concentrations. The data clearly shows that the techniques were able to reconstruct the concentration of fluorescence targets located at depths up to for concentrations as low as . Although we could not reconstruct the target depth for the target at , we were able to reconstruct the fluorescence image at the expected experimental depth, and the reconstructed fluorophore concentration was (64%). As shown in Fig. 5, the images at depth are over-reconstructed, and the fluorophore concentration reconstruction decreases with increasing target depth. The maximum difference in reconstructed fluorophore concentrations across different depths for a given target is within . Fig. 5The concentrations of fluorophores reconstructed at reconstructed depths for the cases shown in Fig. 4.  To compare the effect of different background media on image reconstruction, one experiment was done with the same cylindrical tube filled with Cy7, prepared similarly as mentioned in Sec. 2.2, inserted in chicken breast. The size of the chicken breast was bigger than that of our optical probe, and the probe was in direct contact with it without any matching fluid. The chicken breast had calibrated optical properties of absorption coefficient and reduced scattering coefficient at the excitation wavelength , and and at the emission wavelength . From the structural parameter calculations, the target depth was estimated to be , and the fluorescence concentration reconstructed at this depth was (shown in Fig. 6 ). In comparison to the Cy7 images in Intralipid background, the background media (Intralipid or chicken breast) did not affect fluorescence image reconstruction. 4.2.Imaging with scVEGF/Cy7 TracerTo demonstrate the capability of our approach to image deeply seated tumors in realistic samples, tumor-bearing mice were injected with of either or solution of scVEGF/Cy7 (as shown in Table 2). The molecular specificity of this conjugate, which binds to and is internalized by VEGF receptors expressed in high number on endothelial cells in angiogenic vasculature, facilitates the visualization of tumor angiogenesis. Mice were sacrificed one hour postinjection, placed in Intralipid solution, and imaged. The mice were positioned as shown in Fig. 1. Figure 7 shows the depth estimation for the mouse tumors translated to different depths from the optical probe by the micrometer stage. We could reliably estimate the tumor depth up to from the probe surface. For comparison, depth estimates in the phantom experiments were reliable to depths of for Cy7 tubes and to for Cy7 tubes. The fluorescence images were reconstructed at the estimated depths and shown in Figs. 8 and 9 for mouse 1 and 2, respectively, where the color bar is in nanomolar scale. Although the structural parameters were not accurately reconstructed at , we were still able to reconstruct the fluorophore concentration at the expected experimental depth, similar to the case for the Cy7 tube at depth in the phantom experiments. The fluorophore concentration reconstructed at was much lower than that reconstructed at other depths. The maximum fluorophore concentrations in tumors reconstructed at different depths are listed in Table 3 , with the average values computed within the full width at half maximum (FWHM) given in parentheses. These concentrations are comparable to estimates based on tumor uptake of radio-labeled scVEGF-based probes.26 Typical uptake for such tracers in the tumors is to 3% of the injected dose. Injection of of either or solution of scVEGF/Cy7 should therefore lead to accumulation of of tracer in tumors. For a tumor about in diameter, this would correspond to a concentration in the range, which is close to the range of reconstructed values shown in Table 3. Fig. 7Plot of the reconstructed depths for the tumors in two mice versus experimentally measured depths.  Fig. 8Reconstructed fluorescence images of tumor marked with VEGF/Cy7 conjugate in mouse 1 at different reconstructed depths: (a) , (b) , (c) , and (d) . The rest of the slices in each figure correspond to coarse mesh in the background region. The depth is shown in the title of each subimage.  Fig. 9Reconstructed fluorescence images of tumor marked with VEGF/Cy7 conjugate for mouse 2 at different reconstructed depths: (a) , (b) , (c) , and (d) . The rest of the slices in each figure correspond to coarse mesh in the background region. The depth is shown in the title of each subimage.  Table 3Maximum fluorophore concentrations reconstructed at different depths from mouse tumors; average values at FWHM are shown in the parentheses.
By examining the images obtained from mice, we can see that the background artifact level was higher in the first two layers when the target was located in a deeper range as shown in Figs. 8 and 9. Because the fluorescence signals generated from a deeper target were much weaker than that from a shallower target, the signal-to-background fluorescence ratio was lower in the former case, which resulted in a higher background artifact level in reconstructed images. 5.Discussions and SummaryThe refined all-optical technique, demonstrated through both phantom and small animal experiments, represents a robust method for reconstructing both structural (target depth) and functional parameters. Several factors contribute to the improved accuracy compared to our earlier results. First, the structural parameters are reconstructed after subtracting the background fluorescence signals from the target fluorescence signal. Because we use both the amplitudes and phases from multiple measurements for chi-square fitting, adding a fixed small constant number to the real part of the fluorescence fluence helps condition the fitting for weak fluorescence signals and increases accuracy for structural parameter estimation. Second, the use of excitation signal normalization rather than the original fluorescent background signal results in more reliable and accurate reconstruction, both qualitatively and quantitatively, when combined with the depth-guided dual-zone mesh algorithm. These improvements enable a two to three-fold reduction in the minimum fluorophore concentration to or lower for depths up to . This set of imaging conditions is relevant for clinical applications, and thus the technology has a great potential for molecular imaging of angiogenesis markers for early breast cancer detection. For the phantoms, where the concentrations and quantum yields of the targets are known beforehand, we can calculate the percentage of reconstruction of absolute fluorophore concentration, as shown in Fig. 5. We do not observe a major difference in fluorophore concentration reconstruction when the Cy7-filled tube is embedded in either an Intralipid medium or in chicken breast. For the mice, since Cy7 is the only fluorophore to emit in the wavelength range we study and the quantum yields of Cy7 and Cy7 conjugates are similar,25, 26 we assume the quantum yields are similar both in phantom and mouse tumors. There might be small local variations in quantum yield to affect the reconstruction accuracy, because of the microenvironment of the tumor tissue that causes nonuniform quantum yield distribution. The studies presented here indicate that there is a good correlation between the capabilities for phantom and mouse imaging in terms of fluorophore concentration levels and target depth limits, even though the absolute information for the mice is not known. The proposed method for recovering structural information is independent of, or weakly dependent on, the fluorophore concentration, but dependent on the target size and location. However, there is a lower limit of fluorophore concentration below which the signal strength is weak and we cannot recover the structural parameters. The structural parameters we aim to recover are the locations ( , , and depths) of the targets and the size of the targets. The depth of the target is recovered more accurately than the other parameters. For our phantom studies, we cannot image less than fluorophore concentrations at depths up to . For both mouse tumors and Cy7 tubes, we cannot estimate target depths at . Because the target size is not estimated accurately, we use a much larger fine mesh size in and dimensions than the target for reconstructing fluorophore concentrations. We also assume the target size in the direction is about or less than , so that only one fine-mesh layer centered at the estimated depth is used with all other layers in depth reconstructed using a coarse mesh size. As a result, the reported results are only pertinent to imaging small fluorescence targets of or less. Further improvements of the technology are possible. Because spatial coordinates of the target as well as the size estimate are not reliable, a larger estimated fine mesh region is used to account for this uncertainty. In contrast, the depth estimation is a very reliable parameter. From our experience of ultrasound-guided diffused wave imaging of human breasts,21, 22, 23, 40 the target depth is the most important parameter for accurate lesion quantification. With the addition of an ultrasound transducer located in the central region, we can obtain target shape as well as its spatial location. The tradeoff is the loss of sensitivity, especially for low contrast fluorescent targets, due to missing sources and detectors in the central region of the probe. Extensive simulations and phantom experiments show that a smaller ultrasound transducer of diameter would not cause a significant degradation in FDOT imaging quality. We are planning to develop a hand-held probe with a smaller ultrasound transducer located at the central region of the probe for providing additional information on target shape and and positions. With both normal and oblique angle of incidence excitation sources surrounding the ultrasound transducer, light delivery to the central region can be further improved. The advantage of this reported optical-only technology is that the depth estimation does not depend on ultrasound and thus should correlate reliably with the actual fluorophore distributions. The ultrasound may provide better estimates of the size and location than the optical approach. The fluorophore quantification for lesion may therefore be more accurate with the combined method than the pure ultrasound guided approach. AcknowledgmentsWe acknowledge the funding support of the DOD Breast Cancer Research Program (W81XWH-04-1-0415), and National Institutes of Health (R01EB002136) and 2R44CA113080 to Backer. ReferencesD. J. Hawrysz and
E. M. Sevick-Muraca,
“Developments toward diagnostic breast cancer imaging using near-infrared optical measurements and fluorescent contrast agents,”
Neoplasia, 2
(5), 388
–417
(2000). https://doi.org/10.1038/sj.neo.7900118 1522-8002 Google Scholar
V. Ntziachristos and
R. Weissleder,
“Experimental three-dimensional fluorescence reconstruction of diffuse media by use of a normalized Born approximation,”
Opt. Lett., 26 893
–895
(2001). https://doi.org/10.1364/OL.26.000893 0146-9592 Google Scholar
R. Cubeddu,
D. Comelli,
C. D. Andrea,
P. Taroni, and
G. Valentini,
“Time-resolved fluorescence imaging in biology and medicine,”
J. Phys. D, 35 R61
–R76
(2002). https://doi.org/10.1088/0022-3727/35/9/201 0022-3727 Google Scholar
E. E. Graves,
J. Ripoll,
R. Weissleder, and
V. Ntziachristos,
“A submillimeter resolution fluorescence imaging system for small animal imaging,”
Med. Phys., 30
(5), 901
–911
(2003). https://doi.org/10.1118/1.1568977 0094-2405 Google Scholar
A. Godavarty,
A. B. Thompson,
R. Roy,
M. Gurfinkel,
M. J. Eppstein,
C. Zhang, and
E. M. Sevick-Muraca,
“Diagnostic imaging of breast cancer using fluorescence-enhanced optical tomography: Phantom studies,”
J. Biomed. Opt., 9
(3), 488
–496
(2004). https://doi.org/10.1117/1.1691027 1083-3668 Google Scholar
V. Ntziachristos,
E. A. Schellenberger,
J. Ripoll,
D. Yessayan,
E. Graves,
A. Bogdanov,
L. Josephson, and
R. Weissleder,
“Visualization of antitumor treatment by means of fluorescence molecular tomography with an annexin V-Cy5.5 conjugate,”
Proc. Natl. Acad. Sci. U.S.A., 101
(33), 12294
–12299
(2004). https://doi.org/10.1073/pnas.0401137101 0027-8424 Google Scholar
J. A. N. Fisher,
E. F. Civillico,
D. Contreras, and
A. G. Yodh,
“In vivo fluorescence microscopy of neuronal activity in three dimensions by use of voltage-sensitive dyes,”
Opt. Lett., 29 71
–73
(2004). https://doi.org/10.1364/OL.29.000071 0146-9592 Google Scholar
S. V. Patwardhan,
S. Bloch,
S. Achilefu, and
J. Culver,
“Time-dependent whole-body fluorescence tomography of probe bio-distributions in mice,”
Opt. Express, 13
(7), 2564
–2577
(2005). https://doi.org/10.1364/OPEX.13.002564 1094-4087 Google Scholar
A. Corlu,
R. Choe,
T. Durduran,
M. A. Rosen,
M. Shweiger,
S. R. Arridge,
M. D. Schnall, and
A. J. Yodh,
“Three-dimensional in vivo fluorescence diffuse optical tomography of breast cancer in humans,”
Opt. Express, 15
(11), 6696
–6716
(2007). https://doi.org/10.1364/OE.15.006696 1094-4087 Google Scholar
L. Herve,
A. Koenig,
A. Da Silva,
M. Berger,
J. Boutet,
J. M. Dinten,
P. Peltie, and
P. Rizo,
“Noncontact fluorescence diffuse optical tomography of heterogeneous media,”
Appl. Opt., 46
(22), 4896
–4906
(2007). https://doi.org/10.1364/AO.46.004896 0003-6935 Google Scholar
A. T. Kumar,
S. B. Raymond,
A. K. Dunn,
B. J. Bacskai, and
D. A. Boas,
“A time domain fluorescence tomography system for small animal imaging,”
IEEE Trans. Med. Imaging, 27
(8), 1152
–1163
(2008). https://doi.org/10.1109/TMI.2008.918341 0278-0062 Google Scholar
J. Ge,
B. Zhu,
S. Regalado, and
A. Godavarty,
“Three-dimensional fluorescence-enhanced optical tomography using a hand-held probe based imaging system,”
Med. Phys., 35
(7), 3354
–3363
(2008). https://doi.org/10.1118/1.2940603 0094-2405 Google Scholar
Y. Tan and
H. Jiang,
“Diffuse optical tomography guided quantitative fluorescence molecular tomography,”
Appl. Opt., 47
(12), 2011
–2016
(2008). https://doi.org/10.1364/AO.47.002011 0003-6935 Google Scholar
E. M. Sevick-Muraca and
J. C. Rasmussen,
“Molecular imaging with optics: primer and case for near-infrared fluorescence techniques in personalized medicine,”
J. Biomed. Opt., 13
(4), 041303
(2008). https://doi.org/10.1117/1.2953185 1083-3668 Google Scholar
A. Joshi,
W. Bangerth,
K. Hwang,
J. Rasmussen, and
E. M. Sevick-Muraca,
“Plane-wave fluorescence tomography with adaptive finite elements,”
Opt. Lett., 31
(2), 193
–195
(2006). https://doi.org/10.1364/OL.31.000193 0146-9592 Google Scholar
P. Mohajerani,
A. A. Eftekhar, and
A. Adibi,
“Object localization in the presence of a strong heterogeneous background in fluorescent tomography,”
J. Opt. Soc. Am. A, 25
(6), 1467
–1479
(2008). https://doi.org/10.1364/JOSAA.25.001467 0740-3232 Google Scholar
D. S. Kepshire,
S. C. Davis,
H. Dehghani,
K. D. Paulsen, and
B. Pogue,
“Subsurface diffuse optical tomography can localize absorber and fluorescent objects but recovered image sensitivity is nonlinear with depth,”
Appl. Opt., 46
(10), 1669
–1678
(2007). https://doi.org/10.1364/AO.46.001669 0003-6935 Google Scholar
Y. Lin,
H. Gao,
O. Nalcioglu, and
G. Gulsen,
“Fluorescence diffuse optical tomography with functional and anatomical a priori information: feasibility study,”
Phys. Med. Biol., 52
(18), 5569
–5585
(2007). https://doi.org/10.1088/0031-9155/52/18/007 0031-9155 Google Scholar
S. C. Davis,
B. W. Pogue,
R. Springett,
C. Leussler,
P. Mazurkewitz,
S. B. Tuttle,
S. L. Gibbs-Strauss,
S. S. Jiang,
H. Dehghani, and
K. D. Paulsen,
“Magnetic resonance-coupled fluorescence tomography scanner for molecular imaging of tissue,”
Rev. Sci. Instrum., 79
(6), 064302
(2008). https://doi.org/10.1063/1.2919131 0034-6748 Google Scholar
B. Yuan and
Q. Zhu,
“Separately reconstructing the structural and functional parameters of a fluorescent inclusion embedded in a turbid medium,”
Opt. Express, 14
(16), 7172
–7187
(2006). https://doi.org/10.1364/OE.14.007172 1094-4087 Google Scholar
N. Chen,
P. Guo,
S. Yan,
D. Piao, and
Q. Zhu,
“Simultaneous near infrared diffusive light and ultrasound imaging,”
Appl. Opt., 40 6367
–6380
(2001). https://doi.org/10.1364/AO.40.006367 0003-6935 Google Scholar
Q. Zhu,
N. G. Chen, and
S. Kurtzman,
“Imaging tumor angiogenesis using combined near infrared diffusive light and ultrasound,”
Opt. Lett., 28 337
–339
(2003). https://doi.org/10.1364/OL.28.000337 0146-9592 Google Scholar
Q. Zhu,
Q. E. Cronin,
A. Currier,
H. S. Vine,
M. M. Huang,
N. G. Chen, and
C. Xu,
“Benign versus malignant breast masses: optical differentiation using US to guide optical imaging reconstruction,”
Radiology, 237 57
–66
(2005). https://doi.org/10.1148/radiol.2371041236 0033-8419 Google Scholar
J. Adams,
P. J. Carder,
S. Downey,
M. A. Forbes,
K. MacLennan,
V. Allgar,
S. Kaufman,
S. Hallam,
R. Bicknell,
J. J. Walker,
F. Cairnduff,
P. J. Selby,
T. J. Perren,
M. Lansdown, and
R. E. Banks,
“Vascular endothelial growth factor (VEGF) in breast cancer: comparison of plasma, serum, and tissue VEGF and microvessel density and effect of Tamoxifen,”
Cancer Res., 60 2898
–2905
(2000). 0008-5472 Google Scholar
Y. Wu,
W. Cai, and
X. Chen,
“Near-infrared fluorescence imaging of tumor integrin expression with Cy7-labeled RGD multimers,”
Mol. Imaging Biol., 8 226
–236
(2006). https://doi.org/10.1007/s11307-006-0041-8 1536-1632 Google Scholar
M. V. Baker,
Z. Levashova,
V. Patel,
B. T. Jehning,
K. Claffey,
F. Blankenberg, and
J. M. Backer,
“Molecular Imaging of VEGF receptors in angiogenic vasculature with single-chain VEGF based probes,”
Nat. Med., 13
(4), 504
–509
(2007). https://doi.org/10.1038/nm1522 1078-8956 Google Scholar
X. Montent,
J. L. Figueiredo,
H. Alencar,
V. Ntziachristos,
U. Mahmood, and
R. Weissleder,
“Tomographic fluorescence imaging of tumor vasculature volume in mice,”
Radiology, 242
(3), 751
–758
(2007). https://doi.org/10.1148/radiol.2423052065 0033-8419 Google Scholar
W. Cai,
K. Chen,
Z. B. Li,
S. S. Gambhir, and
X. Chen,
“Dual-function probe for PET and near-infrared fluorescence imaging of tumor vasculature,”
J. Nucl. Med., 48
(11), 1862
–1870
(2007). https://doi.org/10.2967/jnumed.107.043216 0161-5505 Google Scholar
K. Chen,
Z. B. Li,
H. Wang,
W. Cai, and
X. Chen,
“Dual-modality optical and positron emission tomography imaging of vascular endothelial growth factor receptor on tumor vasculature using quantum dots,”
Eur. J. Nucl. Med. Mol. Imaging, 35
(12), 2235
–2244
(2008). https://doi.org/10.1007/s00259-008-0860-8 1619-7070 Google Scholar
S. K. Chang,
I. Rizvi,
N. Solban, and
T. Hasan,
“In vivo optical molecular imaging of vascular endothelial growth factor for monitoring cancer treatment,”
Clin. Cancer Res., 14
(13), 4146
–1153
(2008). https://doi.org/10.1158/1078-0432.CCR-07-4536 1078-0432 Google Scholar
R. C. Haskell,
L. O. Svaasand,
T. Tsay,
T. Feng,
M. S. McAdams, and
B. J. Tromberg,
“Boundary conditions for the diffusion equation in radiative transfer,”
J. Opt. Soc. Am. A, 11
(10), 2727
–2741
(1994). https://doi.org/10.1364/JOSAA.11.002727 0740-3232 Google Scholar
K. Hwang,
J. P. Houston,
J. C. Rasmussen,
A. Joshi,
S. Ke,
C. Li, and
E. M. Sevick-Muraca,
“Improved excitation light rejection enhances small-animal fluorescent optical imaging,”
Mol. Imaging, 4
(3), 194
–204
(2005). 1535-3508 Google Scholar
K. Hwang,
T. Pan,
A. Joshi,
J. C. Rasmussen,
W. Bangerth, and
E. M. Sevick-Muraca,
“Influence of excitation light rejection on forward model mismatch in optical tomography,”
Phys. Med. Biol., 51 5889
–5902
(2006). https://doi.org/10.1088/0031-9155/51/22/011 0031-9155 Google Scholar
D. L. Vizard, and
W. E. Mclaughlin,
“Imaging system using combined dichroic/high-pass filters,”
(2006). Google Scholar
X. D. Li,
M. A. O’Leary,
D. A. Boas,
B. Chance, and
A. G. Yodh,
“Fluorescent diffuse photon density waves in homogeneous and heterogeneous turbid media: analytic solutions and applications,”
Appl. Opt., 35
(19), 3746
–3758
(1996). https://doi.org/10.1364/AO.35.003746 0003-6935 Google Scholar
X. D. Li,
B. Chance, and
A. G. Yodh,
“Fluorescent heterogeneities in turbid media: Limits for detection characterization, and comparison with absorption,”
Appl. Opt., 37
(28), 6833
–6944
(1998). https://doi.org/10.1364/AO.37.006833 0003-6935 Google Scholar
W. H. Press,
S. A. Teukolsky,
W. T. Vetterling, and
B. P. Flannery, Numerical Receipes in C, Cambridge Univ. Press, New York
(1992). Google Scholar
A. Soubret,
J. Ripoll, and
V. Ntziachristos,
“Accuracy of fluorescent tomography in the presence of heterogeneities: study of the normalized Born ratio,”
IEEE Trans. Image Process., 24
(10), 1377
–1386
(2005). 1057-7149 Google Scholar
R. B. Schulz,
J. Ripoll, and
V. Ntziachristos,
“Noncontact optical tomography of turbid media,”
Opt. Lett., 28
(18), 1701
–1703
(2003). https://doi.org/10.1364/OL.28.001701 0146-9592 Google Scholar
Q. Zhu,
C. Xu,
P. Y. Guo,
A. Aguirre,
B. Yuan,
F. Huang,
D. Castilo,
J. Gamelin,
S. Tannenbaum,
M. Kane,
P. Hedge, and
S. Kurtzman,
“Optimal probing of optical contrast of breast lesions of different size located at different depths by US localization,”
Technol. Cancer Res. Treat., 4 365
–380
(2006). 1533-0346 Google Scholar
|