|
|
1.IntroductionEndoscopic optical coherence tomography (OCT) utilizes low-coherence interferometry with broadband near-infrared (NIR) light sources to perform depth-resolved imaging of tissue architecture.1 Standard OCT has an axial resolution of and a transverse resolution of , while ultrahigh-resolution (UHR) endoscopic OCT systems have axial resolutions of .2, 3 Several studies demonstrated that endoscopic OCT can characterize in vivo normal mucosal tissues as well as pathologies such as Barrett’s esophagus and esophageal adenocarcinoma.4, 5, 6, 7, 8, 9 OCT was also investigated for the detection of high-grade dysplasia in Barrett’s esophagus,10, 11 with one report citing sensitivity and specificity of 85% and 75%, respectively.12 A major limitation of cross-sectional OCT imaging methods is the restricted transverse image resolution. This limits the ability to visualize cellular features, which is important for the detection of dysplasia and early gastrointestinal tract cancers. Laser scanning confocal microscopy generates en face images by scanning a laser beam through a high numerical aperture objective lens, achieving transverse resolutions of and axial resolutions of . High-speed reflectance confocal microscopy using near-infrared lasers was studied for in vivo cellular resolution imaging of human skin,13, 14 cervix,15 and oral mucosa.16 Several ex vivo studies investigated reflectance confocal microscopy in the gastrointestinal tract.17, 18, 19, 20 Results demonstrated the ability to visualize cellular features in the esophagus, and to detect differences in the nucleus-to-cytoplasm ratio between normal and cancerous tissues.18 In the colon, hallmark features of normal, hyperplastic, and adenomatous crypts were identified on confocal images.19 A preliminary report of endoscopic reflectance confocal microscopy has been published,19 but the method has yet to become widely available in endoscopy. Fluorescence confocal microscopy is becoming readily available for endoscopic imaging in the gastrointestinal tract. A confocal endomicroscope with transverse resolution of and axial resolution of was commercialized for gastrointestinal endoscopy.21 In this device, the confocal scanner was integrated into a clinical video endoscope. Outstanding cellular resolution images of normal mucosa were presented,21 and in vivo detection of neoplastic changes in colorectal mucosa were demonstrated with sensitivity of 97.4% and specificity of 99.4%.22 Detection of Barrett’s associated intraepithelial neoplasia with sensitivity and specificity of 92.9% and 98.4% respectively, was also reported.23 Fluorescence confocal endoscopy offers great promise but has limited image penetration depth compared to near-infrared reflectance confocal microscopy. In addition, fluorescence dyes can present toxicity and regulatory issues. A method capable of high-quality cellular imaging at greater depths than existing confocal methods and without the need for dyes would be an important advance. Optical coherence microscopy (OCM) combines confocal microscopy with OCT to achieve cellular resolution imaging in the en face plane. The combination of coherence and confocal detection enhances rejection of unwanted scattered light, thereby allowing improved imaging depth compared to confocal microscopy alone.24 In addition, OCM can image with lower numerical aperture than confocal microscopy, facilitating the development of miniaturized endoscopic probes.25 Limited studies with this method have been performed to date, largely due to the lack of advanced OCM imaging technology. Ex vivo investigations of human tissues include preliminary reports on normal colonic mucosa26 and normal and dysplastic oral mucosa.27 In vivo imaging was limited to an initial demonstration in human skin.25 The present study was designed to evaluate a new high-speed OCM method that can be applied in the future with miniaturized probe technologies for endoscopic imaging. The study was an ex vivo imaging survey of freshly excised gastrointestinal tissues. Images of normal and pathologic tissue specimens were correlated with histology in order to understand which features could be visualized on OCM. OCM images were also correlated to ultrahigh-resolution OCT to enable comparison between the two methods. The results provide a basis for interpretation of future in vivo OCM images in the gastrointestinal tract and will also aid in the interpretation of endoscopic OCT and OCM. 2.Methods2.1.Optical Coherence Microscopy Imaging SystemThis study used a portable OCM prototype system designed for high-speed imaging at . A detailed description of the system is described in Ref. 28. The light source was a compact Nd:Glass femtosecond laser that was spectrally broadened in a high numerical aperture optical fiber to a bandwidth of at . High-speed phase modulation with an electro-optic waveguide modulator produced a heterodyne frequency of , which enabled fast raster scan imaging. Using special techniques to compensate chromatic dispersion and wavelength-dependent source polarization, a coherence gated axial resolution of was achieved. This corresponds to optical image slices thinner than traditional histologic sections. En face imaging was performed using a confocal microscope with fast galvanometer scanners and a water immersion objective lens (Zeiss Achroplan 440095). The measured transverse resolution was , and the axial point spread function width was . Images were acquired at over a field of view of with . The detection sensitivity was with of incident power. The system used a custom autofocusing technique to ensure that the coherence gate position was matched to the confocal gate position in the OCM images. Automated image processing after acquisition consisted of digital demodulation, pixel resampling to remove scanner hysteresis and correct aspect ratio, mild spatial filtering with a triangular kernel, square-root compression of signal values, and contrast enhancement. Images are displayed on an inverse grayscale color map, where black represents increased reflectivity. An ultrahigh-resolution OCT system operating at was combined with the OCM system to perform co-registered OCT and OCM imaging. The OCT system was similar to that used in a previous in vitro imaging study.29 The OCT and OCM systems shared the same optics, except for the objective lens, which was turret mounted to allow rapid interchange between high and low magnifications. Cross-sectional images measuring transverse by deep were acquired with at . The OCT system had a transverse resolution and axial resolution. The OCT signal was demodulated and logarithmically compressed using an analog circuit before analog to digital conversion. Image processing after acquisition consisted of pixel resampling to the correct aspect ratio followed by contrast enhancement. Again, images are displayed on an inverse grayscale color map. The compact OCT and OCM systems were integrated into portable instrument carts and transported to the hospital for the imaging studies. 2.2.Study Design and Imaging ProtocolImaging was performed on freshly excised surgical specimens in the pathology laboratory at the Beth Israel Deaconess Medical Center and on freshly excised tissue acquired during upper and lower gastrointestinal endoscopy procedures at the endoscopy suite of the VA Boston Healthcare System. Imaging in the pathology laboratory has the advantage that it provides access to normal specimens, as well as larger and more intact specimens, compared with pinch biopsy samples obtained in the endoscopy suite. In contrast, biopsy imaging provided access to smaller, more diagnostically sensitive specimens that were not readily available in the pathology laboratory. Imaging protocols were approved by the institutional review boards at the Beth Israel Deaconess Medical Center, the Massachusetts Institute of Technology, Harvard Medical School, and the Boston VA Healthcare System. Fresh surgical specimens were selected based on the presence of pathology upon gross examination, prompt arrival to the pathology laboratory, and large specimen size, which allowed normal and pathologic tissues to be collected from each specimen without interfering with routine diagnostic procedures. The study used excess tissue from surgical specimens deemed unnecessary for diagnosis by supervising pathologists. Imaging was performed within of excision. Imaging studies in the endoscopy suite occurred as part of ongoing studies investigating endoscopic OCT. Subjects enrolled under the upper GI protocol were selected from those undergoing surveillance endoscopy and biopsy based upon a history of previously diagnosed Barrett’s esophagus, dysplasia, or adenocarcinoma. Subjects enrolled under the lower GI protocol were selected from those undergoing routine screening colonoscopy. Specimens consisted of biopsy samples as well as samples from snare polypectomy procedures. In total, 75 samples were imaged from 39 patients. Sample sizes from surgical specimens typically measured approximately . The size of pinch biopsies typically measured in greatest dimension, while resected polyps ranged from in maximum dimension. The high imaging speed of the OCM system enabled extensive survey of multiple sites in each specimen. In total, thousands of images were collected for review. Normal specimen subtypes included esophageal squamous mucosa (10), glandular mucosa of the stomach (3), small intestine (5), colon (11), and pancreas (2). Pathology specimen subtypes included columnar-lined esophagus (11), esophageal adenocarcinoma (1), celiac disease (1), inflammatory bowel disease (3), acute inflammation (2), chronic colitis (2), melanosis coli (1), tubular adenoma (11), hyperplastic polyp (5), colorectal adenocarcinoma (4), cholecystitis (2), and chronic pancreatitis (1). Specimens were classified based on histologic diagnosis by an experienced gastrointestinal pathologist. To prevent tissue dehydration, specimens were immersed in isotonic phosphate-buffered saline. Imaging was performed through a coverslip, with a thin layer of transparent ultrasound gel between the coverslip and tissue surface to prevent distortion of surface architecture. Imaging was first performed using ultrahigh-resolution OCT over a field of view. The OCT and OCM images were acquired through the same microscope with variable, collinear objective lenses, allowing co-registration of the center of the OCM images to the center of the OCT data set. Once regions of interest were located on OCT images, OCM was performed of those areas. Registration of OCM and OCT images was approximate in real-time imaging, but was improved in post-processing of the data by using tissue landmark features to correlate the images. After imaging, the sample was prepared for histologic sectioning. Discarded samples from the pathology laboratory were inked to mark the OCT imaging plane before formalin fixation and histologic processing. Sections were cut in both cross-sectional and en face planes relative to the luminal surface to allow comparison to both OCT and OCM images. Specimens from the endoscopy clinic were placed in formalin in accordance with standard clinical protocol and processed for histology. Tissue sections were stained with hematoxylin and eosin, and digital photomicrographs of histology were recorded. 2.3.Data AnalysisA selection of normal and pathologic conditions from this feasibility study is presented in this paper. Data analysis focused on qualitative image interpretation and correlation with histology. The image database and histology slide set were first reviewed, and representative specimen data selected for further evaluation based on several factors, including relative correlation with histology, overall image quality, and accurate representation of the larger data set. Representative photomicrographs of histologic sections were then made with the best effort attempt to provide correlation among features. OCT images proved more useful than OCM for histologic correlations, because the larger field of view allowed appreciation of architectural features visible in low-power fields. For presentation, OCT and OCM still frames were selected from the individual specimen data set to most accurately correlate with histologic features. Image correlation with histology was nonblinded since the purpose of this investigation was to establish correspondence between OCM and histology and understand which features could be visualized by OCM in a cross section of GI normal tissues and pathologies. 3.Results3.1.Upper Gastrointestinal TractFigures 1 and 1 present representative ultrahigh-resolution OCT (UHR OCT) and histology images of normal esophageal squamous mucosa. The OCT image in Fig. 1 clearly delineates the layered cross-sectional architecture of the esophageal mucosa, including the cellular epithelial layer and underlying lamina propria and submucosa. UHR OCT cannot, however, identify cellular epithelial features. Images acquired with en face OCM of the same region of the same specimen are presented in Figs. 1 and 1. The OCM images have a smaller field of view than OCT, but the much higher transverse resolution enables visualization of squamous cells and their nuclei. Figures 1 and 1 show images at depths of and , respectively. In Fig. 1, nuclei and cell membranes can be readily visualized as highly scattering relative to the cytoplasm. The transition region between the stratified squamous epithelium and the underlying lamina propria can be seen in Fig. 1, demarcated by arrows. Small cells evident on the top portion of this image point out the change in cell size expected in going from the surface to the basal layer in a stratified squamous epithelium. The lamina propria appears highly scattering and disorganized relative to the cellular epithelium. Representative en face histology is shown for comparison, with Fig. 1 corresponding approximately to OCM image 1 and Fig. 1 to the image in 1. Fig. 1Normal squamous esophagus. (a) Ultrahigh-resolution cross-sectional OCT image. The layered mucosal structure including the epithelium (e), lamina propria (lp), and submucosa (sm) is visualized. No muscularis mucosa layer is seen in this cross section. Scale bar, . (b) Corresponding cross-sectional histology, hematoxylin and eosin ; scale bar, . (c) OCM en face image of squamous epithelial cells. Nuclei (n) and cell membranes are readily visible. Image depth is . (d) OCM image near the basement membrane. The transition between cellular epithelium and more highly scattering loose connective tissue in the lamina propria is visible (arrows). Image depth is . (e) and (f) Corresponding en face hematoxylin and eosin histology to (c) and (d), respectively. Scale bars (c) to (f), . 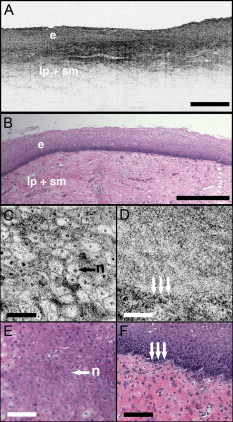 The high resolution of OCM well below the tissue surface is further highlighted in Figs. 2, 2, 2, 2 , which present sequential OCM images taken at depths between and . Surface cells are larger and with lower relative nuclear to cytoplasm (N/C) ratio compared to cells at deeper levels. In this specimen, the papillae projections in the squamous mucosa can be visualized, with squamous cells appearing to swirl around them. At greater depths, the cellular epithelium disappears earlier over the ridges, as evident in Figs. 2 and 2. Figures 2, 2, 2, 2 show zoom views of the boxes identified in 2, 2, 2, 2. A clear decrease in the cell size, as well as an increase in the relative N/C ratio can be appreciated. Fig. 2(a) to (d) OCM imaging of squamous cellular progression in depth. Decrease in cell size and increased relative nuclear-to-cytoplasm ratio is evident in the images. Image depths for (a) to (d) are , , , and , respectively. Scale bars, . (e) to (h) Zoom views of the regions highlighted in (a) to (d). Scale bars, . 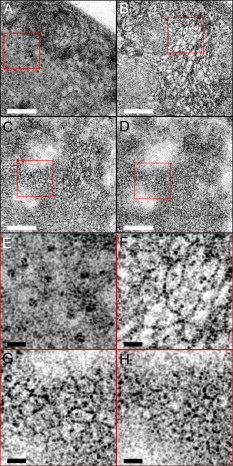 Figure 3 demonstrates the squamo-columnar junction marking the transition between squamous esophagus and gastric mucosa. The cross-sectional OCT image in Fig. 3 shows a fairly homogeneous squamous epithelium as well as the gastric pit architecture, as verified in the histology of Fig. 3. The en face OCM images in Figs. 3 and 3 show squamous cells immediately adjacent to the gastric pits. The image depth is approximately . Normal epithelial gastric mucous cells can be identified surrounding the lumens of the pits. Fig. 3Squamo-columnar junction. (a) UHR OCT image. Esophageal squamous (s) and gastric (g) mucosa are highlighted, with gastric pit architecture identified (arrow). Scale bar, . (b) Histology, hematoxylin and eosin, . (c) to (d) OCM images of the squamo-columnar junction. Squamous cells (s) and gastric glands (g) are visible with individual mucous cells lining the gastric pits (arrows). Scale bars, .  Figure 4 shows OCT and OCM images of Barrett’s esophagus and corresponding histology acquired from a pinch biopsy specimen. The UHR OCT image in Fig. 4 shows a distinct architecture for columnar mucosa that differs from either the esophageal squamous or gastric glandular morphology. Structural heterogeneity results from glandular features at and beneath the mucosal surface. Representative cross-sectional histology is presented in Fig. 4. An OCM image from this same specimen is presented in Fig. 4 along with higher magnification histology in Fig. 4. Goblet cells, a marker of Barrett’s epithelium, appear on OCM as distinct, nonscattering inclusions within the epithelium. The OCM image also shows heterogeneity in scattering properties of the glandular epithelium. Contrast is generated within and between the adjacent columnar cells, which can be appreciated in parts of the epithelium by the striated appearance radiating away from the lumen. Fig. 4Barrett’s esophagus. (a) UHR OCT image of a biopsy specimen. Barrett’s glands (arrows) can be identified in the heterogeneous epithelium. Scale bar, . (b) Histology, hematoxylin and eosin, . Scale bar, . (c) OCM image of Barrett’s epithelium. Individual goblet-like cells (arrows) are identified surrounding the crypt lumen. Scale bar, . (d) Histology, hematoxylin and eosin, . Scale bar, . 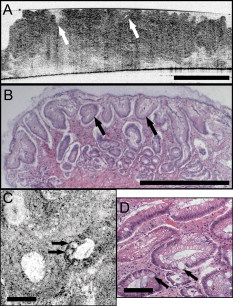 Figure 5 shows UHR OCT and OCM images of invasive esophageal adenocarcinoma. The UHR OCT image in 5 demonstrates fine tissue heterogeneity and relatively low image penetration depth compared to squamous mucosa, as well as an absence of larger glandular structures generally seen on OCT images of Barrett’s esophagus. Histology in Fig. 5 confirms invasive adenocarcinoma. The OCM image of the tumor in Fig. 5 demonstrates profound structural heterogeneity consistent with the histology of Fig. 5. Darkly staining nuclei of malignant cells evident on histology appear as highly scattering spots on OCM. In addition, gland forming entities devoid of OCM signal are present throughout the tumor and chords of highly scattering stroma can be seen penetrating the tumor. Fig. 5Esophageal adenocarcinoma. (a) UHR OCT image. Scale bar, . (b) Histology, hematoxylin and eosin, . Scale bar, . (c) OCM image of adenocarcinoma. Malignant gland architecture is evident (black arrows). Highly scattering bands of stroma can also be identified (black arrow heads). In addition, highly scattering inclusions (white arrows) likely represent darkly staining malignant cell nuclei visible on histology. Image depth is . Scale bar, . (d) Histology, hematoxylin and eosin, . Scale bar, . 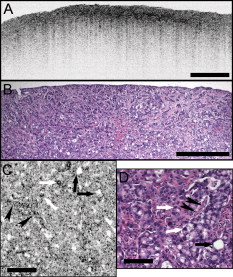 3.2.Lower Gastrointestinal TractFigure 6 shows UHR OCT and OCM images of normal colon in the region of the cecum. Crypt architecture can be appreciated by OCT with good correspondence to histology. OCM visualizes the individual crypt morphology with high resolution. Crypt lumens show high contrast relative to the epithelium, and individual goblet cells can be clearly identified in correspondence to histology. Fig. 6Normal colon. (a) UHR OCT image. Crypt epithelial architecture as well as the underlying muscularis layer is identified. Scale bar, . (b) Histology, hematoxylin and eosin, . Scale bar, . (c) OCM image of individual colonic crypts. Single goblet cells are identified within the crypt epithelium (arrows). Image depth is . Scale bar, . (d) Histology, hematoxylin and eosin, . Scale bar, . 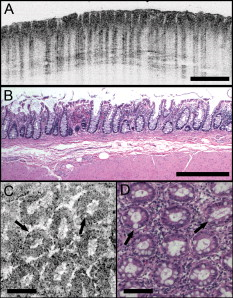 Figure 7 presents images and corresponding histology from a tubular adenoma of the colon. Histology in Figs. 7 and 7 confirms the presence of long, parallel crypts with enlarged, cigar-shaped nuclei typical of tubular adenomas. On UHR OCT, the crypt lumens can be identified, and the high axial resolution enables delineation of the columnar epithelial layer lining the crypts. OCM en face images show the crypts in the transverse plane and compare well to the representative histology in Fig. 7. Notably, the elongated, eccentric crypts with varying alignment differ markedly from the uniform field of smaller crypts of normal colon. Moreover, OCM visualizes striations in the epithelial layer that likely represent pseudostratified nuclei in the crypt epithelium (arrows). Fig. 7Tubular adenoma. (a) UHR OCT image. Crypt architecture with distinct epithelial lining is identified. Scale bar, . (b) Histology, hematoxylin and eosin, . Scale bar, . (c) OCM image of adenomatous crypts. Elongated, irregular crypts are visible with striated highly scattering epithelium representative of dysplastic nuclei (arrows). Image depth is . Scale bar, . (d) Histology, hematoxylin and eosin, . Scale bar, . 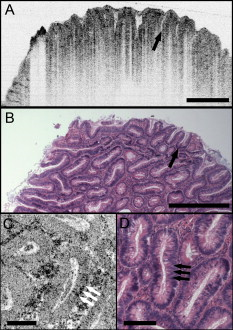 Compared to the images of normal and adenomatous colon, OCT and OCM images of adenocarcinoma of the colon display a prominent loss of crypt architecture, as demonstrated in Fig. 8 . Similar features are visualized as in esophageal adenocarcinoma. UHR OCT images show relatively low image penetration and heterogeneous fine tissue architecture consistent with densely packed malignant glands, as seen in the histology in Fig. 8. The en face OCM image in Fig. 8 provides a high-resolution view of the tissue architecture and identifies individual gland-forming units within the tumor. In addition, highly scattering malignant nuclei are also prominent in the OCM images. Corresponding histology is provided in Fig. 8. Fig. 8Adenocarcinoma of the colon. (a) UHR OCT image. Fine scattering heterogeneity with interspersed malignant gland formation can be recognized on OCT (arrow). Scale bar, . (b) Histology, hematoxylin and eosin, . Scale bar, . (c) OCM image of tumor microstructure. Gland formation (black arrows) as well as highly scattering malignant nuclei (white arrows) are highlighted. Image depth is . Scale bar, . (d) Histology, hematoxylin and eosin, . Scale bar, . 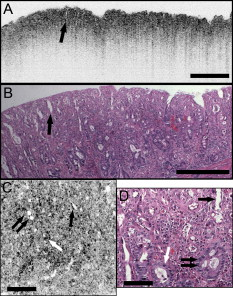 4.DiscussionIn this study, OCM was investigated for cellular resolution imaging of gastrointestinal tissue ex vivo. Conventional cross-sectional OCT imaging cannot reliably image cellular features because of limited transverse image resolution. OCM achieves high transverse resolution by acquiring images in the en face plane, similar to confocal microscopy. The image is generated from a single depth, which allows tight focusing. OCM can achieve image resolutions of in three dimensions, thereby enabling cellular imaging. This work represents the first survey of tissues in the gastrointestinal tract using OCM and introduces OCM for endoscopic imaging applications. Freshly excised normal and pathologic specimens were imaged with system parameters similar to those that would be used in vivo to provide an assessment of image quality that can be expected from future endoscopic studies. OCM imaging was compared with histology in order to understand which features could be visualized by OCM in a selection of normal and diseased tissues. Furthermore, OCM images were acquired co-registered to ultrahigh-resolution OCT images from the same specimen, allowing the reader to interpret the en face OCM images with respect to the more familiar, previously published cross-sectional OCT images. Together, this OCT and OCM data set provides an important comparison of the state of the art for these two methods. The study was limited by the lack of blinded image interpretation that would allow determination of diagnostic sensitivity, specificity, and accuracy for specific pathologies. However, since this is the first study of OCM across a range of GI pathologies, its purpose was to establish which features could be visualized using OCM. Future blinded studies focusing on individual pathologies with larger specimen numbers will be necessary to determine diagnostic capability. These studies should ultimately be conducted in vivo using endoscopic OCM devices. Several conclusions can be drawn from this study about the relative capabilities of OCT and OCM for structural imaging of gastrointestinal tissues. Within scattering tissue, OCT is most useful for characterizing mucosal layers and overall tissue architecture, and identifying the presence or absence of structures at an intermediate resolution scale. Cross-sectional UHR OCT images provide excellent assessment of layer thicknesses within the first of mucosal tissues. UHR OCT can also frequently visualize crypt and glandular entities, vessels, and ducts at and beneath the surface. Within individual crypts and glands, the columnar cell layers lining the lumen can often be appreciated, although single cells cannot be identified. OCT can also assess tissue surface architecture, as exemplified by the images of villous structure from the duodenum and small intestine. Delineation of tissue types based on these surface architectural features may therefore be possible. OCM provides an order of magnitude improvement in the transverse resolution compared with OCT, allowing visualization of cellular and subcellular features. Squamous cell nuclei and cytoplasmic membranes can generally be identified, and the progression of cell size and nuclear-to-cytoplasm ratio can be appreciated. Nuclei can also be identified in many colon specimens, with adenomatous polyps, for example, frequently exhibiting nuclear pseudostratification. Other mucosal cell types visible on OCM include mucin-containing cells in the normal stomach and goblet cells in the colon as well as in pathologic conditions such as Barrett’s esophagus. OCM can also characterize tissue architecture on a smaller scale and in an orthogonal plane compared to OCT. This includes such features as crypt size, shape, and arrangement, and the presence of gland formation within specimens of adenocarcinoma. The overall quality of the OCM images compares favorably to previously published reflectance confocal microscopy images.18 This is impressive given that OCM uses relatively low numerical aperture compared to confocal microscopy. Typical reflectance confocal microscopes utilize a numerical aperture of 0.7 to 1.0 in order to provide a depth gate of , which is equivalent to a conventional histologic section thickness.14 OCM uses optical coherence gating in addition to confocal gating and improves rejection of out of focus scattered light compared to confocal microscopy alone. In this work, an effective numerical aperture of to 0.4 was used to provide a high transverse resolution of , but with a depth gate of only . In itself, this slice thickness would be insufficient for high-contrast cellular imaging below the tissue surface. The longer confocal region, however, was compensated for by using a very short coherence gate. Development of high numerical aperture objective lenses remains a challenging obstacle for reflectance confocal endoscopy. The use of coherence gating to relax the numerical aperture requirements should facilitate the development of small-diameter endoscopic probes. A major factor currently limiting the application of OCM in endoscopy is the widespread availability of two-axis scanning catheters for en face imaging. A number of scanning solutions are currently being explored, including microelectromechanical systems (MEMS)30 and piezo-electric fiber scanners.31 Moreover, solutions have already been implemented for fluorescence confocal endoscopy, which would work equally well for OCM.21 There are no fundamental limitations that will prevent endoscopic OCM from being a clinically viable alternative to confocal endoscopy in the near future. OCM images have intrinsic contrast provided by backscattered light, without the need for exogenous fluorescence dyes. In addition, OCM uses longer wavelength light that penetrates farther into tissue than the visible wavelengths used for fluorescence excitation. Contrast and resolution in OCM are generally lower, however, than in confocal fluorescence microscopy due to the weak intrinsic contrast in gastrointestinal tissues. To enhance contrast, acetic acid has been applied to fresh tissue to increase nuclear scattering.32 Although not used in this study, similar contrast improvement can be expected in OCM. Acetic acid solutions are used routinely in endoscopy and would therefore find widespread applicability. Contrast in OCM is also limited by coherent speckle, which gives a grainy appearance to the images. A number of speckle reduction methods are currently under investigation.33, 34, 35, 36, 37 The imaging depth of OCT is limited by a combination of detection sensitivity and multiple scattering. The minimum detectable reflection, set by the quantum detection limit, determines the absolute maximum depth. The more practical limit, however, is the depth at which image resolution and contrast degrade to the point where the images are no longer useful. Such degradation results from detection of out of focus and multiply scattered light due to insufficient confocal and optical coherence gating. As noted earlier, OCM can maintain contrast despite the loss of confocal gating. As the focus is translated deeper, however, contrast in OCM also degrades, which suggests detection of increasing amounts of multiply scattered light. The degree of improvement of OCM over confocal microscopy depends strongly on the tissue scattering and optical properties. An estimate of the imaging depth for OCM in various tissues can be obtained from the OCT images of these tissues. However, the imaging depth in OCT often leads to an overestimate of the usable image depth in OCM because of the role of resolution and contrast loss. OCT uses only moderate numerical aperture and transverse resolution, without a significant confocal gate. Hence, the loss of lateral resolution in OCT, although still present, is not as detrimental as in OCM. Furthermore, imaging depth is generally assessed based on the sensitivity limit when the signal level approaches the noise floor. The transition to the multiple scattering regime occurs before this and therefore limits the depth at which single scattered light can be detected with sufficient contrast. The multiple scattering regime is evident in nearly all of the images as the diffuse tail of OCT signal that approaches the noise floor. Some features can still be visualized within the multiple scattering regime, but the effective image resolution will be lower. A limitation of all cellular resolution microscopy techniques is the relatively small field of view. A potential solution to this problem would be to combine OCT with confocal microscopy or OCM, as suggested by previous investigators.23 OCT images a larger field of view, providing information about architectural morphology, while OCM provides a high magnification view of cellular structures. Recent advances in OCT have yielded tremendous improvements in imaging speed,38, 39 promising to enable wide area coverage and comprehensive mapping of entire segments of the esophagus or colon.40, 41 With future development of endoscopic devices, OCM promises to find utility in applications that are currently being studied with confocal microscopy and OCT. These include, among others, surveillance for dysplasia in Barrett’s esophagus or inflammatory bowel disease, discrimination between hyperplastic and adenomatous polyps, and identification of tumor margins and invasion. In addition, the ability to image with reduced numerical aperture will enable a host of new cellular imaging applications using very small diameter needle-based probes, which can perform cellular-level imaging inside solid tissues or organs. AcknowledgmentsThis work was supported by the National Institutes of Health R01-CA75289-13, R01-EY11289-24, 5F31EB005978-03, R01-NS057476-02, and R01HL095717-01; the Air Force Office of Scientific Research FA9550-07-1-0101 and FA9550-07-1-0014; the National Science Foundation BES-0522845; the Cancer Research and Prevention Foundation; and the VA Medical Center. We thank Daniel Kopf, Saleem Desai, Marisa Figuereido, Marcos Pedrosa, Ashish Sharma, and Shu-Wei Huang for helpful scientific discussions and assistance. J.F. receives royalties for intellectual property licensed by MIT to LightLab Imaging and Carl Zeiss. ReferencesG. J. Tearney,
M. E. Brezinski,
B. E. Bouma,
S. A. Boppart,
C. Pitris,
J. F. Southern, and
J. G. Fujimoto,
“In vivo endoscopic optical biopsy with optical coherence tomography,”
Science, 276 2037
–2039
(1997). https://doi.org/10.1126/science.276.5321.2037 0036-8075 Google Scholar
P. R. Herz,
Y. Chen,
A. D. Aguirre,
J. G. Fujimoto,
H. Mashimo,
J. Schmitt,
A. Koski,
J. Goodnow, and
C. Petersen,
“Ultrahigh resolution optical biopsy with endoscopic optical coherence tomography,”
Opt. Express, 12 3532
–3542
(2004). https://doi.org/10.1364/OPEX.12.003532 1094-4087 Google Scholar
Y. Chen,
A. D. Aguirre,
P. L. Hsiung,
S. Desai,
P. R. Herz,
M. Pedrosa,
Q. Huang,
M. Figueiredo,
S. W. Huang,
A. Koski,
J. M. Schmitt,
J. G. Fujimoto, and
H. Mashimo,
“Ultrahigh resolution optical coherence tomography of Barrett’s esophagus: preliminary descriptive clinical study correlating images with histology,”
Endoscopy, 39 599
–605
(2007). https://doi.org/10.1055/s-2007-966648 0013-726X Google Scholar
B. E. Bouma,
G. J. Tearney,
C. C. Compton, and
N. S. Nishioka,
“High-resolution imaging of the human esophagus and stomach in vivo using optical coherence tomography,”
Gastrointest. Endosc., 51 467
–474
(2000). https://doi.org/10.1016/S0016-5107(00)70449-4 0016-5107 Google Scholar
K. Kobayashi,
J. A. Izatt,
A. M. Rollins,
R. Ung-Runyawee,
A. Chak,
R. C. Wong,
G. A. Isenberg, and
J. Willis,
“High-resolution endoscopic imaging of the GI tract using optical coherence tomography,”
Gastrointest. Endosc., 51 474
–479
(2000). https://doi.org/10.1016/S0016-5107(00)70450-0 0016-5107 Google Scholar
X. D. Li,
S. A. Boppart,
J. Van Dam,
H. Mashimo,
M. Mutinga,
W. Drexler,
M. Klein,
C. Pitris,
M. L. Krinsky,
M. E. Brezinski, and
J. G. Fujimoto,
“Optical coherence tomography: advanced technology for the endoscopic imaging of Barrett’s esophagus,”
Endoscopy, 32 921
–930
(2000). https://doi.org/10.1055/s-2000-9626 0013-726X Google Scholar
A. M. Sergeev,
V. M. Gelikonov,
G. V. Gelikonov,
F. I. Feldchtein,
R. V. Kuranov,
N. D. Gladkova,
N. M. Shakhova,
L. B. Suopova,
A. V. Shakhov,
I. A. Kuznetzova,
A. N. Denisenko,
V. V. Pochinko,
Y. P. Chumakov, and
O. S. Streltzova,
“In vivo endoscopic OCT imaging of precancer and cancer states of human mucosa,”
Opt. Express, 1 432
(1997). https://doi.org/10.1364/OE.1.000432 1094-4087 Google Scholar
G. Zuccaro,
N. Gladkova,
J. Vargo,
F. Feldchtein,
E. Zagaynova,
D. Conwell,
G. Falk,
J. Goldblum,
J. Dumot,
J. Ponsky,
G. Gelikonov,
B. Davros,
E. Donchenko, and
J. Richter,
“Optical coherence tomography of the esophagus and proximal stomach in health and disease,”
Am. J. Gastroenterol., 96 2633
–2639
(2001). https://doi.org/10.1111/j.1572-0241.2001.04119.x 0002-9270 Google Scholar
J. M. Poneros,
S. Brand,
B. E. Bouma,
G. J. Tearney,
C. C. Compton, and
N. S. Nishioka,
“Diagnosis of specialized intestinal metaplasia by optical coherence tomography,”
Gastroenterology, 120 7
–12
(2001). https://doi.org/10.1053/gast.2001.20911 0016-5085 Google Scholar
P. R. Pfau,
M. V. Sivak Jr., A. Chak,
M. Kinnard,
R. C. Wong,
G. A. Isenberg,
J. A. Izatt,
A. Rollins, and
V. Westphal,
“Criteria for the diagnosis of dysplasia by endoscopic optical coherence tomography,”
Gastrointest. Endosc., 58 196
–202
(2003). https://doi.org/10.1067/mge.2003.344 0016-5107 Google Scholar
G. Isenberg,
M. V. Sivak Jr., A. Chak,
R. C. Wong,
J. E. Willis,
B. Wolf,
D. Y. Rowland,
A. Das, and
A. Rollins,
“Accuracy of endoscopic optical coherence tomography in the detection of dysplasia in Barrett’s esophagus: a prospective, double-blinded study,”
Gastrointest. Endosc., 62 825
–831
(2005). https://doi.org/10.1016/j.gie.2005.07.048 0016-5107 Google Scholar
J. A. Evans,
J. M. Poneros,
B. E. Bouma,
J. Bressner,
E. F. Halpern,
M. Shishkov,
G. Y. Lauwers,
M. Mino-Kenudson,
N. S. Nishioka, and
G. J. Tearney,
“Optical coherence tomography to identify intramucosal carcinoma and high-grade dysplasia in Barrett’s esophagus,”
Clin. Gastroenterol. Hepatol., 4 38
–43
(2006). https://doi.org/10.1016/S1542-3565(05)00746-9 Google Scholar
S. Gonzalez,
K. Swindells,
M. Rajadhyaksha, and
A. Torres,
“Changing paradigms in dermatology: confocal microscopy in clinical and surgical dermatology,”
Clin. Dermatol., 21 359
–369
(2003). https://doi.org/10.1016/j.clindermatol.2003.08.007 0738-081X Google Scholar
M. Rajadhyaksha,
S. Gonzalez,
J. M. Zavislan,
R. R. Anderson, and
R. H. Webb,
“In vivo confocal scanning laser microscopy of human skin II: advances in instrumentation and comparison with histology,”
J. Invest. Dermatol., 113 293
–303
(1999). https://doi.org/10.1046/j.1523-1747.1999.00690.x 0022-202X Google Scholar
K. B. Sung,
R. Richards-Kortum,
M. Follen,
A. Malpica,
C. Liang, and
M. R. Descour,
“Fiber optic confocal reflectance microscopy: a new real-time technique to view nuclear morphology in cervical squamous epithelium in vivo,”
Opt. Express, 11 3171
–3181
(2003). 1094-4087 Google Scholar
W. M. White,
M. Rajadhyaksha,
S. Gonzalez,
R. L. Fabian, and
R. R. Anderson,
“Noninvasive imaging of human oral mucosa in vivo by confocal reflectance microscopy,”
Laryngoscope, 109 1709
–1717
(1999). https://doi.org/10.1097/00005537-199910000-00029 0023-852X Google Scholar
P. W. Chiu,
H. Inoue,
H. Satodate,
T. Kazawa,
T. Yoshida,
M. Sakashita, and
S. E. Kudo,
“Validation of the quality of histological images obtained of fresh and formalin-fixed specimens of esophageal and gastric mucosa by laser-scanning confocal microscopy,”
Endoscopy, 38 236
–240
(2006). https://doi.org/10.1055/s-2005-870406 0013-726X Google Scholar
H. Inoue,
T. Igari,
T. Nishikage,
K. Ami,
T. Yoshida, and
T. Iwai,
“A novel method of virtual histopathology using laser-scanning confocal microscopy in vitro with untreated fresh specimens from the gastrointestinal mucosa,”
Endoscopy, 32 439
–443
(2000). https://doi.org/10.1055/s-2000-654 0013-726X Google Scholar
M. Sakashita,
H. Inoue,
H. Kashida,
J. Tanaka,
J. Y. Cho,
H. Satodate,
E. Hidaka,
T. Yoshida,
N. Fukami,
Y. Tamegai,
A. Shiokawa, and
S. Kudo,
“Virtual histology of colorectal lesions using laser-scanning confocal microscopy,”
Endoscopy, 35 1033
–1038
(2003). https://doi.org/10.1055/s-2003-44595 0013-726X Google Scholar
J. T. Liu,
M. J. Mandella,
S. Friedland,
R. Soetikno,
J. M. Crawford,
C. H. Contag,
G. S. Kino, and
T. D. Wang,
“Dual-axes confocal reflectance microscope for distinguishing colonic neoplasia,”
J. Biomed. Opt., 11 054019
(2006). https://doi.org/10.1117/1.2363363 1083-3668 Google Scholar
A. L. Polglase,
W. J. McLaren,
S. A. Skinner,
R. Kiesslich,
M. F. Neurath, and
P. M. Delaney,
“A fluorescence confocal endomicroscope for in vivo microscopy of the upper- and the lower-GI tract,”
Gastrointest. Endosc., 62 686
–695
(2005). https://doi.org/10.1016/j.gie.2005.05.021 0016-5107 Google Scholar
R. Kiesslich,
J. Burg,
M. Vieth,
J. Gnaendiger,
M. Enders,
P. Delaney,
A. Polglase,
W. McLaren,
D. Janell,
S. Thomas,
B. Nafe,
P. R. Galle, and
M. F. Neurath,
“Confocal laser endoscopy for diagnosing intraepithelial neoplasias and colorectal cancer in vivo,”
Gastroenterology, 127 706
–713
(2004). https://doi.org/10.1053/j.gastro.2004.06.050 0016-5085 Google Scholar
R. Kiesslich,
L. Gossner,
M. Goetz,
A. Dahlmann,
M. Vieth,
M. Stolte,
A. Hoffman,
M. Jung,
B. Nafe,
P. R. Galle, and
M. F. Neurath,
“In vivo histology of Barrett’s esophagus and associated neoplasia by confocal laser endomicroscopy,”
Clin. Gastroenterol. Hepatol., 4 979
–987
(2006). https://doi.org/10.1016/j.cgh.2006.05.010 Google Scholar
J. A. Izatt,
M. R. Hee,
G. M. Owen,
E. A. Swanson, and
J. G. Fujimoto,
“Optical coherence microscopy in scattering media,”
Opt. Lett., 19 590
–592
(1994). https://doi.org/10.1364/OL.19.000590 0146-9592 Google Scholar
A. D. Aguirre,
P. Hsiung,
T. H. Ko,
I. Hartl, and
J. G. Fujimoto,
“High-resolution optical coherence microscopy for high-speed, in vivo cellular imaging,”
Opt. Lett., 28 2064
–2066
(2003). https://doi.org/10.1364/OL.28.002064 0146-9592 Google Scholar
J. A. Izatt,
M. D. Kulkarni,
H.-W. Wang,
K. Kobayashi, and
M. V. Sivak Jr.,
“Optical coherence tomography and microscopy in gastrointestinal tissues,”
IEEE J. Sel. Top. Quantum Electron., 2 1017
–1028
(1996). https://doi.org/10.1109/2944.577331 1077-260X Google Scholar
A. L. Clark,
A. Gillenwater,
R. Alizadeh-Naderi,
A. K. El-Naggar, and
R. Richards-Kortum,
“Detection and diagnosis of oral neoplasia with an optical coherence microscope,”
J. Biomed. Opt., 9 1271
–1280
(2004). https://doi.org/10.1117/1.1805558 1083-3668 Google Scholar
A. D. Aguirre,
“Advances in optical coherence tomography and microscopy for endoscopic applications and functional neuroimaging,”
Harvard University—MIT Division of Health Sciences and Technology,
(2008). Google Scholar
P. L. Hsiung,
L. Pantanowitz,
A. D. Aguirre,
Y. Chen,
D. Phatak,
T. H. Ko,
S. Bourquin,
S. J. Schnitt,
S. Raza,
J. L. Connolly,
H. Mashimo, and
J. G. Fujimoto,
“Ultrahigh-resolution and 3-dimensional optical coherence tomography ex vivo imaging of the large and small intestines,”
Gastrointest. Endosc., 62 561
–574
(2005). https://doi.org/10.1016/j.gie.2005.05.006 0016-5107 Google Scholar
W. Jung,
D. T. McCormick,
J. Zhang,
L. Wang,
N. C. Tien, and
Z. P. Chen,
“Three-dimensional endoscopic optical coherence tomography by use of a two-axis microelectromechanical scanning mirror,”
Appl. Phys. Lett., 88 163901
(2006). https://doi.org/10.1063/1.2195092 0003-6951 Google Scholar
X. Liu,
M. J. Cobb,
Y. Chen,
M. B. Kimmey, and
X. Li,
“Rapid-scanning forward-imaging miniature endoscope for real-time optical coherence tomography,”
Opt. Lett., 29 1763
–1765
(2004). https://doi.org/10.1364/OL.29.001763 0146-9592 Google Scholar
R. A. Drezek,
T. Collier,
C. K. Brookner,
A. Malpica,
R. Lotan,
R. R. Richards-Kortum, and
M. Follen,
“Laser scanning confocal microscopy of cervical tissue before and after application of acetic acid,”
Am. J. Obstet. Gynecol., 182 1135
–1139
(2000). https://doi.org/10.1067/mob.2000.104844 0002-9378 Google Scholar
D. L. Marks,
T. S. Ralston, and
S. A. Boppart,
“Speckle reduction by I-divergence regularization in optical coherence tomography,”
J. Opt. Soc. Am. A, 22 2366
–2371
(2005). https://doi.org/10.1364/JOSAA.22.002366 0740-3232 Google Scholar
D. C. Adler,
T. H. Ko, and
J. G. Fujimoto,
“Speckle reduction in optical coherence tomography images by use of a spatially adaptive wavelet filter,”
Opt. Lett., 29 2878
–2880
(2004). https://doi.org/10.1364/OL.29.002878 0146-9592 Google Scholar
M. Pircher,
E. Gotzinger,
R. Leitgeb,
A. F. Fercher, and
C. K. Hitzenberger,
“Speckle reduction in optical coherence tomography by frequency compounding,”
J. Biomed. Opt., 8 565
–569
(2003). https://doi.org/10.1117/1.1578087 1083-3668 Google Scholar
J. M. Schmitt,
“Array detection for speckle reduction in optical coherence microscopy,”
Phys. Med. Biol., 42 1427
–1439
(1997). https://doi.org/10.1088/0031-9155/42/7/015 0031-9155 Google Scholar
A. E. Desjardins,
B. J. Vakoc,
G. J. Tearney, and
B. E. Bouma,
“Speckle reduction in OCT using massively parallel detection and frequency-domain ranging,”
Opt. Express, 14 4736
–4745
(2006). https://doi.org/10.1364/OE.14.004736 1094-4087 Google Scholar
S. H. Yun,
G. J. Tearney,
J. F. de Boer,
N. Iftimia, and
B. E. Bouma,
“High-speed optical frequency-domain imaging,”
Opt. Express, 11 2953
–2963
(2003). https://doi.org/10.1364/OE.11.002953 1094-4087 Google Scholar
R. Huber,
M. Wojtkowski, and
J. G. Fujimoto,
“Fourier domain mode locking (FDML): a new laser operating regime and applications for optical coherence tomography,”
Opt. Express, 14 3225
–3237
(2006). https://doi.org/10.1364/OE.14.003225 1094-4087 Google Scholar
B. J. Vakoc,
M. Shishko,
S. H. Yun,
W. Y. Oh,
M. J. Suter,
A. E. Desjardins,
J. A. Evans,
N. S. Nishioka,
G. J. Tearney, and
B. E. Bouma,
“Comprehensive esophageal microscopy by using optical frequency-domain imaging (with video),”
Gastrointest. Endosc., 65 898
–905
(2007). https://doi.org/10.1016/j.gie.2006.08.009 0016-5107 Google Scholar
S. H. Yun,
G. J. Tearney,
B. J. Vakoc,
M. Shishkov,
W. Y. Oh,
A. E. Desjardins,
M. J. Suter,
R. C. Chan,
J. A. Evans,
I. K. Jang,
N. S. Nishioka,
J. F. de Boer, and
B. E. Bouma,
“Comprehensive volumetric optical microscopy in vivo,”
Nat. Med., 12 1429
–1433
(2006). https://doi.org/10.1038/nm1450 1078-8956 Google Scholar
|

