
|
|
|
Optical Doppler tomography (ODT) combines the Doppler principle with optical coherence tomography (OCT)1 for simultaneous tomographic imaging of tissue structure and blood flow2, 3, 4, 5, 6, 7 and has been used for a number of potentially important clinical applications.8, 9, 10 ODT is based on the principle that light interacting with moving particles, such as red blood cells inside biological tissues, causes Doppler frequency shifts in the measured interference signal. Previously developed ODT methods2, 3, 4, 5 use a fast Fourier transform algorithm to measure the Doppler shift of the fringe frequency and determine the flow velocity of moving particles in the sample; however, they are subject to a compromise between high velocity sensitivity and high imaging speed/high spatial resolution. To overcome this limitation, a phase-resolved method6, 7 was developed in a time-domain OCT system to decouple the velocity sensitivity from the spatial resolution while maintaining a high acquisition speed. Later, a phase-resolved method was demonstrated using Fourier-domain OCT systems.8, 9, 10 The phase is determined by the complex-valued analytic continuation of the measured interference fringe, and the phase change between the measured interference signals from sequential axial scans are used for velocity image reconstruction. The maximum measurable dynamics range without phase wrapping is determined by the time interval between sequential axial scans. Despite the noninvasive nature and exceptionally high spatial resolution, it remains challenging to use ODT for ophthalmic, especially choroid vasculature, imaging.11 Besides the limited measurement dynamic range of phase-resolved ODT, it is also subject to the optical heterogeneity of the sample and phase instability caused by sample motion artifacts. Repeated or dense scans are possible ways to reduce the background characteristic texture pattern12, 13 but will inevitably increase the imaging time. Another method, called Doppler optical microangiography,14 has recently been proposed to minimize the influence of heterogeneous tissue by digitally replacing the endogenous tissue background with an “ideal tissue background” but needs lateral modulation of the scanner and extra Hilbert/Fourier calculation besides the phase-resolved Doppler calculation. Furthermore, low-velocity imaging is also limited by the fact that the Doppler frequency shift depends on the Doppler angle between the probe and flow directions and is highly sensitive to the pulsatile nature of the blood flow. In many clinical studies, the location of the microvasculature is more important than the absolute value of the flow velocity.11, 15 Doppler variance (or standard deviation) tomography was previously developed by our group for skin imaging16 and a microfluidic study.17 It was demonstrated that variance imaging is less sensitive to the Doppler angle and is more efficient for mapping the flows buried in nontransparent media. In this letter, we demonstrate an improved variance/Doppler imaging modality for three-dimensional (3-D) angiographic imaging of the human retina and choroids. We also demonstrate that variance imaging is subject to bulk-motion artifacts that are inevitable for in vivo ophthalmology applications. A histogram-based algorithm is used to extract and correct the bulk-motion phase. Both the variance and Doppler images before and after bulk-motion correction are compared. We also compare our method with other angiography methods such as the optical microangiography method (OMAG).15 By using the proposed variance imaging modality, 3-D high-resolution details of both the retina and choroid vessels are reconstructed. The variance/Doppler imaging system was based on a fiber-based interferometer (inset in Fig. 1 ). A low-coherence light with a center wavelength of and FWHM bandwidth of was used. With power out of the sample arm fiber tip and CCD integration time for A-scans, the system benchtop sensitivity was about . A SNR roll-off from zero imaging depth to imaging depth was measured. A background spectral interferogram from the reference arm was recorded in advance of data collection for DC suppression in real-time imaging. The DC-corrected fringe was then interpolated as equally -spaced and Fourier transformed to obtain the complex OCT signals. Fig. 1Flow diagram of the variance/Doppler imaging process (CM, collimator; FL, focusing lens; LCL, low-coherence light source).  Figure 1 shows the signal-processing flowchart for variance/Doppler imaging. Figure 2 shows a fundus image of a male volunteer from a fundus camera. The variance/Doppler imaging protocol includes a fast 3-D scan over an area of by with 128 slices of 2048 A-lines, as highlighted by a dashed window in Fig. 2. The OCT fundus image [Fig. 2] was generated quickly after the 3-D scan and matched well with the fundus image of Fig. 2. In order to better understand the whole process, let us consider a typical B-scan image [Fig. 3 ] as highlighted in Fig. 2. The phase difference of adjacent A-lines was calculated without average [Fig. 3]. The phase difference between any adjacent two A-lines was analyzed by a histogram method to extract the bulk-motion phase [of the ’th A-line compared to the ’th A-line], which was then compensated in the ’th and all its following A-lines. For example, Fig. 3 plots the phase difference between A-line 1600 and A-line 1601 as highlighted in Fig. 3. It was mapped into a histogram distribution [Fig. 3] of 90 equally spaced phase bins between and further smoothed by a 9-bin moving average-filter as Fig. 3, from which the maximum histogram phase is extracted as the bulk-motion phase between the two A-lines. Figure 3 shows the resultant bulk-motion phases of all the A-lines compared to the first A-line (on the left) in Fig. 3. At the same time, the OCT intensity signals were used to analyze the (lateral and axial) sample shift due to motion artifacts and realign the images.10 Cross-correlation between sequential bulk-phase-corrected A-lines was then calculated to achieve the cross-sectional variance image as in Ref. 16: where is the complex OCT signal of the ’th A-line, containing amplitude and phase information of scatters of different depth. Symbol represents the time interval between sequential A-lines, is the power spectrum of Doppler frequency shift, and is the average Doppler frequency shift. The preceding equation suggests that the value of depends on the flow velocity distribution. The Doppler variance image can be used as an indicator of flow turbulences and flow variations that broaden the Doppler-frequency spectrum and result in a larger .Fig. 2(a) Fundus image showing the 3-D variance/Doppler scan over an area of by (within a dashed window); (b) OCT fundus image. 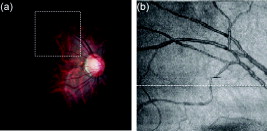 Fig. 3(a) B-scan OCT image as highlighted in Fig. 2; (b) phase difference between adjacent A-lines without average; (c) plot of the highlighted phase difference in 3(b); (d) histogram and (e) smoothed histogram of Fig. 3; (f) accumulated bulk-motion phase of each A-line. Figures 3 and 3 show the variance and ODT images without bulk-motion correction, respectively. Figure 3 shows the corresponding OMAG image. Figures 3 and 3 show the variance and ODT images after bulk-motion correction, respectively. The scale bars represent .  In our experiments, four cross-correlations were averaged [as in Eq. 1], and a simple Wiener filter was applied to obtain the variance image. The phase-resolved Doppler image was calculated by averaging four adjacent A-lines. Figures 3 and 3 show the corresponding variance image and Doppler image without bulk-motion phase correction, respectively. Motion artifacts were evident in these two figures. By applying the proposed histogram-based analysis and bulk-motion correction, one can clearly notice the improved background suppression in both the variance and Doppler images [Figs. 3 and 3]. For comparison, Fig. 3 shows an OMAG image of the same location where we slightly deviated the scanner to introduce a positive lateral modulation and digitally generated a negative modulation for bidirectional flow detection.15 Proper selection of the lateral modulation frequency is critical to optimize the OMAG imaging quality while minimizing the OMAG background noise. The modulation frequency sets a physical threshold so that only vessels of higher enough Doppler frequency shift (than the threshold) can be differentiated as an OMAG signal. This may induce vessel size underestimation. However, if the modulation frequency is low (compared to the tissue lateral bandwidth), the tissue background noise will become evident, as one can see in Fig. 3. Compared to the ODT images in Figs. 3 and 3, variance imaging in Figs. 3 and 3 show better contrast for choroid vessels of high flow velocities (relative to the probe direction). While the Doppler signals suffer greatly from the dramatically wrapped Doppler phases and give low contrast for these choroid vessels, variance imaging is less affected by Doppler phase wrapping and can still generate a bright variance image. Note that variance imaging is highly sensitive to the relative phase variation between adjacent A-lines. For low flow velocity, both the variance and Doppler signals will become weak. Proper selection of the software threshold is necessary to avoid vessel diameter underestimation. For the labeled vessels in Figs. 3 to 3, the estimated vessel sizes are , and , respectively. By combining all the 128 B-scan images, a 3-D variance tomography of the scanned area is shown in Fig. 4 , which clearly shows the reconstruction of the vasculature in both the retina and choroid layers. Figure 4 shows a top view of the 3-D variance reconstruction, and Fig. 4 shows a color-coded variance image where the retina vessels are coded with orange and the choroid ones with blue-green. Figure 4 gives a 3-D Doppler reconstruction of the vasculature from which one can notice the Doppler flow “artifact” in some vessels due to the Doppler angle change (labeled 1) and the pulsatile nature of the blood flow (labeled 2). Figures 4 and 4 show the results of 3-D OMAG for comparison. We noticed that OMAG imaging may also suffer from the pulsatile artifact when the flow Doppler frequency goes below or close to the lateral modulation (threshold) frequency, as one can see in Figs. 4 and 4. Variance images shown in Figs. 3 and 4 do contain speckle-like noises, which are mainly due to the heterogeneous tissue characteristic. The variance image quality may be further improved by a denser scan or the introduction of an “ideal tissue background,” as in Ref. 14. Both the OMAG and variance images shown here are without image enhancement or other digital imaging processing. Fig. 4Three-dimensional angiography of the human eye by different imaging modalities: (a) top view (projection) of 3-D variance imaging; (b) color-coded variance image. Figure 4 shows the 3-D ODT image, and Figs. 4 and 4 show the top view and color-coded results from 3-D OMAG. 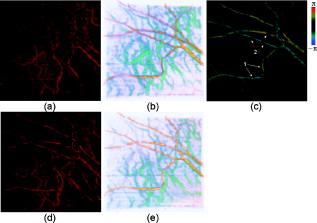 Note that histogram analysis works well for bulk-motion artifact correction in cases where the tissue accounts for most of the pixels in A-line images. In case this assumption does not hold—for example, when retinal blood vessels around the optical nerve head (ONH) account for most of the pixels in the A-line image or when the vessel position is close to the bottom of the imaging window—histogram analysis will give a wrong estimation of the tissue bulk motion.18 To solve this problem, a preliminary OCT variance image (without bulk-motion phase correction) can still be useful to differentiate the tissue and blood vessel; then the velocity/phase histogram analysis is performed based only on those selected tissue pixels of relatively small variance values. Also note that the histogram-based analysis assumes no relative motion inside the tissue structures of the same A-scan and will not correct heterogeneous motion artifact of the tissue due to vessel elasticity or other factors. In summary, we have demonstrated that variance imaging can be used for in vivo 3-D angiography of the human retina and choroid. The dual variance/Doppler imaging modality was developed based on a high-speed functional Fourier domain optical coherence tomography system. It was also shown that variance imaging is subject to bulk-motion artifacts as in phase-resolved Doppler imaging, and we have used a histogram-based analysis for bulk-motion correction. In vivo experimental results showed that the proposed system can provide comparable results to other imaging modalities. It does not require lateral modulation of the scanner and is simple to implement. AcknowledgmentsThis work is supported by the National Institutes of Health (EB-00293, NCI-91717, RR-01192) and the Air Force Office of Science Research (FA9550-04-1-0101). Support from the Beckman Laser Institute Inc. Foundation is also gratefully acknowledged. ReferencesD. Huang,
E. A. Swanson,
C. P. Lin,
J. S. Schuman,
W. G. Stinson,
W. Chang,
M. R. Hee,
T. Flotte,
K. Gregory,
C. A. Puliafito, and
J. G. Fujimoto,
“Optical coherence tomography,”
Science, 254 1178
–1181
(1991). https://doi.org/10.1126/science.1957169 0036-8075 Google Scholar
Z. Chen,
T. E. Milner,
D. Dave, and
J. S. Nelson,
“Optical Doppler tomographic imaging of fluid flow velocity in highly scattering media,”
Opt. Lett., 22 64
–66
(1997). https://doi.org/10.1364/OL.22.000064 0146-9592 Google Scholar
Z. Chen,
T. E. Milner,
S. Srinivas,
X. J. Wang,
A. Malekafzali,
M. J. C. van Gemert, and
J. S. Nelson,
“Noninvasive imaging of in vivo blood flow velocity using optical Doppler tomography,”
Opt. Lett., 22 1119
–1121
(1997). https://doi.org/10.1364/OL.22.001119 0146-9592 Google Scholar
J. A. Izatt,
“In vivo bidirectional color Doppler flow imaging of picoliter blood volumes using optical coherence tomography,”
Opt. Lett., 22 1439
–1441
(1997). https://doi.org/10.1364/OL.22.001439 0146-9592 Google Scholar
M. D. Kulkarni,
T. G. van Leeuwen,
S. Yazdanfar, and
J. A. Izatt,
“Velocity-estimation accuracy and frame-rate limitations in color Doppler optical coherence tomography,”
Opt. Lett., 23 1057
–1059
(1998). https://doi.org/10.1364/OL.23.001057 0146-9592 Google Scholar
Y. Zhao,
Z. Chen,
C. Saxer,
S. Xiang,
J. de Boer, and
J. Nelson,
“Phase resolved optical coherence tomography and optical Doppler tomography for imaging blood flow in human skin with fast scanning speed and high velocity sensitivity,”
Opt. Lett., 25 114
–116
(2000). https://doi.org/10.1364/OL.25.000114 0146-9592 Google Scholar
Z. Chen,
Y. Zhao,
S. M. Srivivas,
J. Nelson,
N. Prakash, and
R. Frostig,
“Optical Doppler tomography,”
IEEE J. Sel. Top. Quantum Electron., 5 1134
–1142
(1999). https://doi.org/10.1109/2944.796340 1077-260X Google Scholar
R. A. Leitgeb,
L. Schmetterer,
W. Drexler,
A. F. Fercher,
R. J. Zawadzki, and
T. Bajraszewski,
“Real-time assessment of retinal blood flow with ultrafast acquisition by color Doppler Fourier domain optical coherence tomography,”
Opt. Express, 11 3116
–3121
(2003). 1094-4087 Google Scholar
B. R. White,
M. C. Pierce,
N. Nassif,
B. Cense,
B. Park,
G. Tearney,
B. Bouma,
T. Chen, and
J. de Boer,
“In vivo dynamic human retinal blood flow imaging using ultra-high-speed spectral domain optical Doppler tomography,”
Opt. Express, 11 3490
–3497
(2003). 1094-4087 Google Scholar
S. Makita,
Y. Hong,
M. Yamanari,
T. Yatagai, and
Y. Yasuno,
“Optical coherence angiography,”
Opt. Express, 14
(17), 7821
–7840
(2006). https://doi.org/10.1364/OE.14.007821 1094-4087 Google Scholar
Y. Yasuno,
Y. Hong,
S. Makita,
M. Yamanari,
M. Akiba,
M. Miura, and
T. Yatagai,
“In vivo high-contrast imaging of deep posterior eye by swept source optical coherence tomography and scattering optical coherence angiography,”
Opt. Express, 15 6121
–6139
(2007). https://doi.org/10.1364/OE.15.006121 1094-4087 Google Scholar
R. K. Wang and
Z. H. Ma,
“Real-time flow imaging by removing texture pattern artifacts in spectral-domain optical Doppler tomography,”
Opt. Lett., 31
(20), 3001
–3003
(2006). https://doi.org/10.1364/OL.31.003001 0146-9592 Google Scholar
M. Szkulmowski,
A. Szkulmowska,
T. Bajraszewski,
A. Kowalczyk, and
M. Wojtkowski,
“Flow velocity estimation using joint spectral and time domain optical coherence tomography,”
Opt. Express, 16
(9), 6008
–6025
(2008). https://doi.org/10.1364/OE.16.006008 1094-4087 Google Scholar
R. K. Wang and
L. An,
“Doppler optical micro-angiography for volumetric imaging of vascular perfusion in vivo,”
Opt. Express, 17 8926
–8940
(2009). https://doi.org/10.1364/OE.17.008926 1094-4087 Google Scholar
R. K. Wang,
S. L. Jacques,
Z. Ma,
S. Hurst,
S. R. Hanson, and
A. Gruber,
“Three-dimensional optical angiography,”
Opt. Express, 15
(7), 4083
–4097
(2007). https://doi.org/10.1364/OE.15.004083 1094-4087 Google Scholar
Y. Zhao,
Z. Chen,
C. Saxer,
S. Xiang,
J. de Boer, and
J. Nelson,
“Doppler standard deviation imaging for clinical monitoring of in vivo human skin blood flow,”
Opt. Lett., 25 1358
–1360
(2000). https://doi.org/10.1364/OL.25.001358 0146-9592 Google Scholar
L. Wang,
Y. Wang,
S. Guo,
J. Zhang,
M. Bachman,
G. Li, and
Z. Chen,
“Frequency domain phase-resolved optical Doppler and Doppler variance tomography,”
Opt. Commun., 242 345
–350
(2004). https://doi.org/10.1016/j.optcom.2004.08.035 0030-4018 Google Scholar
B. Rao,
L. Yu,
H. K. Chiang,
L. C. Zacharias,
R. M. Kurtz,
B. D. Kuppermann, and
Z. Chen,
“Imaging pulsatile retinal blood flow in human eye,”
J. Biomed. Opt., 13 040505
(2008). https://doi.org/10.1117/1.2967986 1083-3668 Google Scholar
|


