|
|
|
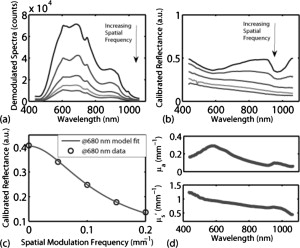
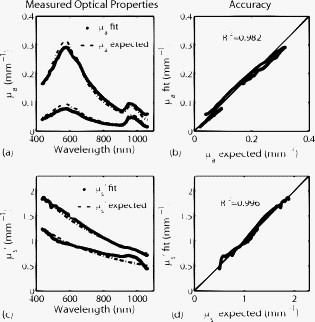
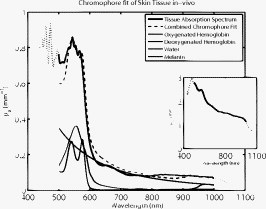
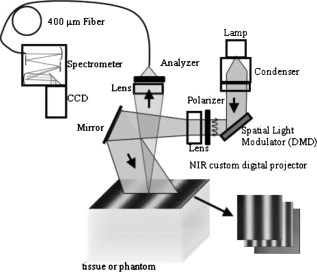
Optical spectroscopy can be a useful tool for characterizing turbid media such as biological tissue. Specifically, intrinsic absorption and scattering as deduced using spectroscopic techniques can be used to report distinct physiological, chemical, and structural properties of the biological sample. Absorption can be used to quantify concentrations of oxy- and deoxyhemoglobin, water, and melanin in tissue. Scattering is sensitive to cellular components as well as cellular and extracellular structures. Numerous optical approaches exist for extracting spectroscopic information from tissue. Generally speaking, current quantitative methods for optical property determination include integrating sphere techniques, which rely on reflectance and transmission measurements of thin sections of excised tissue,1 and reflectance techniques based on point sources and detectors,2, 3, 4 which aim to characterize the spatial, temporal, and/or spectral dependence of the reflectance. Each approach typically relies on some means to derive information from measured signals. Such approaches include empirical lookup table–based calibration using a representative set of reference phantoms with known properties,3 and model-based analysis based on either analytic approximations (such as diffusion theory),4 or transport-based Monte Carlo simulations (typically from tabulated simulations that have been precomputed).2 Recent hybrid methods combine broadband reflectance and frequency (time) domain measurements to achieve high-resolution absorption and scattering spectra from a single source–detector configuration.4 Emerging spectral imaging approaches aim to extend these quantitative capabilities toward resolving spatially the in vivo tissue composition.5 Last, a recent method based on noncontact wide-field imaging utilizes spatial frequency domain (SFD) modulated reflectance data to extract spatially resolved maps of optical properties and chromophores from in vivo data.6 Generally speaking, most of these techniques have been applied over relatively small sections of the visible/near-infrared (Vis/NIR) spectrum.1, 2, 3, 4 In this paper, we present an initial investigation of a new SFD configuration with the goal of extracting absolute optical properties from both tissue-simulating phantoms and in vivo tissue that spans both the visible and near-infrared wavelength regimes. While previously reported SFD techniques have focused on wide-field quantitative imaging at several, discrete wavelengths, we execute an SFD method using a relatively small spatial region ( spot size) with full spectral detail. The principles underlying the extraction of absorption and reduced scattering coefficient values using an SFD approach have recently been detailed elsewhere.6 In general, this approach quantifies the effective modulation transfer function (MTF) of a diffuse optical system, which in this case is the turbid sample under test, and relates this function in terms of contributions of absorption and scattering. Figure 1 shows a schematic of the Spatially modulated quantitative spectroscopy (SMoQS) instrument used for this particular investigation. A tungsten-halogen lamp (Newport Optics) served as the broadband projection illumination source. This light was delivered to a digital micromirror device (DMD) (DLP Developers Kit, Texas Instruments) via an integrating rod-based “light engine” that was taken from a commercial DLP projector. The DMD is then imaged onto the surface of the target medium, resulting in a projection field of view of . Collection optics capture light remitted from a -diam center subsection of the illuminated region. These optics couple light collected from this region to the distal tip of a detector fiber. We chose to work with a subsection since it was achievable and significantly smaller than the period of the highest spatial frequency of illumination used. A detailed exposition of collection spot versus spatial frequency will be part of future work. The diffusely reflected light collected from the sample is then delivered to a tunable Oriel spectrograph (Model No. 77480), tuned to a wavelength range of , with a resolution of . A , TEC-cooled CCD (Instaspec IV, Oriel) was used as the detector. Crossed -diam wire-grid polarizing filters were used to reject specular reflection from the surface of the sample. The polarizer was inserted between the DMD and projection optics, and the analyzer was placed between the fiber and collection optics. For all samples measured in this initial investigation, 15 illumination patterns based on two-dimensional (2-D) sinusoids similar to that illustrated in Fig. 1 were used to characterize the samples. The spatial frequency of patterns spanned from in steps of . Using a modulation/demodulation scheme as has been described by Cuccia, 6 each specific spatial frequency was projected three times, each with a phase shift of 0, 120, and . The integration time for the spectrometer CCD was determined for each specific sample to optimize signal to noise and, although not optimized for light throughput, varied , depending on sample optical properties. While a complete data acquisition cycle under these conditions initially required several minutes, light throughput has subsequently been substantially improved, suggesting that a complete measurement sequence can be acquired in a few seconds. Data were acquired three times for each projected phase in order to further reduce noise. The raw spectral data were stored for each projection pattern and each phase. A reference calibration measurement was acquired from a liquid reference sample having known optical properties. This step is necessary in order to characterize the inherent MTF of the instrument. Whereas previously published experiments utilizing this technique measured sequences of reflectance from a single wavelength across multiple pixels, in the SMoQS configuration, the entire broadband reflectance is measured for a single “pixel.” This particular approach allows for a far greater wavelength range to be measured; however, it is at the expense of imaging capabilities. In this case, a full broadband spectrum is collected for every spatial frequency and phase. The broadband reflectance is then demodulated to extract the AC component of the detected light: resulting in the broadband AC reflectance for a given sample as a function of spatial frequency [Fig. 2 ]. Here, denotes the measured reflectance spectrum at the three projected phases, . Through the use of a reference phantom having known optical properties, the data can be calibrated and given units of absolute reflectance [Fig. 2]. Here, the highest trace corresponds to data acquired at a spatial frequency of (i.e., planar illumination) and the lowest corresponds to data acquired at a spatial frequency of . Notice that as the spatial frequency increases, the absorption band, which appears as a dip in the reflectance spectrum at , becomes less apparent. This is in agreement with observations of decreasing absorption contrast with increasing spatial frequency as reported by Cuccia 6 At each wavelength, the reduction in AC reflectance amplitude as a function of spatial frequency (i.e., the effective MTF) can then be modeled and analyzed via Monte Carlo–based simulations [Fig. 2] via discrete Hankel transformation of point-source reflectance predictions.6 From this model, the contributions of absorption and scattering can be identified at each wavelength independently, resulting in broadband spectra without the use of spectral constraints or assumed power-law dependence for reduced scattering [Fig. 2]. Unlike diffusion-based models, this approach is not inherently limited by albedo or frequency range. For modeling purposes, we assumed an anisotropy value of 0.7 (and ) for the Intralipid phantoms and 0.9 (and ) for skin.Fig. 2(a) An example of raw demodulated spectra, , collected from a tissue-simulating liquid phantom containing nigrosin, Intralipid, and water; (b) reflectance calibrated by the reference phantom measurement; (c) the diffuse MTF, shown at in this example; and (d) the resultant absorption and reduced scattering spectra.  To demonstrate the ability of SMoQS to accurately recover optical properties, a series of homogeneous liquid phantoms was prepared. Since it has been well characterized in terms of optical properties, Intralipid (20%, Fresenius Kabi) was used as the scattering agent within the phantom.7 For our studies, multidistance frequency domain photon migration (FDPM) measurements8 were also performed to validate these values within , independently confirming that the prepared phantoms match the expected scattering values that were determined analytically using the method proposed by van Staveren 7 For simplicity and experimental control, a single dye was used as the primary absorbing agent in the liquid phantom. In this initial investigation, water-soluble nigrosin (Sigma Aldrich) was chosen as the absorber due to its broad spectral profile over the wavelength range of interest, allowing for a large dynamic range of absorption values to be measured in a single phantom. Moreover, the distribution of these values grossly mimics distributions that might be encountered in tissue—namely, a broad absorption peak in the visible and low absorption in the near infrared. The spectral line shape and quantitative absorption values of each nigrosin solution was measured, in the specific concentrations used in the liquid phantoms without any scatterer present, and confirmed using a spectrophotometer (Shimadzu UV-3600) over the entire wavelength range of interest. Three phantoms were made, each designed with unique sets of optical properties. Two of these were treated as investigational samples. The first of these was a high-albedo phantom, designed to have absorption and reduced scattering values ranges of [0.01–0.1] and , respectively, whereas the second phantom had a low albedo with absorption between and reduced scattering in the range . These ranges extend well beyond expected values in the NIR, although they remain conservative relative to values expected in the visible regime. The optical properties of the third phantom were chosen to fall between those of the two test phantoms, and . This was used as a reference calibration to characterize the system MTF and spectral throughput. Figure 3 shows the extracted optical properties for the two liquid phantoms. In Fig. 3, the recovered absorption spectra for the low- and high-albedo phantoms are plotted along with the known concentrations of nigrosin and water used in the preparation of the phantoms. These absorption values were determined by the SMoQS method at each wavelength independently, yet faithfully produce the expected spectra, even in spectral regions where the source illumination and system throughput were weak, (i.e. and ). Similar results were produced for the quantitative determination of reduced scattering coefficient [Figs. 3]. The recovery of optical properties was also successful as a function of the magnitudes of the expected values [Figs. 3 and 3]. This technique demonstrates a highly linear response across the range expected optical properties tested, resulting in values of 0.985 and 0.996 for absorption and scattering, respectively. Fig. 3Optical properties of high and low albedo phantoms. (a) Measured and expected absorption spectra, (b) accuracy between expected and measured absorption values, (c) measured and expected reduced scattering spectra, and (d) accuracy between expected and measured reduced scattering.  For demonstration of basic feasibility, a measurement on in vivo human tissue was also collected. In this particular case, a subject’s volar forearm was placed under the projection illumination and light was specifically collected from a region of tissue that contained a large vein (IRB study protocol no. 1996-200). Using the same reference phantom that was employed in the liquid phantom experiment, absorption and reduced scattering spectra were extracted, as shown in Fig. 4 . The absorption spectrum was then fit in a linear least-squares sense to a basis set of spectra that included oxy- and deoxyhemoglobin, water, and melanin.9 Since the signal-to-noise ratio (SNR) of the system was particularly weak at the spectral limits of this measurement, this fit was performed only over a range of . The measured spectrum of skin was qualitatively well described by these physiologically relevant chromophores. The resulting quantitative contribution of each specific chromophore is in agreement with typical values for this type of tissue. These fits produced concentration values for oxy- and deoxyhemoglobin of 22.4 and , which are within ranges of values cited elsewhere for skin.10 Additionally, it was determined that 70.2% of the volume probed comprised water and 0.51% was melanin.11 Whereas it is acknowledged that skin is not a homogeneous medium and that the distribution of chromophores are depth selective, to first approximation, these results remain encouraging and opportunities remain for further layer-based modeling of SMoQS.12 Fig. 4Measured absorption spectrum from the volar forearm. The dotted lines indicate spectral regions of low SNR in the measured spectra. The dashed line represents the combined chromophore fit to the measured spectra, and the scaled chromophore components are plotted underneath. The subplot displays the corresponding reduced scattering spectrum for this particular measurement.  We have provided a first demonstration of a new embodiment of SFD sampling in turbid media that is capable of characterizing optical properties over the range , with resolution. Utilizing an SFD platform for quantitative spectroscopy is attractive not only for its ability to characterize turbid media across a very broad range of wavelengths, but also because the requisite instrumentation is relatively low in cost, noncontact, and simple to implement. The inherent flexibility of this approach allows for the tuning of the system for targeting specific wavelength regimes, permitting it to be used in a wide range of initial investigations. With the addition of scanning optics at the detection fiber, mapping of optical properties can be performed over the entire region of tissue illuminated by the projected patterns. Spectral preconditioning of the source illumination would also help balance the dynamic range of detected, wavelength-dependent reflectance, allowing for improved SNR in both spectral regions where absorption is characteristically strong as well as compensating for limitations in the spectral dependence in the systemic instrument function. Through a more careful consideration of the optical design of the system, substantial improvements to light throughput and acquisition time may be achieved. Subsequent to the experiments discussed here, a -fold improvement in acquisition time has been achieved through the use of more efficient light collecting optics at the detector fiber. The in vivo demonstration of the technique provides compelling evidence that the extracted absorption spectrum is well described by typical chromophores present in skin tissue. This analysis, however, was performed using a model that assumes that chromophores are homogeneously distributed in tissue. In reality, skin is heterogeneous on the scale of the interrogation volume of the device used here. Tissue interrogation over a broad wavelength range will provide depth-dependent contrast to tissue chromophore species and structures, ranging from submillimeter probing depths in the visible to depth sensitivity of many millimeters in the near infrared. Further investigation and modeling of this differential volume effect will be necessary prior to claims of robust quantitation of optical properties in layered media.12 While this proof-of-principle study has demonstrated the feasibility of this approach as a platform for broad spectral range optical characterization, more work needs to be performed to test the limits of this technique. These initial measurements, however, illustrate basic capabilities of SMoQS as a technique for quantifying optical properties in both visible and near infrared. It is able to characterize these optical properties without any a priori assumption and perform these measurements in a noncontact paradigm conducive to in vivo characterization of tissue. AcknowledgmentsThe authors gratefully acknowledge funding provided by the NIH NCRR Biomedical Technology Research Center (LAMMP: 5P-41RR01192), the Military Photomedicine Program, AFOSR Grant No. FA9550-08-1-0384, and the Beckman Foundation. ReferencesC. R. Simpson,
M. Kohl,
M. Essenpreis, and
M. Cope,
“Near-infrared optical properties of ex vivo human skin and subcutaneous tissues measured using the Monte Carlo inversion technique,”
Phys. Med. Biol., 43 2465
–2478
(1998). https://doi.org/10.1088/0031-9155/43/9/003 0031-9155 Google Scholar
G. M. Palmer and
N. Ramanujam,
“Monte Carlo based inverse model for calculating tissue optical properties. Part 1, theory and validation on synthetic phantoms,”
Appl. Opt., 45
(5), 1062
–1071
(2006). https://doi.org/10.1364/AO.45.001062 0003-6935 Google Scholar
N. Rajaram,
T. H. Nguyen, and
J. W. Tunnell,
“A lookup-table based inverse model for measuring optical properties of turbid media,”
J. Biomed. Opt., 13
(5), 050501
(2008). https://doi.org/10.1117/1.2981797 1083-3668 Google Scholar
S. H. Tseng,
A. Grant, and
A. J. Durkin,
“In vivo determination of skin near-infrared optical properties using diffuse optical spectroscopy,”
J. Biomed. Opt., 13 014016
(2008). https://doi.org/10.1117/1.2829772 1083-3668 Google Scholar
S. C. Gebhart,
R. C. Thompson, and
A. Mahadevan-Jansen,
“Liquid-crystal tunable filter spectral imaging for brain tumor demarcation,”
Appl. Opt., 46 1896
–1910
(2007). https://doi.org/10.1364/AO.46.001896 0003-6935 Google Scholar
D. J. Cuccia,
F. Bevilacqua,
A. J. Durkin,
F. R. Ayers, and
B. J. Tromberg,
“Quantitation and mapping of tissue optical properties using modulated imaging,”
J. Biomed. Opt., 14
(2), 024012
(2009). https://doi.org/10.1117/1.3088140 1083-3668 Google Scholar
H. J. van Staveren,
C. J. M. Moes,
J. van Marie,
S. A. Prahl, and
M. J. C. van Gemert,
“Light scattering in Intralipid-10% in the wavelength range of ,”
Appl. Opt., 30
(31), 4507
–4514
(1991). https://doi.org/10.1364/AO.30.004507 0003-6935 Google Scholar
R. C. Haskell,
L. O. Svaasand,
T. Tsay,
T. Feng,
M. S. McAdams, and
B. J. Tromberg,
“Boundary conditions for the diffusion equation in radiative transfer,”
J. Opt. Soc. Am. A, 11
(10), 2727
–2741
(1994). https://doi.org/10.1364/JOSAA.11.002727 0740-3232 Google Scholar
M. Kobayashi,
Y. Ito,
N. Sakauchi,
I. Oda,
I. Konishi, and
Y. Tsunazawa,
“Analysis of nonlinear relation for skin hemoglobin imaging,”
Opt. Express, 9
(13), 802
–812
(2001). https://doi.org/10.1364/OE.9.000802 1094-4087 Google Scholar
I. Nishidate,
Y. Aizu, and
H. Mishina,
“Estimation of melanin and hemoglobin in skin tissue using multiple regression analysis aided by Monte Carlo simulation,”
J. Biomed. Opt., 9
(4), 700
–710
(2004). https://doi.org/10.1117/1.1756918 1083-3668 Google Scholar
J. R. Weber,
D. J. Cuccia,
A. J. Durkin, and
B. J. Tromberg,
“Non-contact imaging of absorption and scattering in layered tissue using spatially-modulated structured light,”
J. Appl. Phys., 105 102028
(2009). https://doi.org/10.1063/1.3116135 0021-8979 Google Scholar
|


