|
|
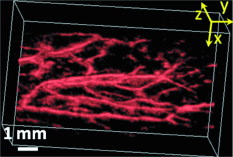
1.IntroductionDue to the requirement for both high imaging speed and noninvasiveness, it remains challenging to precisely image and quantify human physiological dynamics in vivo in real time. Magnetic resonance imaging (MRI) provides good functional imaging capability, but it usually cannot perform real-time imaging.1 Ultrasound offers real-time imaging capability, but the mechanical contrast does not provide much physiological information besides flow.2 Previously available high-resolution optical microscopy modalities—including confocal microscopy,3 two-photon microscopy,4 and optical coherence tomography5—are capable of real-time imaging. However, as none of them sense optical absorption directly, contrast agents are usually required for physiological imaging. Moreover, they rely on the detection of ballistic photons, and thus cannot image beyond one optical transport mean free path in highly scattering biological tissue . Photoacoustic tomography is a recently developed, noninvasive biomedical imaging technology that provides excellent optical absorption contrast—endogenous contrast for many physiological phenomena—with high ultrasonic resolution at superdepths—depths beyond the optical transport mean free path.6 It has been used to study whisker stimulation,7 single vessel oxygenation,8 and tumor hypoxia.9 Photoacoustic tomography is also a high-speed imaging modality by nature, with its speed fundamentally limited by the photoacoustic wave propagation time. In principle, A-lines (i.e., depth resolved 1-D images) can be acquired at a rate of up to at a depth of . With a ultrasound array and a kilohertz repetition laser system, we have developed a photoacoustic microscopy imaging system that performs real-time B-scan imaging at and high-speed 3-D imaging, offering the feasibility of imaging physiological dynamics.10, 11, 12 In addition, this ultrasound-array-based photoacoustic microscopy (UA-PAM) system, with axial, lateral, and elevational resolutions of 25, 70, and , respectively, provides imaging depth in scattering biological tissue.10 In this paper, with system refinement, we report significant improvement in the image quality of UA-PAM, which enabled the imaging of microvasculature details in rats and humans. In addition, the B-scan imaging temporal resolution offered the capability to noninvasively monitor human pulsatile dynamics—including arterial pulsatile motion and changes in hemoglobin concentration—in vivo. To our knowledge, this is the first demonstration of real-time photoacoustic imaging of human physiological dynamics. 2.Methods and MaterialsThe system configuration is shown in Fig. 1 . The details of the system can be found in our previous publications.10, 11, 12 In this paper, to excite photoacoustic waves, we used light at , which corresponds to an isosbestic point where oxy- and deoxyhemoglobin molecules have the same molar optical absorption coefficient. Fig. 1Schematic of the refined UA-PAM system. Inset A, optical illumination pattern on the skin surface.  To couple the generated photoacoustic waves to the ultrasound-array transducer, we used a water container (filled with deionized water) with a window of low-density polyethylene (LDPE) film, to substitute for the water-filled transparent plastic piece in our previous system.10 As a result, the skin surface was not directly contacted by the scanning probe during the experiments, and disturbance to the imaged object was minimized. As before, acoustic gel was used to improve the ultrasonic coupling between the skin surface and the LDPE film. Compared with the previous system, the chances for air-bubble generation in the gel during the mechanical scanning (for 3-D imaging) of the probe were significantly reduced, as both the skin and the film were static. Furthermore, the number of optical interfaces was reduced, which increased the light delivery efficiency. Fine-tuning of the light delivery was performed10 to optimize the system’s SNR. All animal and human experiments described here were carried out in compliance with Washington University approved protocols. To validate the refined UA-PAM system, Sprague Dawley rats (Harlan Laboratories, Inc., Indianapolis, Indiana) were imaged. Intradermal injection of a mixture of ketamine and xylazine was used for anesthesia. Before photoacoustic imaging, the hair in the imaged region was removed with commercial depilatory lotion. The UA-PAM system is also safe for human use. For human imaging, the optical fluence on the skin surface was set to per pulse, well below the ANSI13 recommended maximum permissible exposure (MPE) of for a single pulse in the visible spectral range. For of continuous real-time B-scan imaging (at ), 3000 laser pulses were delivered to the skin surface, corresponding to a time-averaged light intensity of , below the ANSI recommended MPE of , calculated by . For 3-D imaging, the laser pulse repetition rate was increased to . However, in this case, the total illuminated area was also increased due to the mechanical scanning of the probe, resulting in a time-averaged light intensity of , below the ANSI safety standard based on the same calculation. 3.ResultsAn in vivo photoacoustic maximum amplitude projection (MAP) image—the maximum photoacoustic amplitudes projected along the depth direction to the skin surface—of a rat [Fig. 2 ] weighing is shown in Fig. 2. Compared with previous results,10 more microvasculature details were imaged with the refined UA-PAM system. Figure 2 is a B-scan image corresponding to the dashed line in Fig. 2, showing subcutaneous blood vessels at various depths up to below the rat’s skin surface. The imaged blood vessels are of diameters of . To view the vasculature from different perspectives, a 3-D animation (Video 1 ), showing blood vessels in different layers, was constructed with VolView (Kitware, Clifton Park, New York). More features, including rotation, scaling, and zooming, are available with the software. Fig. 2Noninvasive in vivo photoacoustic images acquired by the refined UA-PAM system. (a) Photograph of a Sprague Dawley rat with hair removed before photoacoustic imaging, where represents the beamforming (B-scan) direction, represents the mechanical scanning direction, and represents the depth direction. The dashed rectangle indicates the imaged area. (b) Photoacoustic MAP image of the rat. The gray-scale represents relative optical absorption. (c) Photoacoustic B-scan image corresponding to the dashed horizontal line in (b), showing the depths of the blood vessels: SK, skin surface. Numbers 1 to 5 indicate corresponding blood vessels in (b) and (c). (d) Photograph of a human hand. The dashed rectangle indicates the imaged area. (e) Photoacoustic MAP image of the hand. (f) Photoacoustic B-scan image corresponding to the dashed horizontal line in (e). Numbers 1 to 4 indicate corresponding blood vessels in (e) and (f).  To demonstrate the feasibility of human imaging with UA-PAM, we imaged the palm of a human hand [Fig. 2]. The subcutaneous microvasculature of the hand was imaged with a quality comparable to that of the aforementioned rat images. The imaged blood vessels in the human hand are larger though, ranging from [Fig. 2]. The depths of the blood vessels were clearly shown in the B-scan image [Fig. 2]. Subcutaneous blood vessels up to deep were imaged in this case. Due to the overlap, some relatively small blood vessels are not well shown in the MAP image. However, these vessels, along with the layered vascular structures, are clearly seen in the 3-D animation (Video 2 ). 10.1117/1.3333545.2To study the pulsatile dynamics, we scanned a region of the palm near the wrist, where an apparent artery, in diameter and over deep, was imaged [Fig. 3 ]. After acquiring the initial 3-D image, we fixed the scanning probe to perform 10-s real-time B-scan imaging across the artery [Fig. 3 and Video 3 ]. Due to the strong optical absorption of hemoglobin at (absorption coefficient ), the bottom part of the artery was not well imaged. But the motion dynamics of the arterial pulsation was clearly captured. An M-mode image across the center of the artery, showing the details of the pulsatile motion, is shown in Fig. 3. The pulsatile rate, estimated from the image, was , consistent with the rate measured from a pulse oximeter. For comparison, an M-mode image of a vein was plotted in Fig. 3, from which weak motion of the vein was revealed. Presumably, the motion was due to artery-pulsation-induced skin movement (observable in Video 3). As seen from Fig. 3, the vein’s motion was indeed weakly correlated with the artery pulsation. However, compared with the artery [Fig. 3], the vein’s motion was much weaker. Fig. 3Dynamic noninvasive in vivo photoacoustic imaging by the refined UA-PAM system: (a) In vivo 3-D photoacoustic image of a human hand, the dashed line indicates the cross section monitored by real-time B-scan imaging; (b) one B-scan image corresponding to the dashed horizontal line in (a), SK, skin surface; (c) M-mode image corresponding to the dotted vertical line in (b), showing the arterial pulsatile motion as a function of time; and (d) M-mode image of a vein corresponding to the dotted vertical line in (b).  To supplement tissue structural information, and to validate the observed artery motion, we acquired ultrasound images of similar regions using a commercial ultrasound machine (iU22 with a L15-7io Compact Linear Array, Philips Healthcare, Andover, Massachusetts). The ultrasound transducer, covering frequencies , provides sufficient resolution to resolve the artery that was photoacoustically imaged. In the ultrasound images, it was interesting to see that the artery only expanded apparently in the direction normal to the skin surface (Video 4 ). In the direction parallel to the skin surface, the expansion was almost negligible. This type of motion was likely due to the anisotropy of the surrounding tissue structure, namely, the surrounding tissue can be more easily stretched perpendicularly to the skin surface than parallelly to the skin surface. The observed motion in the ultrasound images was consistent with the result seen in real-time photoacoustic imaging, where apparent motion was observed only in the skin’s normal direction. In addition, the M-mode images acquired with our UA-PAM system agreed well with those acquired by the commercial ultrasound machine, which, however, did not show as much fine details as the UA-PAM system did. Video 4Ultrasound images of the arterial pulsation. The upper panel shows B-mode images, while the bottom one shows M-mode images corresponding to the vertical line in the upper panel (QuickTime, ).  4.Discussion and ConclusionsOne drawback of ultrasound imaging is that little physiological information besides flow can be provided. By contrast, photoacoustic imaging has the potential to offer both hemoglobin concentration and oxygen saturation information. Ideally, to better characterize the pulsatile hemodynamics, oxygen saturation should be measured within each cardiac cycle. However, accurate computation of the blood oxygenation in real-time requires photoacoustic imaging with laser-wavelength tunability in real time (because oxygenation quantification requires multiwavelength measurements), which is currently not available in our laser system. Fortunately, the change in hemoglobin concentration can be monitored already with UA-PAM. Although the arterial pulsatile motions were apparent [Fig. 3 and Video 3], we found that the hemoglobin concentration was approximately constant with time—the standard deviation of the signal normalized by the temporal maximum value was 0.02. We also studied the hemoglobin concentration dynamics of a vein, which showed similar results. This observation agreed with the fact that, under normal physiological conditions, the hemoglobin concentration does not change significantly. A few factors—including hemoglobin concentration, oxygenation, and vessel diameter and position—can potentially affect the magnitude (instead of position) of the received photoacoustic signal; in general, they may not be decoupled easily. In this study, however, we believe that any observable change in the magnitude of the signal, if any, would be due primarily to the hemoglobin concentration variation. Conversely, the lack of such change in the observable signal suggests that the hemoglobin concentration was approximately constant. Our reasoning is as follows.
In summary, our refined UA-PAM system performed high-speed in vivo imaging of microvasculature details in both rats and humans with improved quality. With this UA-PAM system, hemoglobin concentration dynamics and arterial pulsatile motion were captured in real time, for the first time to our knowledge. With the promising results shown in this study, we believe that UA-PAM will open up many new possibilities for studying functional and physiological dynamics in both preclinical and clinical imaging settings. AcknowledgmentsThis work was sponsored in part by National Institutes of Health Grants U54 CA136398 (NTR), R01 EB000712, R01 NS46214 (BRP), and R01 EB008085. L.W. has a financial interest in Microphotoacoustics, Inc., and Endra, Inc., which, however, did not support this work. The authors are grateful to Christopher Favazza, Chulhong Kim, Joon-Mo Yang, Song Hu, and Todd Erpelding for beneficial discussions. They also thank Professor Jim Ballard for careful proofreading. ReferencesR. M. Heidemann,
O. Ozsarlak,
P. M. Parizel,
J. Michiels,
B. Kiefer,
V. Jellus,
M. Muller,
F. Breuer,
M. Blaimer,
M. A. Griswold, and
P. M. Jakob,
“A brief review of parallel magnetic resonance imaging,”
Eur. Radiol., 13
(10), 2323
–2337
(2003). https://doi.org/10.1007/s00330-003-1992-7 0938-7994 Google Scholar
P. N. T. Wells,
“Ultrasound imaging,”
Phys. Med. Biol., 51
(13), R83
–R98
(2006). https://doi.org/10.1088/0031-9155/51/13/R06 0031-9155 Google Scholar
R. H. Webb,
“Confocal optical microscopy,”
Rep. Prog. Phys., 59
(3), 427
–471
(1996). https://doi.org/10.1088/0034-4885/59/3/003 0034-4885 Google Scholar
W. Denk,
J. H. Strickler, and
W. W. Webb,
“Two-photon laser scanning fluorescence microscopy,”
Science, 248
(4951), 73
–76
(1990). https://doi.org/10.1126/science.2321027 0036-8075 Google Scholar
D. Huang,
E. A. Swanson,
C. P. Lin,
J. S. Schuman,
W. G. Stinson,
W. Chang,
M. R. Hee,
T. Flotte,
K. Gregory,
C. A. Puliafito, and
J. G. Fujimoto,
“optical coherence tomography,”
Science, 254
(5035), 1178
–1181
(1996). https://doi.org/10.1126/science.1957169 0036-8075 Google Scholar
M. H. Xu and
L. H. V. Wang,
“Photoacoustic imaging in biomedicine,”
Rev. Sci. Instrum., 77
(4), 041101
(2006). https://doi.org/10.1063/1.2195024 0034-6748 Google Scholar
X. D. Wang,
Y. J. Pang,
G. Ku,
X. Y. Xie,
G. Stoica, and
L. H. V. Wang,
“Noninvasive laser-induced photoacoustic tomography for structural and functional in vivo imaging of the brain,”
Nat. Biotechnol., 21
(7), 803
–806
(2003). https://doi.org/10.1038/nbt839 1087-0156 Google Scholar
H. F. Zhang,
K. Maslov,
G. Stoica, and
L. H. V. Wang,
“Functional photoacoustic microscopy for high-resolution and noninvasive in vivo imaging,”
Nat. Biotechnol., 24
(7), 848
–851
(2006). https://doi.org/10.1038/nbt1220 1087-0156 Google Scholar
M. L. Li,
J. T. Oh,
X. Y. Xie,
G. Ku,
W. Wang,
C. Li,
G. Lungu,
G. Stoica, and
L. V. Wang,
“Simultaneous molecular and hypoxia imaging of brain tumors in vivo using spectroscopic photoacoustic tomography,”
481
–489
(2008). Google Scholar
L. Song,
K. Maslov,
R. Bitton,
K. K. Shung, and
L. V. Wang,
“Fast 3-D dark-field reflection-mode photoacoustic microscopy in vivo with a ultrasound linear array,”
J. Biomed. Opt., 13
(5), 054028
(2008). https://doi.org/10.1117/1.2976141 1083-3668 Google Scholar
R. J. Zemp,
L. Song,
R. Bitton,
K. K. Shung, and
L. V. Wang,
“Realtime photoacoustic microscopy in vivo with a ultrasound array transducer,”
Opt. Express, 16
(11), 7915
–7928
(2008). https://doi.org/10.1364/OE.16.007915 1094-4087 Google Scholar
R. J. Zemp,
L. Song,
R. Bitton,
K. K. Shung, and
L. V. Wang,
“Realtime photoacoustic microscopy of murine cardiovascular dynamics,”
Opt. Express, 16
(22), 18551
–18556
(2008). https://doi.org/10.1364/OE.16.018551 1094-4087 Google Scholar
, American National Standard for Safe Use of Lasers (ANSI Z136.1-2000),
(2000) Google Scholar
|