|
|
1.IntroductionUltrasound-modulated optical tomography (UOT) has been developed for imaging or sensing optical contrast with ultrasonic spatial resolutions.1, 2, 3, 4, 5 The modulation mechanisms of UOT have been well discussed based on the properties of coherent light in a scattering medium.1 Since fluorescence can provide unique tissue physiological information, ultrasound-modulated fluorescence (UMF) has attracted much recent attention.6, 7, 8, 9, 10, 11, 12, 13 Unfortunately, the modulation efficiency of fluorescence is very low due to the incoherent property of fluorescence.7, 8, 9, 10 Therefore, the detection of UMF is considerably challenging.7, 8, 9, 10, 11 Currently, the modulation mechanisms are poorly understood because there are only a few reports about UMF in the literature and several discrepancies exist.6, 7, 8, 9, 10, 11, 12, 13 Specifically, Kobayashi first reported experimentally observed UMF signals from a fluorescent microsphere solution embedded in a turbid medium,6 and explained that the UMF signals were due to the modulation of the refractive index of the scattering medium, which is one of the mechanisms for coherent light in UOT. Therefore, a quadratic relationship between the strength of UMF and the strength of the ultrasound pressure was claimed (see Fig. 2 in Ref. 6), which is similar with UOT signals in a turbid medium.14 However, our recent experimental studies showed a linear relationship between the two strengths from a fluorophore-filled tube mixed with microbubbles in a turbid medium.13 Moreover, our mathematical model also predicted a linear relationship between the two strengths when the modulation of the fluorophore concentration was considered as the dominant mechanism.7, 8 In addition, our model predicted that the modulation efficiency of the fluorophore concentration is considerably low in a turbid medium if it is possible to detect.8 Therefore, the SNR is expected to be much lower than that reported by Kobayashi Hall 9, 10 observed UMF signals by modulating the excitation light inside a turbid medium to excite a fluorescent target outside the turbid medium (obviously, the mechanism is the modulation of the excitation light). Even though a quadrature detection technique was adopted, the UMF signal was much weaker than Kobayashi ’s signal.9, 10 These contradictions imply the complexity of the modulation mechanisms of UMF. Since fluorescent microspheres in the Kobayashi experiments6 and microbubbles in our recent study13 make the mechanism analyses complicated due to the unknown interactions between the fluorophores and the motions and/or oscillations of the particles. To simplify the analyses of the modulation mechanisms, we are interested in whether a fluorophore aqueous solution can be modulated. In this study, we measured the UMF signal from a tube (submerged in water or Intralipid solution) filled with fluorophore aqueous solution without adding any enhancement agents, such as microbubbles, microspheres, or other scattering particles. The first aim of this study is to demonstrate the experimentally observed UMF signals from the fluorescent aqueous solution. The second purpose is to understand the modulation mechanisms based on the experimentally measured data. 2.ExperimentsRecently, we developed a system for detecting UMF signal enhanced by microbubbles based on a broadband lock-in amplifier.13 A similar system was adopted in this study. For the integrity of this study, a brief introduction to the system is given and the information about the individual devices are summarized in Table 1 . Briefly, Fig. 1 shows the schematic of the experiment setup. A laser beam emitting from a multimode fiber ( core diameter) was collimated using lens L1. A fluorescent tube (FT; inner diameter, and outer diameter, , to simulate a large vessel) was filled with rhodamine B aqueous solution , positioned parallel to the axis and submerged in a tank that was filled with either water or an Intralipid solution (the estimated reduced scattering coefficient at measured by a frequency-domain photon migration method16). The laser intensity before entering the tank was for the studies in water and in the scattering medium. An ultrasound transducer (UST; center frequency, ; focal length, ) was focused on the FT. The UST was driven by an amplified continuous sinusoidal signal with a frequency of that was generated from a function generator (FG) and a power amplifier (PA). The modulated and unmodulated emission photons were collected by lens L2 (focal length, ; diameter, ) and reflected by a dichroic filter (DF). Emission filters (EmFs) were used to block the excitation light. The emission light was focused onto one of the channels of a photomultiplier tube (PMT, active area ) by lens L3. After the photocurrent of the PMT was converted to a voltage signal by a transimpedance amplifier (TIA), the output of the TIA was connected to the input of a broadband lock-in amplifier (LIA). The synchronized TTL (transistor−transistor logic) signal from the FG was used as a reference signal for the LIA. The output of the LIA was recorded. The UST was scanned along the or axis using two linear translation stages. The UMF signal was recorded at each position at least 10 times and the average and standard deviation were calculated and are shown in the following figures. The FT was drained after the measurements of UMF. The UST was connected to a pulse generator/receiver. The received ultrasonic echoes were displayed on an oscilloscope. The peak value of the received echo at each position was recorded. By scanning the UST along the axis, the tube was ultrasonically located. The ultrasound data were linearly rescaled to limit the ultrasonic contrast of the tube comparable with the UMF contrast so that both the ultrasonic and UMF data could be displayed in one figure. For studies in the Intralipid solution, lens L2 was focused on the wall of the tank to simulate a detector seated on the edge of the tank. In this system, the emission filters and the dichroic filter can efficiently reject the excitation light ( OD at ) and no modulated signal was observed when replacing the fluorescent tube with a water-filled tube. Because no fluorophore was in the tube-surrounding medium, the background signal (or baseline) was mainly caused by the electronic interference from the UST drive signal. This electronic interference was minimized and should be independent of the UST position. Fig. 1Schematic of the system: L1 to L3, three lenses; DF, dichroic filter; EmF, emission filters; PMT, photomultiplier tube; TIA, transimpedance amplifier; LIA, lock-in amplifier; FG, function generator; PA, power amplifier; UST, ultrasound transducer; and FT, fluorescent tube.  Table 1Information concerning individual devices in the system.
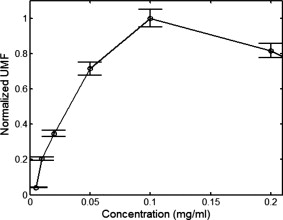
3.Results and DiscussionFigure 2 plots the measured UMF signals in water when scanning the UST along the axis and maintaining (note the tube is located at and parallel to the axis). The inset shows the measurement configuration and the dotted double arrow crossing the laser beam indicates the scan line. The zero of is defined as the left edge of the tank and the zero of as the center of the laser beam (see the two solid arrows in the inset). The peak-to-peak drive voltage applied to the UST is , which is limited by the UST when applied with a continuous signal. The location of the central peak of the UMF signal matches that of the laser beam. The profile of the UMF signal correlates with the intensity distribution of the laser beam and the two side peaks indicate the laser beam is nonuniform. The modulation mechanism makes it clear that the ultrasound pressure modulates the intensity of the incident laser via an acousto-optic effect,17 and the fluorescent molecules absorb the modulated light and emit the modulated fluorescence. The standard deviation of the UMF signal at each position is . Fig. 2UMF (the solid line with circles) in water as a function of the position of the UST when . The inset shows the measurement configuration. The origin of the coordinates is defined as the center of the laser beam on the left edge of the tank. The arrows in the inset (indicated as and ) represent the coordinates and the dotted double arrow shows the UST scan position . .  Figure 3 displays the measured UMF signals (the circles with error bars) in water when scanning the UST along the axis and maintaining (see the inset in Fig. 2 for the measurement configuration). The open arrow shows the laser propagation and UST scan direction; is . The dashed line represents the rescaled ultrasound data and the two vertical dotted lines indicate the full width at half maximum (FWHM) of the ultrasound data. The FWHM is close to the lateral diameter of the focal spot of the ultrasound beam ( , which represents the ultrasonic lateral resolution of the system), and is also close to the outer diameter of the tube . Therefore, the FWHM and the peak position of the ultrasound data are used to approximate the tube size and center position, respectively. Relatively strong UMF signals are found in the left region where the UST is away from the tube. It is unknown why the UMF signal quickly reduces when the UST focus is scanned toward the tube, and especially why the UMF signal reduces to the weakest when the UST focus is close to the left edge of the tube. This may relate to the acousto-optic effect. However, the modulation mechanism is clear and should be the same as in Fig. 2 (the modulation of the excitation light). A very interesting result is that the UMF gradually increases when the UST enters the tube region, reaches the local maximum at the center of the tube, and gradually decreases after the peak value. The UMF data match the ultrasound data well. This fact implies that the increased UMF signals may relate to the modulation of the local fluorophore properties8 (such as fluorophore concentration, quantum yield, or lifetime). It is also arguable that the increased UMF is possibly generated from the modulation of the emission or excitation light in the tube region. Currently, it is difficult to differentiate these mechanisms, however, the data shown later in Fig. 6 provide evidence of the possibility of modulating the local fluorophore properties. The UMF signal rises again when the UST is scanned out of the tube region. This increase should be contributed to the increase of the modulated emission light. This is so because no fluorophore is in this region, and the intensity of the excitation light has been significantly attenuated due to the reflection and scattering of the tube and the absorption of the fluorophore. After the UMF achieves a second local peak ( and approximately away from the right edge of the tube), it rapidly decreases again. This may be because the emission light diverges quickly after being emitted from the tube. These results imply that the modulation of the emission light plays an important role as the modulation of the excitation light in a clear medium. Fig. 3Circles with error bars represent the UMF in water as a function of the position of the ultrasound transducer when . The dashed line shows the rescaled ultrasound signal and the two vertical dotted lines indicate the FWHM of the ultrasound data. The open arrow indicates the light propagation direction and the ultrasound scan direction. The three dashed arrows indicate local peaks at which the data in Fig. 4 are acquired. . 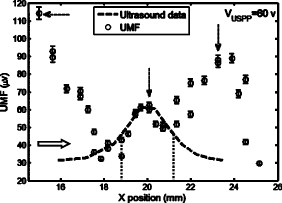 Fig. 4UMF signals at the locations indicated by the three dashed arrows in Fig. 3 as a function of (after the subtraction of the electronic interference). The circles, upward triangles, and stars represent the data measured at , 23.26, and , respectively. The solid, dashed, and dotted lines are the linear fits to the data.  Fig. 6Ultrasound-modulated fluorescence in the Intralipid solution (the circles with error bars) as a function of the position of the UST. The dashed line shows the rescaled ultrasound signal. The inset represents the measurement configuration.  Three dashed arrows in Fig. 3 indicate the local peaks of the UMF. Figure 4 shows how the affects the three peak values. The circles, upward triangles, and stars represent the data measured at the three peak locations, , 23.26, and , respectively. The solid, dashed, and dotted lines are the linear fits to the data. Clearly, three linear relationships have been found between the peak values and the value. Because the baseline (caused by the electronic interference) is dependent on , it has been measured at each value and subtracted from the corresponding UMF. A similar linear relationship between the ultrasound modulated coherent light and the ultrasound pressure in a clear medium is discussed in Ref. 18. To examine how the fluorophore concentration affects the strength of UMF signal, Fig. 5 shows the normalized UMF signal in water as a function of fluorophore concentration when and . The UMF signal increases when the concentration is low. The decrease of the UMF signal in the high-concentration region is due to the inner filter effect.19 This can be explained as follows: when the fluorophore concentration is high, less fluorescent molecules are excited in the region of the tube close to the detector because most excitation photons are absorbed by the molecules in the region where the laser enters into the tube. Also, the reabsorption of the emission photons by the fluorescent molecules themselves may also reduce the signal when the concentration is high.16, 19 Similar to other fluorescence imaging techniques, this result implies that an appropriate fluorophore concentration should be used when the strength of the UMF signal is used to quantify fluorophore concentration. Figures 2 and 3 imply that three possible modulation mechanisms exist in a clear medium: (1) the modulation of the excitation light, (2) the modulation of the emission light, and (3) the modulation of local fluorophore properties. Figures 2 and 3 indicate that the first two mechanisms can be distinguished from each other. These two mechanisms generate relatively strong UMF signals. The third mechanism may also contribute to the UMF in Fig. 3, but is relatively weak. However, it has not been uniquely distinguished from the other two mechanisms in terms of the data in Fig. 3. In addition, the profiles of the UMF signals in a clear medium caused by the first two mechanisms are dependent on the beam shape and optical path of the excitation and emission light. In contrast, the third mechanism mainly depends on the spatial distribution of the fluorophore in the medium, which may be more interesting in the applications of biomedical imaging. To examine the UMF in a turbid medium, the water in the tank was replaced with the Intralipid solution and the same fluorescent solution and tube were used. Consequently, the depth of the tube in the turbid medium is relative to the light source or the detector, and relative to the UST. Figure 6 shows the UMF as a function of the position of the UST. The open circles with error bars represent the UMF signals and the dashed line represents the rescaled ultrasound data. The inset indicates the measurement configuration. Because no fluorophore exists in the background medium, the baseline in Fig. 6 represents the electronic interference . This result was verified by the fact that a similar baseline was found by replacing the fluorescent tube with a water-filled tube. In the tube region, a dip is clearly found, and it matches the ultrasound data well (the ultrasound data were inversed to mach the UMF data). Therefore, the generation of the dip should be considered due to the existing of the UMF signal that was caused by the modulation of the local fluorophore properties. The negative change relative to the baseline caused by the UMF signal in the tube region is due to the measurement method of the lock-in detection and the existing of the electronic interference, which can be understood based on the following discussion. In the tube region, the data (the output of the LIA) represent the sum between the baseline signal (the electronic interference) and the UMF signal. Because both signals are sinusoidal waves, the sum is dependent on not only the amplitude but also the phase difference between the two waves. Therefore, if the two waves are out of phase (or the phase difference is in a certain range), the resultant amplitude may be smaller than the amplitude of either or both waves. However, the UMF signal should essentially generate a positive contrast if the electronic interference does not exist. From Fig. 6 one can see that the UMF signal in a turbid medium is very weak and even lower than the electronic interference if the depth of the dip ( , relative to the baseline) is approximately viewed as the strength of the UMF signal. The FWHM of the UMF dip is comparable with that of the ultrasound data. This result indicates that the UMF signals in Fig. 6 closely relate to the local fluorophore. Therefore, the third modulation mechanism (modulation of local fluorophore properties) outstands in the turbid medium and the contributions from the first two mechanisms have been dramatically reduced compared with those in a clear medium. This is understandable because both the excitation and the emission light are significantly attenuated due to the light scattering. Certainly, the UMF generated from the third mechanism is also attenuated relative to that in the clear medium due to the reduction of the intensity of the excitation light in the tube region and the scattering of the UMF itself by the turbid medium. However, the reduction degree may be less than that of the first two mechanisms because the total amount of the modulated fluorescence molecules (corresponding to the third mechanism) is less affected by the optical properties of the medium and mainly depends on the ultrasound strength. Unfortunately, due to the poor SNR, it is difficult to know which properties of the fluorescent molecules are modulated (concentration, quantum yield, lifetime, or others). Dynamically monitoring the fluorophore lifetime may be able to address the question whether the quenching efficiency (or fluorophore lifetime) can be modulated.11, 13 To apply the UMF technique to biomedical imaging, the modulation efficiency must be significantly improved. Although the mechanisms are not completely clear as yet, it has been found that microbubbles can effectively improve the modulation efficiency.10, 13 A possible mechanism may be due to the large volume oscillation of microbubbles that enhances the modulation efficiency of the fluorophore concentration.7, 8, 11, 13 Combining microbubble-enhanced ultrasound imaging techniques (providing tissue structural information) with a microbubble-enhanced UMF imaging modality (providing tissue fluorescent contrast), it is possible to obtain high-resolution tissue fluorescent contrast images that may not be obtained from other imaging methods. In addition, the concept of fluorophore-quencher labeled microbubbles (F-Q microbubbles) has been theoretically studied.11, 12 The basic idea is to use ultrasound waves to oscillate a microbubble and therefore to modulate the microbubble’s radius or surface area, which can lead to the modulation of the distance between the fluorophore and quencher. Eventually, the quenching efficiency may be modulated via the fluorescence resonance energy transfer. Because microbubbles are relatively easy to oscillate by ultrasound pressure, the modulation efficiency may be significantly increased relative to other methods, such as fluorophore aqueous solution, fluorophore aqueous solution mixed with microbubbles, or fluorescent microsphere solution. Further experimental and theoretical studies should be conducted in the future. The current results in the turbid medium can be viewed as the baseline measurement for a future F-Q microbbuble study and can enable us to quantify the improvement due to using F-Q microbubbles. 4.SummaryIn summary, UMF from a submillimeter tube filled with rhodamine B aqueous solution was clearly observed in both water and Intralipid solution using a broadband LIA. The dominant modulation mechanisms in water were found due to the modulations of the excitation and the emission light. The profile of the UMF depends on the geometrical properties of the optical system, such as the beam shape of the laser and the optical path of the excitation and emission light. The modulation of the properties of the fluorophore may also contribute to the observed UMF in water. The UMF observed from the same fluorescent tube in the Intralipid solution closely related to the spatial distribution of the fluorophore. The modulation of the local fluorophore properties was considered as the dominant mechanism. Data observed in this study can be viewed as baseline measurements when using mirobubbles or F-Q microbubbles to improve the modulation efficiency. ReferencesL. Wang,
“Mechanisms of ultrasonic modulation of multiply scattered coherent light: an analytic model,”
Phys. Rev. Lett., 87 043903
(2001). https://doi.org/10.1103/PhysRevLett.87.043903 0031-9007 Google Scholar
Y. Li,
H. Zhang,
C. Kim,
K. H. Wagner,
P. Hemmer, and
L. V. Wang,
“Pulsed ultrasound-modulated optical tomography using spectral-hole burning as a narrowband spectral filter,”
Appl. Phys. Lett., 93 011111
(2008). https://doi.org/10.1063/1.2952489 0003-6951 Google Scholar
T. W. Murray,
L. Sui,
G. Maguluri,
R. A. Roy,
A. Nieva,
F. Blonigen, and
C. A. DiMarzio,
“Detection of ultrasound-modulated photons in diffuse media using the photorefractive effect,”
Opt. Lett., 29 2509
–2511
(2004). https://doi.org/10.1364/OL.29.002509 0146-9592 Google Scholar
G. Rousseau,
A. Blouin, and
J.-P. Monchalin,
“Ultrasound-modulated optical imaging using a powerful long pulse laser,”
Opt. Express, 16 12577
–12590
(2008). https://doi.org/10.1364/OE.16.012577 1094-4087 Google Scholar
S. R. Kothapalli,
S. Sakadzic,
C. Kim, and
L. Wang,
“Imaging optically scattering objects with ultrasound-modulated optical tomography,”
Opt. Lett., 32 2351
–2353
(2007). https://doi.org/10.1364/OL.32.002351 0146-9592 Google Scholar
M. Kobayashi,
T. Mizumoto,
Y. Shibuya, and
M. Enomoto,
“Fluorescence tomography in turbid media based on acousto-optic modulation imaging,”
Appl. Phys. Lett., 89 181102
(2006). https://doi.org/10.1063/1.2364600 0003-6951 Google Scholar
B. Yuan,
“Theoretical study of ultrasound-modulated fluorescence photon waves in turbid mediaDiffuse optical tomography and fluorescence diffuse optical tomography,”
(2006) Google Scholar
B. Yuan,
J. Gamelin, and
Q. Zhu,
“Mechanisms of the ultrasonic modulation of fluorescence in turbid media,”
J. Appl. Phys., 104
(10), 103102
(2008). https://doi.org/10.1063/1.3021088 0021-8979 Google Scholar
D. J. Hall,
U. Sunar, and
S. Farshchi-Heydari,
“Quadrature detection of ultrasound-modulated photons with a gain-modulated, image-intensified, CCD camera,”
Open Opt. J., 2 75
–78
(2008). https://doi.org/10.2174/1874328500802010075 Google Scholar
D. J. Hall,
M. J. Hsu,
S. Esener, and
R. F. Mattrey,
“Detection of ultrasound-modulated photons and enhancement with ultrasound microbubbles,”
Proc. SPIE, 7177 71771L
(2009). https://doi.org/10.1117/12.808603 0277-786X Google Scholar
B. Yuan,
“Ultrasound-modulated fluorescence based on a fluorophore-quencher—labeled microbubble system,”
J. Biomed. Opt., 14
(2), 024043
(2009). https://doi.org/10.1117/1.3120493 1083-3668 Google Scholar
B. Yuan,
“Sensitivity of a fluorophore-quencher labeled microbubble system to externally applied static pressure,”
Med. Phys., 36
(8), 3455
–3469
(2009). https://doi.org/10.1118/1.3158734 0094-2405 Google Scholar
B. Yuan,
Y. Liu,
P. M. Mehl, and
J. Vignola,
“Microbubble-enhanced ultrasound-modulated fluorescence in a turbid medium,”
Appl. Phys. Lett., 95 181113
(2009). https://doi.org/10.1063/1.3262959 0003-6951 Google Scholar
“Aggregation of Rhodamine B in water,”
Russ. J. Appl. Chem., 77 414
–422
(2004). https://doi.org/10.1023/B:RJAC.0000031281.69081.d0 1070-4272 Google Scholar
D. Magde,
G. E. Rojas, and
P. Seybold,
“Solvent dependence of the fluorescence lifetimes of xanthene dyes,”
Photochem. Photobiol., 70 737
–744
(1999). https://doi.org/10.1111/j.1751-1097.1999.tb08277.x 0031-8655 Google Scholar
B. Yuan,
N. G. Chen, and
Q. Zhu,
“Emission and absorption properties of indocyanine green in Intralipid solution,”
J. Biomed. Opt., 9 497
–503
(2004). https://doi.org/10.1117/1.1695411 1083-3668 Google Scholar
M. E. Haran,
B. D. Cook, and
H. F. Stewart,
“Comparison of an acousto-optic and a radiation force method of measuring ultrasonic power,”
J. Acoust. Soc. Am., 57
(6), 1436
–1440
(1975). https://doi.org/10.1121/1.380582 0001-4966 Google Scholar
L. Wang,
“Ultrasound-mediated biophotonic imaging: a review of acousto-optical tomography and photo-acoustic tomography,”
J. Dis. Mark., 19
(3), 123
–138
(2004). Google Scholar
J. R. Lakowicz, Principles of Fluorescence Spectroscopy, 3rd ed.Springer, Berlin (2006). Google Scholar
|