
|
|
1.IntroductionIn recent years, the combination of imaging microscopy and ultrafast laser sources to produce nonlinear signals has opened new research opportunities in biology and biomedicine. Nonlinear imaging techniques such as two-photon excitation fluorescence (TPEF),1, 2 second-harmonic generation (SHG),3 and third-harmonic generation4 are well-established noninvasive methods used for imaging and mapping subcellular biological structures and processes. Unlike (linear) one-photon confocal microscopy, nonlinear fluorescence is generated only in a reduced volume of the focal plane within the sample under analysis, which is due to the quadratic intensity dependence of the nonlinear effects. This provides intrinsic confocality and optical sectioning capability with increased axial resolution. In biological specimens, this autoconfocal effect reduces photobleaching and phototoxicity in areas outside the focus, minimizing unwanted interactions and ensuring long, reliable experimental sessions. Moreover, the use of infrared light, instead of visible or UV, also allows TPEF to image deeper layers within the tissues, reducing UV-induced damage. The use of femtosecond laser sources provides high peak powers for efficient nonlinear excitation, with average power low enough that biological specimens are not damaged. Compared to conventional fluorescence techniques, TPEF allows high-resolution imaging of endogenous fluorophores without the use of exogenous chemical-based fluorophores.5 Most previous efforts in TPEF microscopy have been centered on optimizing the generated nonlinear signal and reducing photobleaching effects by analyzing the phase-shape,6, 7, 8 the temporal,9 and the spectral10 properties of the laser source. Similar to linear microscopy, the image quality of nonlinear microscopes is limited by the wavefront aberrations (WAs) of the illuminating laser beam. Other aberration sources include the optical elements of the imaging system and those of the specimen. Different approaches have been addressed to compensate for the in-depth specimen aberrations. Some used hill climbing11 or genetic algorithms12 with either a deformable mirror or a liquid crystal spatial light modulator to correct for the Was.13 Others estimated the sample Was using a coherence-gated interferometric technique.14 More recently, an image-based adaptive optics technique has also been reported.15 As far as we know, most reported nonlinear microscopy techniques were sensorless, and the use of wavefront sensors is scarce in the literature. However, knowledge of the aberrations of the optical system through wavefront sensing operations is required to obtain high-quality focal spots. In particular, the aberrations introduced by the illuminating laser beam produce an increase of the point-spread function (PSF) volume and, consequently, a reduction of resolution and image contrast and a lower efficiency of the fluorescent processes. These aberrations can be both static (from misalignments and imperfections of the optical elements inside the laser cavity) and dynamic (due to thermal effects, shot noise, etc.).16 The accurate measurement of the laser beam WA is the first step in improving the beam quality by subsequent WA correction using adaptive optics. In the present work, we present experimental proof that the WA control of an ultrafast laser beam used as illumination source in a multiphoton microscope can provide TPEF microscopy images of ex vivo retinal features with exceptional quality. 2.MethodsUltrashort pulses required for multiphoton microscopy were produced by a tunable mode-locked Ti:Sapphire laser (Mira 900f, Coherent, Santa Clara, California ). The average power of the laser was (at ), with pulse duration of around and a repetition rate of . The instrument was built based on a modified inverted microscope (Nikon TE2000-U). Figure 1 shows a schematic diagram of the experimental system. The scanning unit was performed by a pair of nonresonant galvanometric mirrors (GSI, VM1000) in order to get fast high-resolution images ( images every second). Two different objectives with long working distance (Nikon ELWD Series) have been used to provide different magnifications ( , and , ). The TPEF signal was collected in the backward direction via the same objective. A dichroic mirror separates the excitation light from the generated nonlinear signal coming back from the sample. A spectral filter (TPEF filter) and a photomultiplier tube (PMT) were used in the detection channel. A DC-motor ( -control) was used to control the focus location along the direction in order to record in-depth stacks of images within the specimen. From these, 3-D images were reconstructed using ImageJ free software. The entire system was computer-controlled by custom-developed software. The average illumination power for imaging the retina was between 2 and at the specimen plane, depending on the analyzed sample. Fig. 1Simplified schematic diagram of the multiphoton microscope. PMT, photomultiplier tube (photon-counting unit); ML, microlenslet array; AP, aperture; NDF, neutral density filter.  The WAs of the high-power laser beam were measured with a real-time Hartmann-Shack (HS) wavefront sensor as explained elsewhere.16 The emergent laser beam was incident onto an optical window placed at approximately its Brewster angle. The reflected portion of the beam was used for the wavefront sensing operation. It passed through an aperture (AP) and a neutral density filter before reaching the microlenslet array (ML; pitch and focal length) placed in front of the CCD camera (HS-CCD). During measurements, a video monitor showed the HS images acquired at a rate of . The WAs were reconstructed as Zernike polynomial expansions up to fifth order. Ocular globes from healthy donors were kindly provided by the Hospital Universitario “Virgen de la Arrixaca” in Murcia. The entire protocol was approved by both the hospital’s and the Universidad of Murcia’s review board. After corneal removal, the donor ocular globes were immediately kept in a 0.9% sodium chloride solution and moved from the hospital to the lab. There, the iris and lens were carefully removed to have the retina excised. Depending on the experiment, the neurosensory retina or the retinal pigment epithelium (RPE)–choroids–sclera section were placed in a glass bottom dish surrounded by the solution to ensure liability and humidity. Just for Fig. 5 (shown later), a neural retina was processed in paraffin wax but not stained. Five- -thick sections were extracted, placed on a microscope slide, and covered with a coverslip for microscope imaging. Fig. 5Two-photon endogenous autofluorescence in retinal tissues. (a) Transversal section of a nonstained human retina embedded in paraffin wax. Different retinal layers can be distinguished between the retinal nerve fiber layer on top and the photoreceptors’ area at the bottom. The rest of the images show optical sections of nonfixed, nonstained retinas. (b) Single neuron axons of the retinal fiber layer; (c) fiber bundles at the retinal fiber layer; (d) blood vessel and axons lying between the nerve fiber layer and the ganglion cells; (e) ganglion cells; (f) inner segment of the photoreceptor mosaic; (g) individual rods and cones imaged with a objective; (h) outer segment of the photoreptor layer; and RPE individual cells obtained with (i) and (j) objectives. Bar length: . The retinal location of images (b) to (j) are also indicated in (a).  3.ResultsThe Ti:Sapphire laser beam WA may be worse than expected, with low-order aberration terms as dominant contributors.16 The first step to improve the quality of the emergent beam is to realign the laser cavity in such a way that the laser output power is optimized and simultaneously the beam wavefront is improved. For this operation, the beam WAs were measured with the HS wavefront sensor, while the cavity was set to provide an optimized laser beam WA. Moreover, the WAs were also found to be fairly constant over time, which agrees well with previous findings16 and indicates an initial potential benefit using only static corrections. Figure 2 shows the initial WA (up to fifth order) and the associated PSF (i.e., the far-field intensity distribution). Low-order aberration terms [defocus and horizontal astigmatism ] were the dominant contributors (95% of the total aberration). The resulting optimized WA and PSF are plotted in Fig. 2. Figure 2 depicts the corresponding individual Zernike coefficients (up to fourth order) of these WAs. This cavity realignment represents a partial aberration correction, providing an improvement in the spatial quality of the beam. There is a reduction in the amount of aberrations. In particular, defocus and astigmatism were reduced 36%. The overall root-mean-square error of the WA was reduced from 0.45 to 0.34 micron and the Strehl ratio of the PSF increased from 0.07 to 0.19. Fig. 2(a) Initial laser beam WA ( -phase wrapped) obtained from HS images including Zernike terms from second to sixth order and the corresponding PSF; (b) optimized laser beam WA and PSF after partial aberration correction by realigning the laser cavity; (c) individual Zernike terms up to fourth order before (black) and after (white) realigning the cavity. The WA was computed for a pupil, and PSFs subtend .  As a first step, Fig. 3 illustrates the effects of this partial correction of aberrations on the quality of nonlinear microscopy images on a fluorescent piece of paper. The benefit of this cavity alignment can be observed in this nonbiological sample. An increase in the total signal intensity of around 50% was reached, and more details are seen in the optimized TPEF image. Fig. 3TPEF images of a nonbiological sample before (a) and after (b) laser cavity alignment. Both images share the same intensity scale. Bar length: .  Defocus is responsible for the spatial divergence (or convergence) of the laser beam, which changes the focal plane from which the image is obtained. In multiphoton microscopy, this is not an issue, since the microscope objective might be moved to image the plane of interest; however, this might impose a limit to the available penetration depth when using short working distance objectives. The impact of astigmatism is more important since it produces two focal points, enlarges the PSF volume, and makes this turn into an ellipse-shaped spot. Different amounts of defocus and astigmatism were induced in the laser beam by means of a set of trial lenses. These were carefully placed within the beam pathway in such a way that no changes in the beam alignment appeared. Moreover, only Zernike terms related to defocus and astigmatism changed significantly when using these lenses. Since the underfilling of the objective aperture affects the effective NA (leading to loss of resolution), we ensured that for all experimental conditions, the size of the laser beam reaching the objective filled the entire aperture. Figure 4 (upper row) shows the impact of defocus and astigmatism on TPEF images of the retinal nerve fiber layer of an ex vivo human retina. The bottom row shows the PSFs corresponding to the laser beam WAs used for each image registration. Figure 4 is the control image, which can be directly compared with Fig. 4, where (D) of defocus was added. A reduction in the signal of around 70% was found. Figures 4 and 4 show the images with of astigmatism (axes at 0 and ) induced. The lateral resolution is reduced by an elongation of the intrinsic fluorescent point sources. A decrease in the nonlinear signal of 35 and 50% was produced. Moreover, this decrease in the image quality might also be affected by a reduction of the probability of nonlinear absorption of the material because of the aberrated shape of the focal point. The reduction in the quality of these TPEF images is well correlated with the values of the PSF Strehl ratio: from left to right, they were 0.19, 0.10, 0.12, and 0.16. Fig. 4Effect of defocus and astigmatism on the image quality of TPEF images of the retinal nerve fiber layer from an ex vivo human retina (upper row). (a) Image control; (b) of defocus; (c) of horizontal, and (d) astigmatism. Bar length: . All images have the same intensity scale. The bottom row depicts the PSFs associated with the laser beam WAs used to register each image. Each PSF subtends . 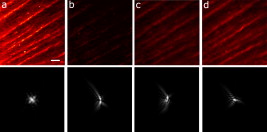 As an application of the instrument, we explored the nonlinear signals arising from the imaging of ex vivo human retinal tissues. All TPEF images of human retinal tissues were taken after the laser cavity was optimized. The retina is a transparent light-sensitive tissue lining the inner surface of the eye, made of a complex, layered structure with several layers of neurons interconnected by synapses. As an example, Fig. 5 presents the TPEF image of a transversal section of a paraffin-embedded human retina. The different structures of the retina can be identified, the photoreceptor layer being the one providing the strongest signal [area at the bottom of Fig. 5]. This is due to the all-trans-retinol in the outer segments of rods. It is important to note that no staining substance was used, and the complete measured signal comes from the sample’s endogenous fluorescence (autofluorescence). Almost every retinal layer shows autofluoresence, which arises from specific fluorescent molecules. Moreover, TPEF -images from additional intact retinas were registered with the wavefront-optimized nonlinear microscope. These specimens were extracted from the donors’ ocular globes and were neither fixed neither stained, but directly imaged. Figures 5, 5, 5, 5, 5, 5, 5, 5, 5 show detailed optical retinal sections obtained by focusing at different depths. All images were obtained using a objective, except Fig. 5 and Fig. 5, where a objective was used. The first imaged layer was the retinal nerve fiber layer [Figs 5 and 5]. It is composed of individual axons going from each ganglion neuron cell to the optical nerve head, transmitting the visual information from photoreceptor to the brain visual cortex. Each individual axon has a diameter of [Fig. 5],17 and the axons are grouped forming fiber bundles of diameter [Fig. 5]. Blood vessels (veins and capillaries) lie in the inner part of the nerve fiber layer [Fig. 5]. The strong fluorescence signal is produced from the elastin and collagen as well as the epithelial and endothelial cells located in the vessel walls.18 The ganglion cell layer is located just below the fiber layer [Fig. 5]. This autofluoresence signal originates in the cytoplasm of the cell, while the cell, nucleus appears dark, not showing any fluorescence signal. Two sources are responsible for the ganglion cell fluorescence: one from the mitochondrial oxidized flavin proteins, such as the yellow-emitting flavin adenine dinucleotide (FAD),19 and the other from the mitochondrial reduced pyridine nucleotides NAD(P)H.20, 21 To our knowledge, this is the first time TPEF images of human axons and ganglion cells have been reported. Since the loss of ganglion cells is directly involved in glaucoma development, the possibility of imaging these cells under nonstained conditions may help in the understanding of this pathology. Figures 5, 5, 5 present images obtained from the photoreceptor layer at different locations and magnifications. The inner segments of both rods and cones contain organelles and the cell’s nucleus, while the outer segments contain the light-absorbing materials. Therefore, the contributors to the photoreceptor’s autofluorescence will be different depending on the segment imaged. In the inner segment signal arises from mitochondrial NAD(H)P and FAD [Figs. 5 and 5], while in the outer segment, signal arises from all-trans-retinol, produced during the visual cycle [Fig. 5].22 The spatial arrangement of the photoreceptors’ mosaic is depicted in Figs. 5 and 5. Individual cones and rods are clearly distinguished. The imaged area ( off the fovea) in Figs. 5 and 5 corresponds to the inner segments of the photoreceptors’ layer. Rods appear as bright autoflurescence cells with a size of around , which is in agreement with anatomical studies.23 Conversely, cones, with diameter, can be distinguished by absence of autofluorescence signal, since they are located at a different depth. Last, in Figs. 5 and 5, TPEF images of the retinal pigment epithelium (RPE) cells with different magnification are shown. To obtain those images, the neural retina was removed, and the RPE cells layer was facing the objective lens. The mosaic pattern from the individual cells can clearly be observed, as well as the individual lipofuscin granules (responsible for the autofluorence).24 Lipofuscin is a pigment granule (having a typical diameter of ) containing residues of lysosomal digestion, and its accumulation is a major risk factor implicated in macular degeneration. As stated in the literature, the center-to-center spacing of the RPE cells is (Ref. 25). Another important capability of a TPEF microscope is the possibility of combining sets of images a few microns apart to reconstruct high-resolution 3-D tomographs of the retinal structures. This procedure is independent of the wavefront optimization reported here. Since individual frames recorded before and after the cavity alignment cannot be compared, the evidence of significantly better 3-D images after the operation cannot be provided, and further experiments are required. However, here we present high-quality 3-D tomographs of some retinal areas that, to the best of our knowledge, have not seen reported previously. In particular, the volume rendering of Fig. 6 provides valuable and detailed information about the distribution of photoreceptor cells. This image was obtained from 12 optical retinal sections ( apart). Figures 6, 6, 6, 6 show the optical sections corresponding to 10, 25, 35, and from the coverglass surface. Figure 7 shows another volume rendering, obtained from 20 optical sections apart, including a retinal blood vessel and the underlying ganglion cell layer. This reconstruction perfectly outlines the morphology of this particular blood vessel and allows a better visualization of the ganglion cells. Figures 7, 7, 7, 7 are the optical sections corresponding to depths of 20, 40, 80, and (from the coverglass used as a reference). Fig. 6TPEF imaging of the human outer retina. Photoreceptors’ outer (a) and inner segments (b); outer nuclear layer (c); and outer plexiform layer (d). Images were taken at 10, 25, 35, and deep, respectively from the microscope coverglass. (e) Retinal volume rendering reconstructed from 12 optical sections registered apart. Bar length: .  Fig. 7TPEF images of a retinal blood vessel and underlying ganglion cells at two different depths within the same retina (20, 40, 80, and respectively from the coverglass): (a) top of blood vessel; (b) blood vessel walls; and (c) and (d) ganglion cells. (e) 3-D retinal tomograph showing the blood vessels and the ganglion cells’ area reconstructed from 20 optical sections apart. Bar length: .  4.DiscussionWe have developed an improved version of a multiphoton microscope incorporating the control of the laser beam WA. This has been applied to obtain TPEF images of ex vivo retinal tissues of human donors. This real-time, in situ, wavefront-assisted method for realigning the laser cavity is a useful tool to improve the beam quality.16 The combination of a WA-optimized laser beam with multiphoton microscopy produces an increase in the contrast and resolution in TPEF microscopic imaging of neither fixed nor stained retinal tissues. The instrument reported here allowed us to analyze different sources of TPEF autofluorescence in the retina tissue and to obtain high-quality images, many of them with unprecedented quality. We showed, for the first time to our knowledge, autofluorescent images from human ganglion cells that could help to understand the origin and progress of certain retinal pathologies. The high quality of the images along the direction permits the reconstruction of volume renderings from well-defined stacks of images that help to better visualize the areas of interest (mainly from a clinical point of view). Three-dimensional images of the outer retina and the retinal blood vessel area overlying the ganglion cells have been reconstructed. These reconstructions might provide additional information about spatial distribution of human retinal structures. This is important since although differing (fresh and fixed) biological tissues have been studied,11, 12, 13, 14, 15 experiments combining wavefront sensing and TPEF imaging in human ocular tissues are lacking in the literature. Studies on the analysis of human retinal tissues using nonlinear microscopy are scarce. They were mainly based on exploring the RPE24, 26, 27 and the optic nerve head.28 Han and co-workers also reported some TPEF images of the photoreceptor mosaic25. These studies used a backscattered configuration, and the samples were fixed using paraformaldehyde, which facilitates the manipulation of the samples and the surgical trephine operation. Our technique also uses the microscope objective to collect the TPEF signal, but unlike those previous experiments, the samples were never fixed. Despite avoiding the fixation procedure, the instrument provided TPEF images with high resolution and enhanced contrast of different parts of the human retina, from the retinal nerve fiber layer up to the RPE. Every retinal layer was imaged under the same experimental conditions and without noticeable photodamage. Special attention must be paid to some retinal structures of the human eye such as nerve fibers, ganglion cells, retinal blood vessels, or the outer plexiform layer never before identified through nonlinear microscopy. It is well known that many factors affect the performance of an optical system. In particular, confocal microscopes require tests of field illumination, power output, resolution, and laser stability among others to ensure the accuracy of the data acquisition.29, 30 In this work, and as a first step, we centered the attention on the aberrations of the laser beam used as illumination source and its partial correction by means of a cavity realignment technique. Although not shown here, the realignment of the cavity modified the laser beam WA but the intensity profile remained similar after the operation. Since the illumination beam and the nonlinear signal pass through the specimen, the total amount of aberration is thought to include that of the laser beam as well as all those arising between the microscope entrance and the focal point within the sample. Due to the autoconfocality of the nonlinear fluorescence processes, a confocal aperture in front of the detector is not required. Then, the aberrations in the registration pathway are thought to have little influence, as they do not affect the resolution or the signal level.31 In this sense, the focal spot at the plane of interest is mainly affected by aberrations in the illumination pathway. Studies analyzing the individual contribution of both sources of aberrations on nonlinear microscopy have not been found by these authors. Neil first demonstrated specimen-induced aberration correction in fluorescent beads by using a modal wavefront sensor together with a liquid crystal spatial light modulator.13 The main drawback was a significant loss of laser power reaching the sample due to both the continuous wavefront monitoring and the modulator. To overcome this, Sherman and colleagues used a genetic algorithm with TPEF signal intensity as feedback to determine the optimum shape of the deformable mirror to compensate for the specimen-induced spherical aberration (in a Coumarin-water solution).12 Marsh and co-workers reported an automatic optimization of the TPEF signal based on merit functions such as contrast and sharpness, using a deformable mirror.11 They applied the procedure to water beads and to a guinea pig muscle. A coherent-gated wavefront sensor combined with a deformable mirror improved TPEF images of both an aqueous gel containing polystyrene beads and living zebrafish larvae. However, due to the interferometric nature of the technique, only the return-pass aberrations were measured.14 Very recently, Débarre have demonstrated in-depth wavefront sensorless aberration correction in TPEF images of different mouse tissues. Image improvement was based on applying a set of trial aberrations (produced with a deformable mirror) and measuring the corresponding image quality through a particular metric (the one taking a maximum value in absence of trial aberrations).15 They reported to have an increase in the TPEF signal of about 50%. Girkin and colleagues have also shown improvement in coherent anti-Stokes Raman scattering (CARS) microscopy images when correcting the system aberrations at the coverglass–sample interface.32 Most of these previous works did not use a wavefront sensor, and the actual WA at a particular plane was always unknown. Some authors stated that the use of wavefront sensors leads to a loss of power.11 However, we demonstrate here that the use of an HS sensor is a fast and accurate method, and the optimization of the laser beam WA through the cavity alignment provides enough power to produce the required nonlinear effects for TPEF imaging microscopy. In confocal microscopy, the optimization of an image based on a metric strongly depends on the metric.33, 34 Different distributions of intensity within an image might also provide the same metric value. This is also expected in TPEF microscopy. When a particular image is optimized (based on a chosen metric) by changing the shape of the deformable mirror, different shapes of the mirror (i.e., different WA maps) might provide the same image quality. Since the actual WA is not measured, the optimized image may be underestimated. Moreover, some sample properties’ assumptions are sometimes required.15 The WA laser beam optimization through cavity alignment based on HS wavefront sensor measurements here reported represents a simple and low-cost effective solution for static low-order aberration correction. The improvement in the beam quality leads to a narrower PSF, to an improved intrinsic confocality, and to a better sectioning capability via an increased axial resolution. Despite this correction being less accurate, as only part of the aberrations are taken into account, we obtained images of excellent quality across a number of retinal layers. As an additional benefit, WA optimization allows the reduction of the required excitation power levels to generate nonlinear effects. This fact is important for our application, imaging transparent retinal tissues from human donors, since it enables direct and valuable visualization of tissue morphology using its own intrinsic fluorescence. Then, the sample preparation is simplified, and unwanted side effects, such as photobleaching and phototoxicity and structural changes due to exogenous dyes, are avoided. The reduction of photobleaching side effects and the optimization of nonlinear signals have been addressed by different methods.6, 7, 8, 9, 10 Moreover, the minimization of the WA of the sample itself has also been a topic of interest in nonlinear microscopy techniques.11, 12, 13, 14, 15 However, to our knowledge, this is the first time that an accurate control of the laser beam WAs has been used to improve the nonlinear imaging of human retinal tissues. In conclusion, we report a procedure that demonstrates that nonlinear microscopy techniques might be significantly improved when combined with wavefront-control approaches. This provides complementary information about the human retinal structure and the labeling of individual cells in a reliable and efficient manner. This is the first step for future clinical applications of nonlinear imaging techniques in the early diagnosis of ocular pathologies, such as age-related macular degeneration or glaucoma, as well as an increase in the accuracy of intratissue laser effects, retinal microsurgery, and photodynamic therapy methods. AcknowledgmentsThis work has been supported by the Ministerio de Educación y Ciencia, Spain (Grant Nos. FIS2007-64765 and Consolider SAUUL CSD2007-00033), and Fundación Séneca, Murcia, Spain (Grant 04524/GERM/06). The authors thank J. M. Marín, MD, PhD, from the Hospital Universitario “Virgen de la Arrixaca,” Murcia, Spain, for providing us with the ocular tissue samples. ReferencesF. Helmchen and
W. Denk,
“Deep tissue two-photon microscopy,”
Nat. Methods, 2
(12), 932
–939
(2005). https://doi.org/10.1038/nmeth818 1548-7091 Google Scholar
Y. Imanishi,
K. H. Lodowski, and
Y. Koutalos,
“Two-photon microscopy: shedding light on the chemistry of vision,”
Biochem., 46
(34), 9674
–9684
(2007). https://doi.org/10.1021/bi701055g Google Scholar
P. J. Campagnola and
L. M. Loew,
“Second-harmonic imaging microscopy for visualizing biomolecular arrays in cells, tissues, and organisms,”
Nat. Biotechnol., 21
(11), 1356
–1360
(2003). https://doi.org/10.1038/nbt894 1087-0156 Google Scholar
J. A. Squier,
M. Müller,
G. J. Brakenhoff, and
K. R. Wilson,
“Third-harmonic generation microscopy,”
Opt. Express, 3
(9), 315
–324
(1998). https://doi.org/10.1364/OE.3.000315 1094-4087 Google Scholar
W. R. Zipfel,
R. M. Williems,
R. Christie,
A. Y. Nikitin,
B. T. Hyman, and
W. W. Webb,
“Live tissue intrinsic emission microscopy using multiphoton-excited native fluorescence and second harmonic generation,”
Proc. Natl. Acad. Sci. U.S.A., 100
(12), 7075
–7080
(2003). https://doi.org/10.1073/pnas.0832308100 0027-8424 Google Scholar
I. Pastirk,
J. Dela Cruz,
K. Walowicz,
V. Lozovoy, and
M. Dantus,
“Selective two-photon microscopy with shaped femtosecond pulses,”
Opt. Express, 11
(14), 1695
–1701
(2003). 1094-4087 Google Scholar
H. Kawano,
Y. Nabekawa,
A. Suda,
Y. Oishi,
H. Mizuno,
A. Miyawaki, and
K. Midorikawa,
“Attenuation of photobleaching in two-photon excitation fluorescence from green fluorescent protein with shaped excitation pulses,”
Biochem. Biophys. Res. Commun., 311 592
–596
(2003). https://doi.org/10.1016/j.bbrc.2003.09.236 0006-291X Google Scholar
P. Xi,
Y. Andegelo,
D. Pestov,
V. V. Lovozoy, and
M. Dantus,
“Two-photon imaging using adpative phase compensated ultrashort laser pulses,”
J. Biomed. Opt., 14
(1), 014002
(2009). https://doi.org/10.1117/1.3059629 1083-3668 Google Scholar
S. Tang,
T. B. Krasieva,
Z. Chen,
G. Tempea, and
B. J. Tromberg,
“Effect of pulse duration on two-photon excited fluorescence and second-harmonic generation in nonlinear optical microscopy,”
J. Biomed. Opt., 11
(2), 020501
(2006). https://doi.org/10.1117/1.2177676 1083-3668 Google Scholar
C. Xu and
W. W. Webb,
“Measurement of two-photon excitation cross sections of molecular fluorophores with data from ,”
J. Opt. Soc. Am. B, 13
(6), 481
–491
(1996). https://doi.org/10.1364/JOSAB.13.000481 0740-3224 Google Scholar
P. N. Marsh,
D. Burns, and
J. M. Girkin,
“Practical implementation of adaptive optics in multiphoton microscopy,”
Opt. Express, 11
(10), 1123
–1130
(2003). 1094-4087 Google Scholar
L. Sherman,
J. Y. Ye,
O. Albert, and
T. B. Norris,
“Adaptive correction of depth-induced aberrations in multiphoton scanning microscopy using a deformable mirror,”
J. Microsc., 206 65
–71
(2002). https://doi.org/10.1046/j.1365-2818.2002.01004.x 0022-2720 Google Scholar
M. A. Neil,
R. Juskaitis,
M. J. Booth,
T. Wilson,
T. Tanaka, and
S. Kawata,
“Adaptive aberration correction in a two-photon microscope,”
J. Microsc., 200 105
–108
(2000). https://doi.org/10.1046/j.1365-2818.2000.00770.x 0022-2720 Google Scholar
M. Rueckel,
J. A. Mack-Bucher, and
W. Denk,
“Adaptive wavefront correction in two-photon microscopy using coherence-gated wavefront sensing,”
Proc. Natl. Acad. Sci. U.S.A., 103
(46), 17137
–17142
(2006). https://doi.org/10.1073/pnas.0604791103 0027-8424 Google Scholar
D. Débarre,
E. J. Botcherby,
T. Watanabe,
S. Srinivas,
M. J. Booth, and
T. Wilson,
“Image-based adaptive optics for two-photon microscopy,”
Opt. Lett., 34
(16), 2495
–2497
(2009). 0146-9592 Google Scholar
J. M. Bueno,
B. Vohnsen,
L. Roso, and
P. Artal,
“Temporal wavefront stability of an ultrafast high-power laser beam,”
Appl. Opt., 48
(4), 770
–777
(2009). https://doi.org/10.1364/AO.48.000770 0003-6935 Google Scholar
T. E. Ogden,
“Nerve fiber layer of the primate retina: morphological analysis,”
Invest. Ophthalmol. Visual Sci., 25 19
–29
(1984). 0146-0404 Google Scholar
R. T. A. Megens,
S. Reitsma,
P. H. M. Schiffers,
R. H. P. Hilgers,
J. G. R. De Mey,
D. W. Slaaf,
M. G. A. Oude Egbrink, and
M. A. M. J. van Zandvoort,
“Two-photon microscopy of vital murine elastic and muscular arteries,”
J. Vasc. Res., 44 87
–98
(2007). https://doi.org/10.1159/000098259 1018-1172 Google Scholar
D. Schweitzer,
S. Schenke,
M. Hammer,
F. Schweitzer,
S. Jentsch,
E. Birckner,
W. Becker, and
A. Bergmann,
“Towards metabolic mapping of the human retina,”
Microsc. Res. Tech., 70 410
–419
(2007). https://doi.org/10.1002/jemt.20427 1059-910X Google Scholar
C. Chen,
E. Tsina,
M. C. Cornwall,
R. K. Crouch,
S. Vijayaraghavan, and
Y. Koutalos,
“Reduction of all-trans-retinal to all-trans-retinol in the outer segments of frog and mouse rod photoreceptors,”
Biophys. J., 88
(3), 2278
–2287
(2005). https://doi.org/10.1529/biophysj.104.054254 0006-3495 Google Scholar
S. Huang,
A. A. Heikal, and
W. W. Webb,
“Two-photon fluorescence spectroscopy and microscopy of NAD(P)H and flavoprotein,”
Biophys. J., 82
(5), 2811
–2825
(2002). https://doi.org/10.1016/S0006-3495(02)75621-X 0006-3495 Google Scholar
Y. Imanishi,
M. L. Batten,
D. W. Piston,
W. Baehr, and
K. Palczewski,
“Noninvasive two-photon imaging reveals retinyl ester storage structures in the eye,”
J. Cell. Biol., 164
(3), 373
–383
(2004). https://doi.org/10.1083/jcb.200311079 Google Scholar
C. A. Curcio,
K. R. Sloan,
R. E. Kalina, and
A. E. Hendrickson,
“Human photoreceptor topography,”
J. Comp. Neurol., 292
(4), 497
–523
(1990). https://doi.org/10.1002/cne.902920402 0021-9967 Google Scholar
A. Bindewald-Wittich,
M. Han,
S. Schmitz-Valckenberg,
S. R. Snyder,
G. Giese,
J. F. Bille, and
F. G. Holz,
“Two-photon-excited fluorescence imaging of human RPE cells with a femtosecond Ti:Sapphire laser,”
Invest. Ophthalmol. Visual Sci., 47
(10), 4553
–4557
(2006). https://doi.org/10.1167/iovs.05-1562 0146-0404 Google Scholar
M. Han,
A. Bindewald-Wittich,
F. G. Holz,
G. Giese,
M. H. Niemz,
S. Snyder,
H. Sun,
J. Yu,
M. Agopov,
O. La Schiazza, and
J. F. Bille,
“Two-photon excited autofluorescence imaging of human retinal pigment epithelial cells,”
J. Biomed. Opt., 11
(1), 010501
(2006). https://doi.org/10.1117/1.2171649 1083-3668 Google Scholar
M. Han,
G. Giese,
S. Schmitz-Valckenberg,
A. Bindewald-Wittich,
F. G. Holz,
J. Yu,
J. F. Bille, and
M. H. Niemz,
“Age-related structural abnormalities in the human retina-choroid complex revealed by two-photon excited autofluorescence imaging,”
J. Biomed. Opt., 12
(2), 024012
(2007). https://doi.org/10.1117/1.2717522 1083-3668 Google Scholar
O. La Schiazza and
J. J. Bille,
“High-speed two-photon excited autofluorescence imaging of ex vivo human retinal pigment epithelial cells toward age-related macular degeneration diagnostic,”
J. Biomed. Opt., 13
(6), 064008
(2008). https://doi.org/10.1117/1.2999607 1083-3668 Google Scholar
D. J. Brown,
N. Morishige,
A. Neekhra,
D. S. Minckler, and
J. V. Jester,
“Application of second-harmonic imaging microscopy to assess structural changes in optic nerve head structure ex vivo,”
J. Biomed. Opt., 12
(2), 024029
(2007). https://doi.org/10.1117/1.2717540 1083-3668 Google Scholar
R. M. Zucker and
O. Price,
“Practical confocal microscopy and the evaluation of system performance,”
Methods, 18 447
–458
(1999). https://doi.org/10.1006/meth.1999.0812 1046-2023 Google Scholar
R. M. Zucker and
O. Price,
“Evaluation of confocal microscopy system performance,”
Cytometry, 44 273
–294
(2001). https://doi.org/10.1002/1097-0320(20010801)44:4<273::AID-CYTO1120>3.0.CO;2-N 0196-4763 Google Scholar
M. J. Booth,
“Adaptive optics in microscopy,”
Philos. Trans. R. Soc. London, Ser. A, 365 2829
–2842
(2007). https://doi.org/10.1098/rsta.2007.0013 0962-8428 Google Scholar
J. M. Girkin,
S. Poland, and
A. J. Wright,
“Adaptive optics for deeper imaging of biological samples,”
Curr. Opin. Biotechnol., 20 106
–110
(2009). https://doi.org/10.1016/j.copbio.2009.02.009 0958-1669 Google Scholar
J. M. Bueno and
M. C. W. Campbell,
“Confocal scanning laser ophthalmoscopy improvement by use of Mueller-matrix polarimetry,”
Opt. Lett., 27
(10), 830
–832
(2002). https://doi.org/10.1364/OL.27.000830 0146-9592 Google Scholar
J. M. Bueno,
J. J. Hunter,
C. J. Cookson,
M. L. Kisilak, and
M. C. W. Campbell,
“Improved scanning laser fundus imaging using polarimetry,”
J. Opt. Soc. Am. A, 24
(5), 1337
–1348
(2007). https://doi.org/10.1364/JOSAA.24.001337 0740-3232 Google Scholar
|


