
|
|
1.IntroductionWhen labor occurs prematurely, infants are often not well prepared to survive outside the womb. Preterm birth is unfortunately a common complication, affecting approximately 500,000 babies in the U.S. each year or of all births.1 Better understanding of the normal birth process and development of improved clinical tools to identify women at risk for preterm birth are keys to solving this problem. Synchronized uterine contractions and the successful remodeling of the cervix are required for natural labor and delivery to occur. The cervix is comprised of a stroma containing fibroblasts embedded in extracellular matrix (ECM) made up of primarily type I and to a lesser extent type III fibrillar collagen, proteoglycans, and hyaluronan.2 In preparation for birth, the cervix undergoes an extensive transformation changing from a closed rigid structure to one that can allow passage of a term fetus through the birth canal.2, 3, 4 Biomechanical studies in mouse and human cervix reveal that changes in cervical compliance begin early in pregnancy and continue progressively thereafter, culminating in dramatic loss of tensile strength at the end of gestation, as diagramed in Fig. 1 .3, 5, 6, 7 Current evidence suggests that changes in the extracellular matrix of the cervix underlie the progressive changes in cervical compliance and that these processes are well conserved between human and mouse.8, 9, 10 These changes involve the alteration of fibrillar collagen assembly, its processing, and changes in the composition of other ECM components within the cervix, such as proteoglycans and glycosaminoglycans. In particular, at the end of pregnancy, increased production of the hydrophilic glycosaminoglycan, hyaluronan is important in tissue hydration and disorganization of collagen matrix.11, 12 Soluble collagen, a marker of immature or unprocessed collagen, is increased in the murine cervix as early as day 7 of pregnancy.3 Additionally, a decline in collagen cross-links due to reduced expression and activity of lysyl oxidase has been implicated in the alteration of collagen structure during pregnancy.13, 14 Similarly in humans, increases in collagen solubility correlate with an increase in cervical malleability preceding birth.7, 15, 16, 17, 18, 19, 20 Women with defects in genes involved in collagen assembly or metabolism have a greater incidence of preterm birth due to cervical insufficiency.21 Despite numerous reports suggesting there is a decline in cervical collagen concentration prior to birth, recent studies report no decrease in collagen content, further highlighting the importance of changes in other properties of the collagen matrix.3, 7, 22 Taken all together, there is compelling evidence to suggest that progressive changes in collagen structure accompany cervical remodeling in both women and animal models. Fig. 1(a) Schematic diagram of changes in cervical compliance through mouse pregnancy. Changes in the biomechanical properties of the cervix, described as cervical stiffness, can first be measured on gestation day 12 in the early phase of remodeling, referred to as softening. Thereafter, there is a progressive decline in stiffness, reaching a minimum during ripening and dilation. After birth, the tensile strength of the tissue rapidly returns to a nonpregnant (NP) state. NP, 9–18 refer to day of pregnancy and 2 and refer to hours postpartum. (b) Illustration of sample orientation for SHG detection. Cervices were dissected, frozen in OCT medium, and sectioned transversely in increments. SHG image Z-stacks were collected from each section in a cervical stroma region adjacent to cervical Os as indicated by box. 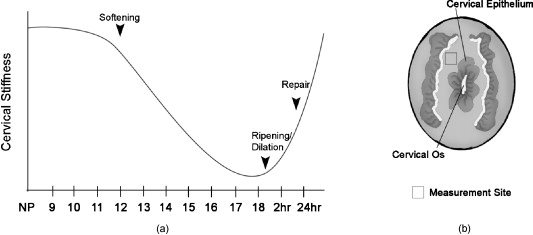 Second harmonic generation (SHG) imaging has recently emerged as a noninvasive tool for high-resolution imaging of fibrillar type I collagen in tissues. Simultaneous interaction of two near-infrared (NIR) photons with noncentrosymmetric structures can result in emission of a single photon at exactly half the wavelength of the excitation light. In particular, collagen type I produces a very robust SHG signal with a nonlinear excitation wavelength between 700 and , allowing a window of detection from .23, 24 Because individual collagen fibrils are the source of the SHG signal, this method has the potential to spatially resolve collagen organization at the submicrometer level and provide information regarding physiological changes in collagen structure that correlate with tissue function. A recent SHG study of artificial hydrogels of collagen type I, shows that image features such as pore size and fiber size correlate well with measurements of collagen morphology by other methods such as scanning electron microscopy. These studies also demonstrate that changes in these features reflect the varying biomechanical properties of the collagen gels.25 In the present study, we apply SHG microscopy on frozen sections of mouse cervical tissue to characterize quantitatively the changes in collagen structure during cervical remodeling and show that SHG imaging provides a valuable tool to evaluate the progressive changes of collagen structure in the cervical ECM throughout normal pregnancy and in a mouse model of preterm birth. These studies demonstrate that pending the development of suitable endoscopes, SHG imaging has great potential as a tool for staging pregnancy and predicting preterm birth in the obstetrics clinic. 2.Materials and Methods2.1.Animals and Tissue Collection2.1.1.Normal pregnancy progressionMice used for normal pregnancy studies were of C57B6/129Sv mixed strain. Female mice were housed overnight with male mice and separated the following morning. The presence of a vaginal plug was checked every morning and mice with plugs were considered to be day 0 of their pregnancy with birth occurring early on gestation day 19. Cervices were collected from nonpregnant mice (NP) as well as mice on days 6, 12, 15, and 18.75 of gestation. In general, cervices were collected at noon for all time points except day 18 for which cervices were collected between 6 and 7 P.M. in order to collect cervices a few hours prior to onset of labor. Cervices were dissected with uterus and vaginal tissue still attached in order to control for orientation of tissue during cutting and imaging. All studies were conducted in accordance with the standards of humane animal care described in the National Institutes of Health Guide for the Care and Use of Laboratory Animals using protocols approved by an institutional animal care and research advisory committee. 2.1.2.Mifepristone treated (preterm birth model)Administration of the progesterone receptor antagonist, mifepristone, results in premature cervical ripening, and preterm birth after injection.26, 27 Mice were given of mifepristone (RU486) in Triolene oil (Sigma) or vehicle control (Triolene only) by subcutaneous injection at on the morning of gestation day 15. Mice were sacrificed and cervices collected later. 2.1.3.Tissue processingCervices were obtained from two nonpregnant mice and three mice at each gestation time point or treatment group, and the tissue was snap frozen at liquid nitrogen temperature in OCT compound (Tissue Tek, Elkhart, Indiana). The entire length of the cervix was cut transversely into serial sections. In general, 18 to 20 sections ( total thickness) were obtained from nonpregnant, and gestation day 6 and 12 cervix, while 36–40 sections ( total thickness) could be obtained from cervices at gestation days 15 and 18, reflecting the growth of the cervix during late pregnancy. Sections were mounted in PBS on glass slides under No. 1.5 glass coverslips (Corning, Corning, New York). 2.2.MicroscopyFrozen sections were imaged on a Zeiss LSM510 META NLO configured with an Axiovert 200M inverted microscope and using an Achroplan objective lens. A Chameleon XR pulsed Ti:sapphire laser (Coherent, Santa Clara, California) tuned to was focused onto stroma of the cervix and the resulting SHG signal was detected at . A forward-scattered signal was detected with the transmitted light detector of the microscope after excitation light was removed by a HQ 450 sp-2p filter (Chroma Technology, Vermont). A back-scattered signal was detected with a nondescanned detector placed at the illumination port of the wide-field epifluorescence light path. Back-scattered excitation light was removed using a short-pass dichroic mirror. Z-stacks of each frozen section were generated by acquiring images at intervals through the thickness of the tissue. For intensity comparisons, the laser power, and the gain and offset of the detectors was set for optimal imaging of day 18 cervix, and these settings were used for images at all time points. Laser power measured at the focal plane of the specimen was . The forward detector gain and amplifier offset were and , respectively. The backward detector gain and amplifier offset were and , respectively. For fiber size and porosity measurements, the forward detector gain was varied over the range to optimize signal to noise within the linear range of the detectors for each day of pregnancy. For consistency between samples, we imaged the same general region of the cervix in each section. Images were taken in the stromal matrix between exocervix/vaginal epithelium and endocervix epithelium [Fig. 1]. The number of images collected for each experiment is indicated in the figure legends. Emission spectra were obtained in scan mode with excitation at either 800 or . Images were collected from using the META detector at its maximum spectral resolution of per detection channel. 2.3.Quantitative MeasurementsImages were analyzed using ImageJ 1.41k.28 To avoid edge effects (attenuation of the SHG signal at the top and bottom of the section), only the central five images of each z-stack were included in the measurements. To quantify image intensity, images were filtered using a Gaussian blur with a kernel radius of to reduce shot noise and a minimum intensity threshold was set interactively to exclude the spaces between collagen fibers. Mean gray value limited to threshold of each image was calculated. Total SHG intensity for each z-slice was taken as the sum of the mean intensities of the forward and backward channels. The algorithms used to measure fiber size and porosity were adapted from previous SHG studies.25 In brief, characteristic fiber size was ascertained using the FD Math function of ImageJ to obtain the intensity autocorrelation of each image. A 2-D Gaussian was fit to a region of interest with a diameter of at the center of the autocorrelation image, omitting the central pixel (which represents shot noise), and two times the standard deviation of the mean was taken as fiber size.25 Data were collected in four regions of interest in each image and averaged to obtain the mean fiber size per image. For measurements of porosity, a minimum intensity threshold was set based on the average of five measurements of the mean gray value of interactively chosen regions of interest lacking collagen fibers. A value of 1.25 times the threshold value was used to generate a binary mask. Interactive comparison of the binary masks to the original images showed that this method reliably segments the images into pores and fibers. The particle analysis tool of ImageJ was used to determine the number of pores, mean pore size in , mean spacing between pores, and the fractional area in microns squared covered by the pores in the binary mask. Particles of were excluded from the analysis. 3.Results3.1.Collagen ImagingA robust signal with the appearance of fibrillar collagen was observed in both the forward and backward direction when frozen sections of mouse cervix were imaged with nonlinear excitation. To verify that the images are due to SHG, emission spectra of regions in the cervical stroma from a day 15 sample were obtained at two different excitation wavelengths. Back-scattered emission spectra from were obtained from the same field of view with excitation at either 800 or . In both cases, the emission spectrum had a single narrow peak that shifted from with the change in excitation wavelength, as expected for an SHG signal. Two-photon excited fluorescence was not detected with either excitation wavelength (data not shown). When sections were incubated with collagenase B (Sigma, St. Louis, Missouri) , the SHG signal rapidly disappeared, confirming that collagen was the primary source of the signal (data not shown). 3.2.Changes in Collagen Morphology during PregnancyCervical collagen organization during pregnancy was evaluated using an excitation wavelength of . Forward- and back-scattered SHG images were collected from cervical frozen sections in the transverse orientation from NP mice, and from mice at days 6, 12, 15, and 18 of gestation. Visual inspection of the images revealed numerous striking qualitative differences in morphology at different time points during pregnancy (Fig. 2 ). In samples from animals that were NP or day 6 of pregnancy, the cervical stroma exhibited two distinct domains: a prominent circumferential ring of long, straight, highly aligned fibers surrounding a narrower zone immediately adjacent to the lumen where the fibers appear more randomly arranged. The band of circumferentially oriented fibers was especially evident in the backward SHG images because the SHG signal intensity along the length of the fibers was more uniform compared to the forward direction [Fig. 2 and 2]. A similar circumferential band of SHG positive fibers was also observed in some samples from day 12 of pregnancy but was absent from samples taken at day 15 and later in gestation (see Fig. 2). In the more isotropically organized region adjacent to the lumen, the persistence length of collagen fibers appeared to differ at each stage of pregnancy, with fibers in NP (data not shown) and day 6 samples appearing relatively straight, while those in samples from later in gestation exhibited a more kinked or undulating appearance [compare Figs. 2 and 2 to Figs. 2 and 2]. In addition, the collagen fiber bundles in samples from late in gestation appeared thicker compared to NP and early gestation, and were laterally associated in broad, loose clusters not seen in the earlier time points. The overall intensity of the SHG signal from NP and early pregnancy (days 6 and 12) samples appeared very low compared to days 15 and 18, and was barely detectable at acquisition settings at which the signal from samples at later time points was close to saturation (Fig. 3 ). Comparison of the forward and backward images for a given field of view revealed additional features of collagen organization. Backward images revealed clusters of punctate structures that were not always visible in the forward channel [Fig. 4 arrowhead]. The abundance of these structures increased greatly in samples from late in gestation. The punctate features were often aligned next to fiber bundles visible in both the forward and the backward directions (Fig. 4). and projections of the z-stacks revealed that the puncta are not cross sections of collagen fibers extending along the optical axis [Fig. 4]. Fig. 2SHG signal of collagen reveals dramatic changes in collagen morphology. Images were taken from gestation days: (a–d) 6, (e–f) 12, (g–h) 15, (i–j) 18 cervices in both (a,c,e,g,i) forward and (b,d,f,h,j) backward directions. (a) and (b) show an example of a portion of the circumferential band of fibers prominent in samples from days 6 and 12 [demarcated by dotted lines, (b)]. (c) and (d) show a region closer to the cervical lumen where the fibers appear more randomly oriented. In general, collagen fibers appear thicker and more kinked as gestation progresses. Brightness and contrast for each panel were manipulated individually for optimal visualization of morphology at each time point. Scale bar represents .  Fig. 3Absolute SHG signal intensity changes during pregnancy. Representative (a) forward and (b) backward SHG images taken at gestation days 6, 12, 15, and 18 using identical image acquisition parameters. Brightness and contrast adjustments were identical for all panels shown in (a) and (b) to preserve intensity relationships between the forward and backward channels and between time points. (c,d) Quantitative comparison of signal intensity: Total SHG intensity increases from day 6 to day 15 (c). F/B ratio decreases more than twofold from day 6 to day 12 and then remains constant for the remainder of gestation (d). Difference from a previous time point is statistically significant with . Error bars represent standard error of the mean of 20 images. animals for each time point. Scale bar represents .  Fig. 4Punctate features in the back-scattered images are abundant at later stages of gestation. (a) Forward image of d18 cervix. (b) Backward image of same field of view. Arrowhead denotes a large cluster of punctae not visible in the forward image. (c) , , and maximum intensity projections of the region inside the box show that punctae in the backward image (red), align adjacent to filaments visible in the forward direction (green), and are not cross sections of long filaments extending along the optic axis. Scale bar reprents .  3.3.Quantitative Analysis of Collagen StructureApplication of relatively simple image-analysis tools allows quantification of the morphological differences we observed. Mean intensity of the SHG signal was measured from images of mouse cervix as described in Section 2.3. Mean signal intensity in both the forward (F) and backward (B) directions was found to increase significantly from day 6 to day 15 of pregnancy (Table 1 ). Total SHG signal increased more than twofold between day 6 and day 12 and another 35% from day 12 to day 15 [Fig. 3]. on day 18 was not significantly different from day 15 . The ratio of forward to backward detected SHG signal intensity (F/B) decreased twofold from day 6 to day 12 and then remained unchanged through day 18 [Fig. 3]. Because of the low sensitivity of the forward detector in our system, we were unable to calibrate the F/B ratio using a fluorescent standard, which is assumed to have . Instead, we used the F/B ratio measured from frozen sections of mouse Achilles tendon excited at , which is reported to be 24.9 to 1.29 From images of the Achilles tendon sections taken with the same detector settings we used for the intensity measurements of cervix, and using a laser power of at the specimen plane, we obtained F/B of 0.45, allowing us to correct our intensity measurements for the relative sensitivity of the forward and backward detectors using a correction factor of . The results show that absolute F/B declines from 130:1 to 56:1 between days 6 and 12 of pregnancy. However, we note that the SHG signal was forward directed at all stages of pregnancy, which allowed us to acquire images in the forward direction despite the insensitivity of the detector. Table 1SHG signal intensity.
The characteristic fiber size and porosity of the collagen matrix as revealed by SHG of serial transverse sections from mouse cervices obtained from NP, and gestation days 6, 12, 15, and late 18 were determined as described in Section 2.3. We observed no consistent differences in these morphological features as a function of location in the cervix (data not shown). Inspection of longitudinal sections where the whole length of the cervix can be seen also revealed no obvious location-specific differences in morphology. The results summarized in Table 2 represent mean values measured from images taken throughout the length of the cervix. We consistently observed a somewhat larger fiber size in the backward-detected images compared to the forward-detected images at each time point. Systematic differences in fine detail between forward- and backward-collected SHG have been observed previously and ascribed to the intrinsically superior spatial resolution of the coherent forward-propagating SHG signal as opposed to the backward signal, which arises almost exclusively from incoherent, isotropic scattering of initially forward directed photons.30 In both sets of images, collagen fiber size compared to NP increased progressively 30–40% from early pregnancy (day 6) to late in pregnancy (day 18). The increase at each time point was statistically significant for all conditions (Fig. 5 ). The average number of pores decreased significantly at each timepoint through gestation. Pore-to-pore spacing increased from day 6 to day 18. In contrast, pore size decreased significantly from NP to day 6 and then progressively increased throughout pregnancy reaching significance between days 12 and 15. Pore fractional area decreased significantly from NP to day 6 and remained at the day-6 level throughout pregnancy. Thus, the trend is toward fewer, larger pores with no significant change in fractional area of the pores during pregnancy (Table 2 and Fig. 6 ). Fig. 5Fiber size increases with the progression of pregnancy. Fiber size was measured from (a) forward and (b) backward images and normalized to the value for nonpregnant samples (NP). Differences between all time points are statistically significant with . Bars represent the mean value of measurements from images of transverse sections collected throughout the longitudinal extent of the cervix. Error bars represent standard error of the mean of 94 (NP), 133 (d6), 134 (d12), 91 (d15), and 126 (d18) images. animals for NP; animals for pregnant time points.  Fig. 6Evaluation of changes in spaces (pores) between collagen fibers. SHG images collected in the forward direction were evaluated for (a) the number of pores (b) pore size, (c) distance between pores, and (d) pore fractional area. Pore number declined significantly at each timepoint with . Pore size declined significantly between nonpregnant and day 6 samples and then increased progressively throughout gestation, becoming significant between days 12 and 15 . Pore-to-pore spacing increased significantly beginning at day 12 . Pore fractional area decreased by day 6 and showed no significant change thereafter . Bars represent the mean of measurements from images of transverse sections collected throughout the longitudinal extent of the cervix. Error bars represent standard error of the mean of 94 (NP), 133 (d6), 134 (d12), 91 (d15), and 126 (d18) images. animals for NP; animals for pregnant time points.  Table 2Quantitative SHG measurements throughout gestation.
3.4.Preterm Birth ModelIn humans and animal models, administration of progesterone receptor antagonists initiates cervical ripening and increases responsiveness of the uterus to contractile agents.31 Premature delivery induced by the progesterone receptor antagonist mifepristone has been investigated as one animal model for preterm birth with relevance to human cervical biology.26, 27 To see how closely the effects of treatment with mifepristone parallel the changes in collagen structure we observed during the normal course of pregnancy, the morphology of mifepristone treated cervical tissue was assessed by SHG microscopy of frozen sections [Figs. 7 and 7 ]. Animals were treated with mifepristone or vehicle on day 15 of pregnancy as described in Section 2.1.2. Mifepristone-induced changes in collagen structure did not mimic the changes observed during natural progression of gestation from day 15 to day 18. intensity declined in treated samples when compared to the control [Fig. 7], whereas no significant change was observed between days 15 and 18 during normal ripening (Fig. 3). No difference was seen in F/B ratio between treatment and vehicle (Fig. 7). Cervices of mifepristone-treated animals exhibited only modest differences in collagen fiber size and pore-to-pore spacing compared to vehicle controls (Table 2). In contrast, we observed a twofold increase in mean pore size, offset by a modest decrease in mean number of pores per unit area in tissue from treated animals relative to the vehicle controls, resulting in a 55% overall increase in pore fractional area measured in the forward direction [Fig. 7, 7, 7, 7]. Fig. 7Changes in collagen structure with mifepristone treatment do not mimic normal cervical ripening. Visual inspection of images from (a) vehicle- or (b) mifepristone-treated samples reveals a change in spacing between collagen fibers. Quantitative measurement of (c) total signal intensity and (d) F/B ratio reveals a decline in SHG intensity in samples from treated animals compared to untreated controls [(c) , (d) ]. The number of pores per unit area in cervices from treated animals is decreased relative to the vehicle control [(e) ]. Pores are significantly larger in size [(f) ] and spaced farther apart [(g) ]. Pore fractional area increases significantly upon treatment [(h) ]. Bars represent the mean of measurements from images of transverse sections collected throughout the longitudinal extent of the cervix. Error bars represent standard error of the mean of 62 images for control and 52 images for treatment. animals/treatment group. Scale bar represents . 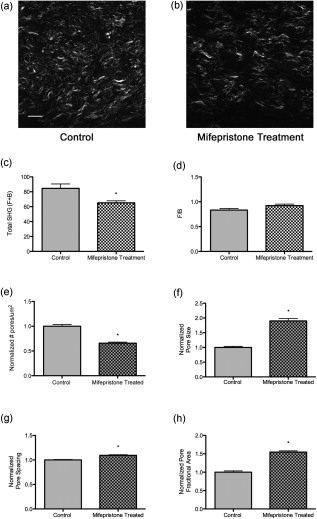 4.DiscussionWe report the application of SHG microscopy for imaging collagen modifications that begin early in pregnancy and progress to birth. Key findings from this study are the identification of quantifiable changes in SHG signal intensity, collagen fiber size, and matrix porosity that accompany progressive changes in collagen organization during normal cervical remodeling. Second, SHG microscopy reveals that change in collagen matrix ultrastructure in the mifepristone preterm birth model does not mimic the normal ripening process. Previous studies utilize autofluorescence spectroscopy of collagen or picrosirius red staining to evaluate changes in collagen ultrastructure during pregnancy and labor.32, 33, 34 SHG has distinct advantages over both these methods because it allows the visualization of collagen ultrastructure at submicrometer resolution without exogenous staining. Second, multiparametric quantitative analysis of SHG images taken from mouse cervix at various stages of pregnancy provides novel insight into collagen matrix reorganization during pregnancy and labor. Three features of collagen are quantified from SHG images: signal intensity, fiber size, and porosity. Total SHG signal intensity increased progressively from day 6 to day 15 of gestation, with a more than twofold increase between days 6 and 12. In biological tissues, the primary source of SHG signal is reported to be type I collagen.23 Because the strength of the overall SHG signal is expected to scale as the square of the number of scattering domains, increased signal intensity can be explained by increased collagen concentration.35 However, there is no significant change in total collagen content in mouse cervix during gestation.3 Another possible source of increased SHG signal strength could be an increase in the relative proportion of type I collagen to collagen type III, which is not strongly susceptible to SHG.23 Protein blots of urea-extractable collagen using antibodies specific for collagen I or III (Abcam, Cambridge) showed no change in the relative amount of collagen type I or type III during gestation in the mouse cervix (data not shown) and confirmed previous reports that total collagen does not change significantly during pregnancy3. Immunofluorescence staining of frozen sections also revealed no significant changes in the amounts or proportions of collagen I and collagen III through gestation (data not shown). In biological tissues, changes in SHG signal intensity may also reflect changes in collagen organization that take place along the optical axis on a length scale comparable to the SHG wavelength and thus provide information on collagen features that are at or below the limit of resolution of the objective lens. In general, an increase in overall SHG intensity may reflect increased fibril diameter, higher packing density of fibrils in fibers, or higher packing order.36, 37, 38 Because of the coherent nature of SHG generation, SHG signals are intrinsically forward propagating. A backward signal can arise in cases where quasi-phase matching occurs due to periodicity of structures along the optical axis. In thick specimens, such as the frozen sections used here, forward-emitted photons may also contribute to the backward signal through incoherent scattering within the tissue.37 Changes in the ratio of forward to backward SHG signal intensity are indicative of changes in tissue properties at a length scale on the order of the excitation and emission wavelengths, which are at or below the resolution of the microscope. The more than twofold decrease we observed in F/B ratio from day 6 to day 12 suggests there may be changes in fibril size and packing, and/or an increase in the scattering coefficient of the tissue during this time period.37 Collagen fibrils are laterally associated into bundles that can be resolved in SHG images and are referred to here as fibers. Quantitative assessment of the characteristic size of these fibers in SHG images shows that characteristic fiber size increases progressively through the course of pregnancy. The increase in fiber size is accompanied by a transition from relatively straight fibers to kinked or wavy fibers. In general, shorter persistence length of a polymer is associated with reduced bending rigidity. Thus, the change in morphology of the bundles is consistent with decreased tensile strength of the collagen matrix as pregnancy progresses toward term. Studies of collagen morphology in tendon and in the skin of a mouse model for osteogenesis imperfecta suggest that waviness correlates with loss of strength.36, 39, 40 Bending or kinking of collagen may reflect the decreased abundance of cross-links in cervical collagen fibrils during the course of pregnancy.13 Porosity measurements identify areas where collagen is absent or in a form that does not generate SHG signal, such as soluble collagen or collagen III. These “pores” most likely include spaces occupied by cells or blood vessels, as well as extracellular areas lacking insoluble type I collagen. During pregnancy, we observed that a decline in the number of pores was balanced by an increase in pore size, resulting in no net change in pore fractional area. This is consistent with the idea that changes in the collagen organization during normal term pregnancy reflect rearrangement rather than degradation of collagen. Two additional features of the cervical collagen matrix change during the course of pregnancy. First is the circumferential ring of fibers prominent in day-6 and day-12 specimens that disappear by day 15. A similar region of circumferential collagen fibers, interspersed with smooth muscle cells and fibroblasts, is identified in the cervix of pregnant rat by picosirius red staining and by polarization microscopy.32 In rat, the disappearance of this ring of collagen at later stages of pregnancy is accompanied by apoptosis of both smooth muscle cells and fibroblasts.41 In addition, we observed an accumulation of punctate SHG signal in the backward-detected images as pregnancy progressed. Studies of collagen in other tissues report punctate signal in the backward channel and attribute it to unfused segments of immature collagen.36 This interpretation is consistent with extensive collagen remodeling during pregnancy and also with a reduced abundance of collagen cross-links at term. In contrast, a recent paper demonstrates that punctate patterns can arise from destructive interference in the back-scattered SHG signal,37 similar to the case of speckle in confocal reflectance imaging,42 making a fiber that appears continuous in the forward image appear discontinuous in the backward direction. We note that the punctate structures in the backward channel of cervical images often do not overlap with fibers detectable in the forward direction and, in fact, tend to interdigitate with fibers visible in the forward direction (Fig. 4). This suggests that a dramatically different collagen microstructure in these regions produces SHG with a greatly reduced F/B ratio. Further study will be required to understand the origin of the punctate structures in SHG images of cervical tissue. The power of SHG imaging as a tool to investigate collagen remodeling is shown in the ability to distinguish collagen reorganization in mice treated with mifepristone from normal remodeling. Specifically, a decrease in overall intensity in samples from the mifepristone-treated animals and an increase in the number and size of pores, resulting in a 54% increase in pore fractional area is seen in treated mice. These findings suggest that premature cervical ripening in the progesterone withdrawal model occurs via different mechanisms from normal cervical ripening. This conclusion is supported by both biomechanical and gene-expression studies, which report the cervical ripening induced in mifepristone-treated rats or mice respectively does not reach the degree of ripening or harbor the same gene-expression patterns characteristic of normal term cervix.27, 43, 44 The increased pore fractional area could be indicative of increased collagen degradation, increased cellularity, or increases in hydration and hyaluronan content. The accompanying decrease in overall SHG signal intensity suggests that mifepristone induces degradation of collagen type I or collagen structure undergoes a different transformation as compared to term ripening in mouse cervix. Studies in term pregnant women treated with mifepristone suggest a decline in synthesis with little change in collagen abundance.40 However, in the rat there is a report of increased collagen degradation with mifepristone treatment.27 Collagen reorganization during normal pregnancy in mice is characterized by two overlapping regimes. Submicroscopic changes resulting in increased SHG intensity and decreased F/B ratio are complete by day 15. Meanwhile, several macroscopic features change progressively throughout pregnancy, resulting in increased fiber size and pore size, accompanied by a transition from straight to kinked fibers and accumulation of punctate signal in the backward images. Although the relationship of these changes to the biomechanical changes occurring over the same time period is not yet clear, we note that increased fiber size and pore size in SHG images of artificial collagen gels correlated with decreased stiffness of the material.25, 45 Even without a detailed understanding of the molecular origin of the changes in SHG images during pregnancy, the information obtained by SHG imaging may have value as a diagnostic tool for detecting premature cervical ripening and impending preterm birth in women earlier and with greater accuracy than current measurements of cervical length by sonography.46 Application of SHG endoscopes47, 48 and more sophisticated image analysis algorithms to distinguish the stages of gestation will be required to utilize back-scattered SHG as a clinical tool in the obstetrics clinic. The ability to better identify women at risk for preterm birth along with improved therapies could have a significant impact in reducing the incidence of prematurity. AcknowledgmentsAll imaging was carried out at the UTSW Live Cell Imaging Facility, with the expert assistance of Abhijit Bugde. We are indebted to Dr. Paul Campagnola for valuable advice on the interpretation of SHG intensity data. We thank Dr. Don McIntire for assistance with statistical techniques. The illustration in Fig. 1 was drawn by Laura M. Tillberg. This work was supported in part by the National Institutes of Health Grant R01HD043154 and The Hartwell Foundation (to M.M.). ReferencesCommittee on Understanding Premature Birth and Assuring Healthy Outcomes (Ed. Board on Health Sciences Policy),
(2006) Google Scholar
P. C. Leppert,
“Anatomy and physiology of cervical ripening,”
Clin. Obstet. Gynecol., 38 267
–279
(1995). https://doi.org/10.1097/00003081-199506000-00009 0009-9201 Google Scholar
C. P. Read,
R. A. Word,
M. A. Ruscheinsky,
B. C. Timmons, and
M. S. Mahendroo,
“Cervical remodeling during pregnancy and parturition: molecular characterization of the softening phase in mice,”
Reproduction, 134 327
–340
(2007). https://doi.org/10.1530/REP-07-0032 Google Scholar
R. A. Word,
“Dynamics of cervical remodeling during pregnancy and parturition: mechanisms and current concepts,”
Semin. Reprod. Med., 25 69
–79
(2007). https://doi.org/10.1055/s-2006-956777 Google Scholar
M. Mahendroo,
A. Porter,
D. Russel, and
R. A. Word,
“The parturition defect in steroid 5a-reductase type 1 knockout mice is due to impaired cervical ripening,”
Mol. Endocrinol., 13
(6), 981
–992
(1999). https://doi.org/10.1210/me.13.6.981 0888-8809 Google Scholar
R. A. Word,
C. Landrum,
B. Timmons,
B. Young, and
M. Mahendroo,
“Transgene insertion of mouse choromosome 6 impairs function of the uterine cervix and causes failure of parturition,”
Biol. Reprod., 73 1046
–1056
(2005). https://doi.org/10.1095/biolreprod.105.042663 0006-3363 Google Scholar
K. M. Myers,
A. P. Paskaleva,
M. House, and
S. Socrate,
“Mechanical and biochemical properties of human cervical tissue,”
Acta Biomaterialia, 4 104
–116
(2008). https://doi.org/10.1016/j.actbio.2007.04.009 Google Scholar
M. House,
D. L. Kaplan, and
S. Socrate,
“Relationships between mechanical properties and extracellular matrix constituents of the cervical stroma during pregnancy,”
Semin Perinatol, 33 300
–307
(2009). https://doi.org/10.1053/j.semperi.2009.06.002 0146-0005 Google Scholar
K. J. Straach,
J. Shelton,
J. Richardson,
V. Hascall, and
M. Mahendroo,
“Regulation of hyaluronan expression during cervical ripening,”
Glycobiology, 15 55
–65
(2005). https://doi.org/10.1093/glycob/cwh137 0959-6658 Google Scholar
B. Timmons,
M. Akins, and
M. Mahendroo,
“Cervical remodeling during pregnancy and parturition,”
Trends Endocrinol. Metab., Google Scholar
M. Ruscheinsky,
C. De La Motte, and
M. Mahendroo,
“Hyaluronan and its binding proteins during cervical ripening and parturition: Dynamic changes in size, distribution and temporal sequence,”
Matrix Biol., 27 487
–497
(2008). https://doi.org/10.1016/j.matbio.2008.01.010 0945-053X Google Scholar
E. El Maradny,
N. Kanayama,
H. Kobayashi,
B. Hossain,
S. Khatun,
S. Lipling,
T. Kobayashi, and
T. Terao,
“The role of hyaluronic acid as a mediator and regulator of cervical ripening,”
Hum. Reprod., 12 1080
–1088
(1997). https://doi.org/10.1093/humrep/12.5.1080 0268-1161 Google Scholar
H. Ozasa,
T. Tominaga,
T. Nishimura, and
T. Takeda,
“Lysyl oxidase activity in the mouse uterine cervix is physiologically regulated by estrogen,”
Endocrinology, 109 618
–621
(1981). https://doi.org/10.1210/endo-109-2-618 0013-7227 Google Scholar
P. Drewes,
H. Yanagisawa,
B. Starcher,
I. Hornstra,
K. Csiszar,
S. Marinis,
P. Keller, and
R. A. Word,
“Pelvic organ prolapse in fibulin-5 knockout mice: pregnancy induced changes in elastic fiber homeostasis in mouse vagina,”
Am. J. Pathol., 170 578
–589
(2007). https://doi.org/10.2353/ajpath.2007.060662 0002-9440 Google Scholar
D. Danforth,
“The effect of pregnancy and labor on the human cervix: changes in collagen, glycoproteins, and glycosaminoglycans,”
Am. J. Obstet. Gynecol., 120 641
–651
(1974). 0002-9378 Google Scholar
K. Maillot and
B. K. Zimmermann,
“The solubility of collagen of the uterine cervix during pregnancy and labour,”
Arch. Gynäk., 220 275
–280
(1976). https://doi.org/10.1007/BF00673411 Google Scholar
H. P. Kleissl,
M. Van Der Rest,
F. Naftolin,
F. H. Glorieux, and
A. De Leon,
“Collagen changes in the human cervix at parturition,”
Am. J. Obstet. Gynecol., 130 748
–753
(1978). 0002-9378 Google Scholar
A. Ito,
K. Kitamura,
Y. Mori, and
S. Hirakawa,
“The change in solubility of type I collagen in human uterine cervix in pregnacy at term,”
Biochem. Med., 21 262
–270
(1979). https://doi.org/10.1016/0006-2944(79)90081-4 0006-2944 Google Scholar
T. Rechenberger,
N. Uldbjerg, and
H. Oxlund,
“Connective tissue changes in the cervix during normal pregnancy and pregnancy complicated by cervical incompetence,”
Obstet. Gynecol., 71 563
–567
(1988). 0029-7844 Google Scholar
K. Myers,
S. Socrate,
D. Tzeranis, and
M. House,
“Changes in the biomechanical constituents and morphologic appearance of the human cervical stroma during pregnancy,”
Eur. J. Obstet. Gynecol. Reprod. Biol., 144 S82
–S89
(2009). https://doi.org/10.1016/j.ejogrb.2009.02.008 0301-2115 Google Scholar
E. A. Anum,
L. D. Hill,
A. Pandya, and
J. F. Strauss,
“Connective tissue and related disorders and preterm birth: clues to genes contributing to pregnancy,”
Placenta, 30 207
–215
(2009). https://doi.org/10.1016/j.placenta.2008.12.007 0143-4004 Google Scholar
P. C. Leppert and
S. Y. Yu, The Extracellular Matrix of the Uterus, Cervix, and Fetal Membranes: Synthesis, Degradation, and Hormonal Regulation, Perinatology Press, Ithica, NY
(1991). Google Scholar
G. Cox,
E. Kable,
A. Jones,
I. Fraser,
F. Manconi, and
M. D. Gorrell,
“3-Dimensional imaging of collagen using second harmonic generation,”
J. Struct. Biol., 141 53
–62
(2003). https://doi.org/10.1016/S1047-8477(02)00576-2 1047-8477 Google Scholar
P. Friedl,
K. Wolf,
U. H. von Andrian, and
G. Harms,
“Biological second and third harmonic generation microscopy,”
Curr. Protocols Cell Biol., 4.15
(2007). https://doi.org/10.1002/0471143030.cb0415s34 1934–2616 Google Scholar
C. Raub,
J. Unruh,
V. Suresh,
T. Krasieva,
T. Lindmo,
E. Gratton,
B. J. Tromberg, and
S. C. George,
“Image correlation spectroscopy of multiphoton images correlates with collagen mechanical properties,”
Biophys. J., 94 2361
–2373
(2008). https://doi.org/10.1529/biophysj.107.120006 0006-3495 Google Scholar
D. J. Dudley,
D. W. Branch,
S. S. Edwin, and
M. D. Mitchell,
“Induction of preterm birth in mice by Ru486,”
Biol. Reprod., 55 992
–995
(1996). https://doi.org/10.1095/biolreprod55.5.992 0006-3363 Google Scholar
K. Clark,
H. Ji,
H. Feltovich,
J. Janowski,
C. Carroll, and
E. Chien,
“Mifepristone-induced cervical ripening: structural, biomechanical, and molecular events,”
Am. J. Obstet. Gynecol., 194 1391
–1398
(2006). https://doi.org/10.1016/j.ajog.2005.11.026 0002-9378 Google Scholar
F. Legare,
C. Pfeffer, and
B. R. Olsen,
“The role of backscattering in SHG tissue imaging,”
Biophys. J., 93 1312
–1320
(2007). https://doi.org/10.1529/biophysj.106.100586 0006-3495 Google Scholar
T. A. Theodossiou,
C. Thrasivoulou,
C. Ekwobi, and
D. L. Becker,
“Second harmonic generation confocal microscopy of collagen type I from rat tail tendon cryosections,”
Biophys. J., 91 4665
–4677
(2006). https://doi.org/10.1529/biophysj.106.093740 0006-3495 Google Scholar
K. Chwalisz,
“The use of progesterone antagonists for cervical ripening and as an adjunct to labour and delivery,”
Hum. Reprod., 9 31
–161
(1994). 0268-1161 Google Scholar
S. Yu,
C. A. Tozzi,
J. Babiarz, and
P. C. Leppert,
“Collagen changes in rat cervix in pregnancy—polarized light microscopic and electron microscopic studies,”
360
–368
(1995). Google Scholar
H. Maul,
G. Saade, and
R. E. Garfield,
“Prediction of term and preterm parturition and treatment monitoring by measurement of cervical cross-linked collagen using light-induced fluorescence,”
Acta Obstet. Gynecol. Scand., 84 534
–536
(2005). 0001-6349 Google Scholar
D. Schlembach,
L. MacKay,
L. Shi,
W. Maner,
R. Garfield, and
H. Maul,
“Cervical ripening and insufficiency: from biochemical and molecular studies to in vivo clinical examination,”
Eur. J. Obstet. Gynecol. Reprod. Biol., 144 S70
–S76
(2009). https://doi.org/10.1016/j.ejogrb.2009.02.036 0301-2115 Google Scholar
L. Moreaux,
O. Sandre,
S. Charpak,
M. Blanchard-Desce, and
J. Mertz,
“Coherent scattering in multi-harmonic light microscopy,”
Biophys. J., 80 1568
–1574
(2001). https://doi.org/10.1016/S0006-3495(01)76129-2 0006-3495 Google Scholar
R. M. Williams,
W. R. Zipfel, and
W. W. Web,
“Interpreting second-harmonic generation images of collagen I fibrils,”
Biophys. J., 88 1377
–13866
(2005). https://doi.org/10.1529/biophysj.104.047308 0006-3495 Google Scholar
R. LaComb,
O. Nadiarnykh,
S. Townsend, and
P. Campagnola,
“Phase matching considerations in second harmonic generation from tissues: effects on emission directionality, conversion efficiency and observed morphology,”
Opt. Commun., 281 1823
–1832
(2008). https://doi.org/10.1016/j.optcom.2007.10.040 0030-4018 Google Scholar
R. LaComb,
O. Nadiarnykh, and
P. Campagnola,
“Quantitative second harmonic generation imaging of the diseased state osteogenesis imperfecta: experiment and simulation,”
Biophys. J., 94 4504
–4514
(2008). https://doi.org/10.1529/biophysj.107.114405 0006-3495 Google Scholar
T. Gustmann,
G. Fantner,
M. Venturoni,
A. Ekani-Nkodo,
J. Thompson,
J. Kindt,
D. Morse,
D. Kuchnir,
D. K. Fygenson, and
P. K. Hansma,
“Evidence that collagen fibrils in tendons are inhomogeneously structured in a tubelike manner,”
Biophys. J., 84 2593
–2598
(2003). https://doi.org/10.1016/S0006-3495(03)75064-4 0006-3495 Google Scholar
O. Nadiarnykh,
S. Plotnikov,
W. A. Mohler,
I. Kalajzic,
D. Redford-Badwal, and
P. J. Campagnola,
“Second harmonic generation imaging microscopy studies of osteogenesis imperfecta,”
J. Biomed. Opt., 12 051805
(2007). https://doi.org/10.1117/1.2799538 1083-3668 Google Scholar
P. C. Leppert,
“Proliferation and apoptosis of fibroblasts and smooth muscle cells in rat uterine cervix throughout gestation and the effect of antiprogesterone onapristone,”
Am. J. Obstet. Gynecol., 178 713
–725
(1998). https://doi.org/10.1016/S0002-9378(98)70481-8 0002-9378 Google Scholar
J. W. Goodman, Statistical Optics, Wiley(1985). Google Scholar
I. Buhimschi,
L. Dussably,
C. Buhimschi,
A. Ahmed, and
C. Weiner,
“Physical and biomechanical characteristics of rat cervical ripening are not consistent with increased collagenase activity,”
Am. J. Obstet. Gynecol., 191 1695
–1704
(2004). https://doi.org/10.1016/j.ajog.2004.03.080 0002-9378 Google Scholar
J. M. Gonzalez,
H. Xu,
E. Ofori, and
M. A. Elovitz,
“Preterm and term cervical ripening in CD1 mice (Mus musculus): similar or divergent molecular mechanisms,”
Biol. Reprod., 81 1226
–1232
(2009). https://doi.org/10.1095/biolreprod.108.075309 0006-3363 Google Scholar
C. B. Raub,
V. Suresh,
T. Krasieva,
J. Lyubovitsky,
J. D. Mih,
A. J. Putnam,
B. J. Tromberg, and
S. C. George,
“Noninvasive assessment of collagen gel microstructure and mechanics using multiphoton microscopy,”
Biophys. J., 92 2212
–2222
(2007). https://doi.org/10.1529/biophysj.106.097998 0006-3495 Google Scholar
J. D. Iams,
R. L. Goldenberg,
B. M. Mercer,
A. H. Moawad,
P. J. Meis,
A. F. Das,
S. N. Caritis,
M. Miodovnik,
M. K. Menard,
G. R. Thurnau,
M. P. Dombrowski, and
J. H. Roberts, National Institute of Child Health and Human Development Maternal–Fetal Medicine Units Network,
“The Preterm prediction study: can low-risk women destined for spontaneous preterm birth be identified,”
Am. J. Obstet. Gynecol., 184 652
–655
(2001). https://doi.org/10.1067/mob.2001.111248 0002-9378 Google Scholar
H. Bao,
J. Allen,
R. Pattie,
R. Vance, and
M. Gu,
“Fast Handheld two-photon fluorescence microendoscope with a field of View for in vivo imaging,”
Opt. Lett., 33 1333
–1335
(2008). https://doi.org/10.1364/OL.33.001333 0146-9592 Google Scholar
Y. Wu,
Y. Leng,
J. Xi, and
X. Li,
“Scanning all-fiber-optic endomicroscopy system for 3D nonlinear optical imaging of biological tissues,”
Opt. Express, 17 7907
–7915
(2009). https://doi.org/10.1364/OE.17.007907 1094-4087 Google Scholar
|
|||||||||||||||||||||||||||||||||||||||||||||||||||||||||||||||||||||||||||||||||||||||||||||||||||||||||||||||||||


