|
|
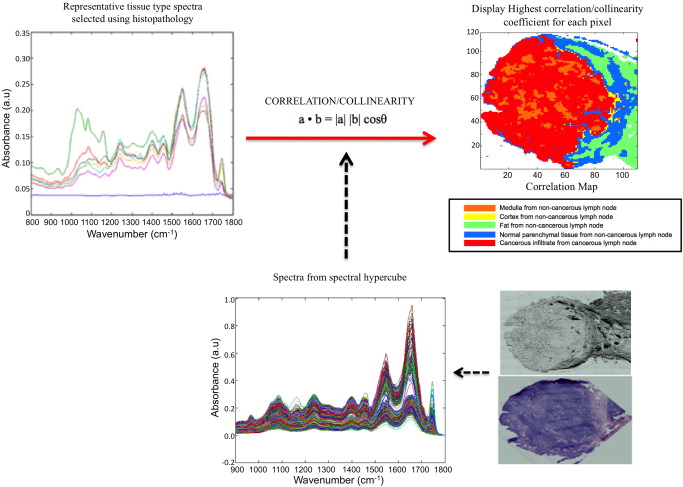
1.IntroductionCancer is a disease where by normal cell division has become uncontrolled and unregulated through mutations in the cell’s DNA, which leads to the formation of a growth or lump of tissue made up of these abnormal tumor cells. These tumor growths can become malignant (cancers), gaining the ability to spread to nearby tissues and organs by invasion and metastasis. Cancer cells from this growth may also break off from the primary tumor and invade the bloodstream or lymphatic vessels to be carried to other parts of the body to multiply and form secondary tumors (metastases). The progression of a primary tumor to formation of a secondary tumor or metastasis carries a worse prognosis and can be associated with poor survival in most cancers.1, 2 Therefore, lymph node sampling and pathological examination is important in assessing whether a primary tumor has spread or has the potential to spread to distant sites to develop secondary tumors.3 The current gold standard of conventional lymph node histopathology staging and grading relies on morphological analysis (i.e., tissue architecture, cell shape, and staining features) by a pathologist. This is subject to significant inter- and intraobserver variation,4 and is also time consuming and difficult to automate. The introduction of immunophenotyping and molecular biology techniques has increased the number of objective parameters that help in distinguishing a normal sample versus a pathologic one.5 However, there is a need for a more sensitive, fully automated, cost-effective and objective tool for screening of tissue slides in lymph node diagnostics. Fourier transform infrared (FTIR) imaging coupled to spectral orthogonality/correlation image analysis may make this a feasible option in the future. This is explored here. FTIR microscopy has the potential to become such a screening technique. It is an optical technique that utilizes absorption spectroscopy, which can be employed to interrogate biological tissues to understand the changes in molecular constituents that are associated with cancer progression from normal to malignant during carcinogenesis. FTIR spectroscopy detects molecular bond vibrations within a sample via interrogation of the sample using the mid-infrared region of light, where the loss of light at each wavelength is measured as it is absorbed by the molecules in the tissue.6, 7, 8 Using the position and intensity of infrared absorption bands, particularly in the mid-infrared region, it has the ability to provide detailed biochemical information, since the spectrum obtained from cellular and tissue measurements is an intrinsic molecular fingerprint of the sample that reveals information about the nucleic acids, carbohydrate, protein and lipid content. Imaging methodologies employing FTIR spectroscopy are of particular interest because of their ability to provide qualitative and quantitative biochemical information from large areas of biological tissue. FTIR spectral imaging has already been applied in a number of studies using human tissue, including lymph nodes,9, 10, 11 prostate,12 lung,13 brain gliomas,14 bone,15 lymphoma,5 cervix,16 and breast.17, 18, 19, 20 Imaging studies involving cluster analysis have successively shown that it is possible to identify the different tissue layers in a tissue section as clusters.21 However, as observed by Romeo and Diem’s group,10 the acquisition of large IR datasets for each image exceeds of memory at times, meaning that the correlation matrix required to be created in cluster analysis programs, such as hierarchical cluster analysis, can exceed . The complex computations needed for generation of the different cluster matrices means that calculations require processors with large memory access. In addition, the separation of tissue types in a cluster map for a particular tissue section and translation to other tissue sections cannot take place without the use of learning algorithms such as artificial neural networks, as demonstrated by Lasch 22 The orthogonality/colinearity or cosine of the angle between two vectors (spectra) can be calculated using an operation called the inner or dot product of two entities, and . To be orthogonal, the inner product of and must be 0. The inner product is one of the most fundamental operations in useful vector spaces. One can apply an orthogonality/colinearity measure in spectroscopy to determine how close one spectrum resembles another spectrum. The colinearity of a spectrum against another spectrum can be calculated using the equation: where and denote the length (magnitude) of and , and is the angle between them.In the equation, a resulting dot product value of 1 represents perfect colinearity, while a dot product value of 0 represents perfect orthogonality. This method effectively provides a value for the correlation of one spectrum with the next. To date, we have been unable to identify any previous tissue studies that used this mathematical correlation procedure with vibrational spectroscopy. In this study, the dot product was used to compare how similar a set of reference or component spectra are to tissue spectra from a hyperspectral cube, and thus can be used as a tool to visualize regions in a sample having similar spectral properties. This helped to discriminate individual tissue types in a section compared to the hematoxylin and eosin (HE) stained slide. By extracting reference spectra to represent the main tissue types in a noncancerous lymph node, as well as tissue spectra from a cancerous lymph node, we were able to illustrate a novel technique to discriminate noncancerous from cancerous nodes using correlation maps. 2.Materials and Methods2.1.Sample PreparationDuring oesophagectomies to remove the primary tumors from patients (who also consented to donation of lymph nodes for spectroscopic studies), lymph node samples were selected and resected. Each lymph node was cut in half, where one half was placed in formalin and sent for routine histopathology (paraffin-embedded sectioning and standard tissue processing), while the other half was snap-frozen in liquid nitrogen and stored in freezers for spectroscopic analysis. Frozen unstained sections thick were prepared using a cold cryotome and were mounted on a calcium fluoride slide. Prior to spectroscopic measurements, these frozen sections were allowed to defrost and air-dry for at least . Infrared spectra were collected using a Perkin Elmer® Spotlight 300 Fourier transform infrared (FTIR) spectroscopy system in transmission mode. The system has a liquid-nitrogen-cooled linear mercury-cadmium-telluride (MCT) array detector, a video camera attached to a microscope to view optical images, and a programmable computerized stage. Image maps (64 sample-background rationed coscans with aperture size of ) within the wave number range with a spectral resolution of were performed on the tissue sections. 2.2.Spectral Processing and AnalysisAll data analysis was performed using Matlab 7® software (MathWorks, Natick, Massachusetts). FTIR map spectra were converted and loaded into Matlab to generate a 3-D hyperspectral matrix for each section. These were then converted to absorbance using: where .Infrared spectra were smoothed using a second-order Savitzky–Golay filter over 19 wavenumber data point spacing to remove short term variations or noise in the spectral dataset. Two representative lymph nodes were selected for a negative noncancerous lymph node and a positive cancerous lymph node. After consultation with a histopathologist using the stained HE sections, areas representative of noncancerous tissue and of cancerous tissue were selected from the total intensity image of the hyperspectral matrix. An in-house Matlab script was developed that allowed the spectra from the areas of interest to be selected and extracted from the hyperspectral matrix of the two representative lymph nodes. From the noncancerous lymph node, areas representing normal cortex, follicle, medulla, capsule, and fat were selected and extracted; whereas areas of cancerous and remaining normal tissue were selected from the cancerous lymph node. A representative morphological-derived tissue spectral dataset was compiled for these tissue spectra. Each pathology-type dataset contained, on average, 3000 spectra. Each dataset was checked for the quality and colinearity of the spectra (the average colinearity within each dataset was with a standard deviation of ). Using these tissue-derived datasets, a mean spectrum was calculated to represent each of the tissue types (Fig. 1 ), which could then be used in the colinearity/correlation calculation with the lymph node hyperspectral datasets. A calcium fluoride spectra dataset was also collected from the hyperspectral images, and another in-house script was developed to filter out the calcium fluoride or nontissue pixels within the hyperspectral images so as not to complicate the colinearity calculation and to provide better visualization of the resulting correlation maps. Fig. 1Extraction of representative tissue spectra from hyperspectral matrix of noncancerous ( ; ; ; ; ) and cancerous lymph node ( tissue; or remaining normal tissue). 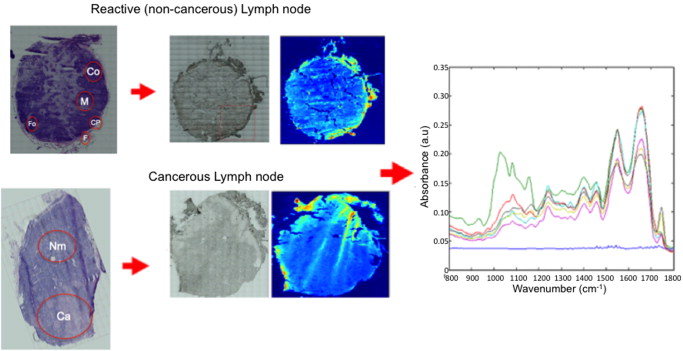 An in-house Matlab script was developed to perform the correlation procedure. The script compares each morphological representative tissue spectra to each spectrum in the hyperspectral map, and generates an array consisting of a value 0 to 1 (0 is no correlation and 1 is perfect correlation) for each pixel of each representative tissue type. The program then determines the highest (most correlated) value for each pixel to determine which representative tissue type spectrum each pixel most represents. This orthogonality-correlation script, in combination with the tissue type representative dataset, was then tested on six noncancerous lymph nodes and seven cancerous lymph nodes. The average time to run this correlation program on a hyperspectral image consisting of spectra was around , and required a standard PC with RAM. Acquisition of the original 30,000 FTIR spectral images of the tissue section takes an additional approximately. Therefore, image acquisition and running of the orthogonality correlation should take under in total. A correlation map was generated, displaying an image where each pixel has a color assigned to it, indicating the tissue or pathology type most representative for that particular spectrum. Figure 2 illustrates this procedure. 3.Results and DiscussionFigure 3 illustrates the correlation maps generated from performing the correlation algorithm on each of the 13 lymph node hyperspectral cubes (six noncancerous and seven cancerous). The cancerous lymph node correlation maps mostly consisted of bright red (cancerous infiltrate representative spectra) and some orange (medulla representative spectra), while the noncancerous lymph node correlation maps mostly consisted of blue (normal parenchymal tissue representative spectra) and green (fat representative spectra) pixels. In summary, this work demonstrates that correlation maps can be used to quickly and efficiently visualize regions of the sample, which have similar spectral properties to key reference spectra. These features correlate favorably with the features identified from the HE-stained slide by a pathologist. By using an in-house-developed orthogonality-correlation script, it was possible to take representative pathology/tissue type spectra and apply a similarity test to spectra of different lymph node samples for both noncancerous and cancerous pathology types. These were reconstructed into correlation maps with specific color coding for cancerous and noncancerous lymph nodes, demonstrating a novel pathological tool in lymph node diagnostics. This technique could be implemented in other tissue types for pathology classification. While histopathology, which is based on tissue architecture, cell shape, and staining features, is the gold standard in lymph node sampling, it can also be time and labor intensive for pathologists and suffers from significant inter- and intraobserver variation.23 There is also the possibility of missing micrometastases, which can be difficult to identify in tissue architecture when using conventional HE staining. Immunohistochemistry and other molecular biology techniques, such as reverse transcriptase polymerase chain reaction (RT-PCR), have helped to improve micrometastasis detection and are also semiautomated; however, these methods can also suffer from high false positive results24 as well as be expensive to perform routinely for lymph node sampling. Infrared spectroscopy is a nondestructive diagnostic tool requiring very little or no tissue processing (and therefore requires less labor and time costs). It also does not require the use of contrast agents and is based on the chemical characteristics of the tissue without the subjective analysis of a pathologist. To validate this procedure, a more robust representative tissue dataset needs to be created from a larger number of lymph nodes from a variety of lymph node disease states. Further inclusion of more lymph node hyperspectral datasets are also needed to properly test and validate this tool; however, this initial study demonstrates real clinical potential for correlation maps. AcknowledgmentThis work is funded by the Pump Prime Fund of Cranfield University and Gloucestershire Hospitals NHS Trust. We would like to thank all contributors to this study, including members of Cranfield University and Gloucestershire Hospitals NHS Trust for their financial and logistical support. Nicholas Stone is the recipient of a Career Scientist Fellowship from the National Institute of Health Research (NIHR), United Kingdom. ReferencesInternational (Ludwig) Breast Cancer Study Group,
“Prognostic importance of occult axillary lymph node micrometastases from breast cancers,”
Lancet, 335
(8705), 1565
–1568
(1990). 0140-6736 Google Scholar
C. Collin,
J. Godbold,
S. Hajdu, and
M. Brennan,
“Localized extremity soft tissue sarcoma: an analysis of factors affecting survival,”
J. Clin. Oncol., 5
(4), 601
–612
(1987). 0732-183X Google Scholar
W. E. Sumner 3rd., M. I. Ross,
P. F. Mansfield,
J. E. Lee,
V. G. Prieto,
C. W. Schacherer, and
J. E. Gershenwald,
“Implications of lymphatic drainage to unusual sentinel lymph node sites in patients with primary cutaneous melanoma,”
Cancer, 95
(2), 354
–360
(2002). https://doi.org/10.1002/cncr.10664 0008-543X Google Scholar
B. F. Burns,
W. Comrie,
A. R. Willan, and
W. T. McCaughey,
“Observer variation in the pathologic diagnosis of malignant lymphoma in Canada,”
Cancer, 62
(2), 314
–318
(1988). https://doi.org/10.1002/1097-0142(19880715)62:2<314::AID-CNCR2820620215>3.0.CO;2-A 0008-543X Google Scholar
E. Burattini,
F. Malvezzi-Campeggi,
M. Chilosi,
C. Conti,
P. Ferraris,
F. Monti,
S. Sabbatini,
G. Tosi, and
A. Zamò,
“FPA micro spectral imaging of non-Hodgkin lymphomas,”
J. Mol. Struct., 834–836 170
–175
(2007). https://doi.org/10.1016/j.molstruc.2006.11.068 0022-2860 Google Scholar
J. M. Chalmers and
P. R. Griffiths, Handbook of Vibrational Spectroscopy, 1 1st ed.Wiley and Sons, New York
(2002). Google Scholar
H. H. Mantsch and
D. Chapman, Infrared Spectroscopy of Biomolecules, 1st ed.Wiley-Liss, New York
(1996). Google Scholar
M. Jackson,
B. Ramjiawan,
M. Hewko, and
H. H. Mantsch,
“Infrared microscopic functional group mapping and spectral clustering analysis of hypercholesterolemic rabbit liver,”
Cell. Mol. Biol., 44
(1), 89
–98
(1998). 0145-5680 Google Scholar
M. Isabelle,
N. Stone,
H. Barr,
M. Vipond,
N. Shepherd, and
K. Rogers,
“Lymph node pathology using optical spectroscopy in cancer diagnostics,”
Spectroscopy, 22
(2–3), 97
–104
(2008). 0887-6703 Google Scholar
M. J. Romeo and
M. Diem,
“Infrared spectral imaging of lymph nodes: strategies for analysis and artifact reduction,”
Vib. Spectrosc., 38
(1–2), 115
–119
(2005). https://doi.org/10.1016/j.vibspec.2005.03.009 0924-2031 Google Scholar
B. Bird,
M. Miljkovic,
M. J. Romeo,
J. Smith,
N. Stone,
M. W. George, and
M. Diem,
“Infrared micro-spectral imaging: distinction of tissue types in axillary lymph node histology,”
BMC Clin. Pathol., 8 8
(2008). https://doi.org/10.1186/1472-6890-8-8 Google Scholar
R. Bhargava,
“Towards a practical Fourier transform infrared chemical imaging protocol for cancer histopathology,”
Anal. Bioanal. Chem., 389
(4), 1155
–1169
(2007). https://doi.org/10.1007/s00216-007-1511-9 1618-2642 Google Scholar
C. Krafft,
D. Codrich,
G. Pelizzo, and
V. Sergo,
“Raman mapping and FTIR imaging of lung tissue: congenital cystic adenomatoid malformation,”
Analyst, 133
(3), 361
–371
(2008). https://doi.org/10.1039/b712958k 0003-2654 Google Scholar
C. Krafft,
M. Kirsch,
C. Beleites,
G. Schackert, and
R. Salzer,
“Methodology for fiber-optic Raman mapping and FTIR imaging of metastases in mouse brains,”
Anal. Bioanal. Chem., 389
(4), 1133
–1142
(2007). https://doi.org/10.1007/s00216-007-1453-2 1618-2642 Google Scholar
A. Boskey and
R. Mendelsohn,
“Infrared analysis of bone in health and disease,”
J. Biomed. Opt., 10
(3), 031102
(2005). https://doi.org/10.1117/1.1922927 1083-3668 Google Scholar
B. R. Wood,
K. R. Bambery,
C. J. Evans,
M. A. Quinn, and
D. McNaughton,
“A three-dimensional multivariate image processing technique for the analysis of FTIR spectroscopic images of multiple tissue sections,”
BMC Med. Imag., 6 12
(2006). https://doi.org/10.1186/1471-2342-6-12 Google Scholar
T. Gao,
J. Feng, and
Y. Ci,
“Human breast carcinomal tissues display distinctive FTIR spectra: implication for the histological characterization of carcinomas,”
Anal Cell Pathol., 18
(2), 87
–93
(1999). 0921-8912 Google Scholar
X. Y. Ci,
T. Y. Gao,
J. Feng, and
Z. Q. Guo,
“Fourier transform infrared spectroscopic characterization of human breast tissue: implications for breast cancer diagnosis,”
Appl. Spectrosc., 53
(3), 102A
–133A
(1999). https://doi.org/10.1366/0003702991946703 0003-7028 Google Scholar
R. K. Dukor,
M. N. Liebman, and
B. L. Johnson,
“A new, non-destructive method for analysis of clinical samples with FT-IR microspectroscopy. Breast cancer tissue as an example,”
Cell. Mol. Biol., 44
(1), 211
–217
(1998). 0145-5680 Google Scholar
R. Eckel,
H. Huo,
H. W. Guan,
X. Hu,
X. Che, and
W. D. Huang,
“Characteristic infrared spectroscopic patterns in the protein bands of human breast cancer tissue,”
Vib. Spectrosc., 27
(2), 165
–173
(2001). https://doi.org/10.1016/S0924-2031(01)00134-5 0924-2031 Google Scholar
B. R. Wood,
L. Chiriboga,
H. Yee,
M. A. Quinn,
D. McNaughton, and
M. Diem,
“Fourier transform infrared (FTIR) spectral mapping of the cervical transformation zone, and dysplastic squamous epithelium,”
Gynecol. Oncol., 93
(1), 59
–68
(2004). https://doi.org/10.1016/j.ygyno.2003.12.028 0090-8258 Google Scholar
P. Lasch,
M. Diem,
W. Hänsch, and
D. Naumann,
“Artificial neural networks as supervised techniques for FT-IR microspectroscopic imaging,”
J. Chemom., 20
(5), 209
–220
(2007). https://doi.org/10.1002/cem.993 0886-9383 Google Scholar
K. Dowlatshahi,
M. Fan,
K. J. Bloom,
D. J. Spitz,
S. Patel,
H. C. Snider Jr.,
“Occult metastases in the sentinel lymph nodes of patients with early stage breast carcinoma: a preliminary study,”
Cancer, 86
(6), 990
–906
(1999). https://doi.org/10.1002/(SICI)1097-0142(19990915)86:6<990::AID-CNCR14>3.0.CO;2-D 0008-543X Google Scholar
S. Noguchi,
T. Aihara,
K. Motomura,
H. Inaji,
S. Imaoka, and
H. Koyama,
“Histologic characteristics of breast cancers with occult lymph node metastases detected by keratin 19 mRNA reverse transcriptase-polymerase chain reaction,”
Cancer, 78
(6), 1235
–1240
(1996). https://doi.org/10.1002/(SICI)1097-0142(19960915)78:6<1235::AID-CNCR10>3.0.CO;2-1 0008-543X Google Scholar
|