
|
|
1.IntroductionRed blood cells (RBCs) in normal human blood tend to form linear and branched aggregates. This RBC aggregation plays an important role in the flow of blood, particularly in the microvascular system. Increased aggregation of RBCs has been observed in various diseases, such as diabetes, HIV infection, myocardial infarction, thrombosis, sepsis, and stroke. Thus, the degree of RBC aggregation is widely accepted as a major determinant of hemorheological characteristics. However, although RBC aggregation certainly affects low-shear blood viscosity, its effects on in vivo flow resistance remain uncertain.1 Various techniques for measuring RBC aggregation have been developed and are described elsewhere.2 Because of their simplicity, optical methods that record the intensity of light have been widely employed to quantify aggregation.3 Different aspects of RBC aggregation have been assessed by recording the intensity of light that is either backscattered from RBCs or transmitted through RBCs.4, 5 Commercial aggregometers, namely, laser-assisted optical rotational cell analyzer (LORCA), (R&R Mechatronics, The Netherlands) and the Myrenne aggregometer (Myrenne GmbH, Germany), have been developed to support these two optical techniques, respectively. LORCA analyzes the backscattered light in a concentric bob-cup system, while the Myrenne aggregometer analyzes the transmitted light by using a cone-plate system. Both methods are widely used for examining the behavior of RBC aggregation under zero—or steady-shear conditions. After cells are completely disaggregated through the application of a dynamic high-shear flow, they are suddenly exposed to a zero-flow condition. Then, the intensity of light is recorded over time and the resulting syllectogram is analyzed with a curve-fitting program to determine aggregation indices such as the AI (aggregation index), half-time , and M index. Light-transmission and -backscattering methods yield quite different results.2 For instance, backscattering analysis yields a higher value of the (aggregation index AI) and a smaller value of (half-time) than transmission analysis. Because of these different values of RBC AIs, experimental results of transmission method cannot be directly compared to those of backscattering method. In order to compensate the differing values of the AI that are yielded by the two methods, a modified definition of AI was introduced for the transmission method.5 For example, an analysis of the transmission syllectogram for yields higher values of AI than that for . These results were reconfirmed in our recent study.6 However, there is still a lack of understanding as to why these two methods yield different values, even though the same light-scattering techniques were adopted. Recently, an orthogonal polarization (OP) spectral (OPS) imaging technique, which can visualize in vivo blood flow through vessels near the skin, was introduced.7, 8 The essential feature of OPS imaging is that polarized light can be depolarized by multiple scattering and the depolarized light can pass though an orthogonal polarizing filter. The directly scattered light, which is still polarized, cannot pass through the orthogonal polarizing filter. After eliminating the directly scattered light from the skin and tissues, the multiple-scattered and depolarized light can be detected. These results make it possible to visualize in vivo blood flow near the skin. It was also proposed that this OP technique could be used to understand the optical measurement of RBC aggregation. To understand the differences between the backscattering and transmission methods, we need a new method for delineating the mechanisms of the optical measurement of RBC aggregation. Therefore, in our study, the OP technique was adopted to analyze the detected light and investigate the characteristics of the two methods for determining RBC aggregation. We measured RBC aggregation with a newly developed microchip-based aggregometer that was reported in our previous study.6 2.Materials and Methods2.1.Sample PreparationVenous blood samples were obtained from 10 healthy male volunteers (between 25 and of age), who were not on any medication and who provided informed consent. Thirty millileters of blood was obtained from each donor using vacuum tubes (Vacutainers, , BD, Franklin Lakes, New Jersey) that contained (K2)EDTA as the anticoagulant. We note that a complicated, multistage process is not required for preparing blood samples, because whole blood can be directly used, as is the case with other aggregometers. However, in this study, a series of processes was conducted to vary the concentration of dextran and/or to adjust the hematocrit. The whole blood was centrifuged at for . The plasma and buffy coat were then removed. To adjust the hematocrit of the blood samples, the RBCs were washed three times with an isotonic phosphate buffered saline (PBS) solution (pH 7.4, ). Then, the washed RBCs were resuspended in autologous plasma with the hematocrit being fixed at 45%. For comparing the sensitivities of the various methods, the washed RBCs were resuspended in isotonic PBS-polymer solutions that were prepared by using various concentrations of the nonionic, water-soluble, polymer dextran, molecular weight (MW) (Dex70). There was no hemolytic presence during the entire test, and all analyses were completed within following the collection of blood. Intra-assay variation was calculated as the coefficient of variation (CV) of 10 repeated measurements on the same sample. Biological variation was expressed as the CV of the data obtained using the control blood samples from the 10 donors. 2.2.Apparatus and Operational ProcedureFigure 1 illustrates a schematic of the microchip-based cell aggregometer system wherein the OP technique is adopted. This system has three subsystems: a laser backscattering system (optical detection system), a microchip stirring system, and a data-analysis system. The laser backscattering system consists of a diode laser ( , Lanics, Korea), photodiodes (FDS1010, Thorlabs Inc., Newton, NJ ), and a set of one polarizer and two orthogonal polarizers. One polarizer was mounted in front of the laser, and the other orthogonal polarizers were mounted in front of the photodiodes. The detected light on the photodiodes was converted to digital signals by the DAQ card (NI, Austin, Texas) and transferred to a computer. Then, the signals were analyzed by the Labview program (data analysis system, NI, Austin, Texas) for obtaining the indices of RBC aggregation. Fig. 1Schematic diagram of the experimental apparatus for backscattering and transmission methods with a polarizer and orthogonal polarizers. 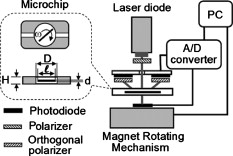 The microchip stirring system consists of a magnet-rotation mechanism and a microchip, including a stirring bar. The magnet-rotation mechanism consists of a rectangular magnet, a rotor, a motor, and a stirrer in a microchip. As the magnet that is mounted on the rotor rotates, the stirrer in the microchip rotates at the same speed as the magnet. The speed of rotation, which can be controlled by the input voltage of a motor, was found to be optimal at . For abruptly stopping the rotating magnet that is mounted on the rotor, a mechanical brake was applied to the rotor to stop the rotor within . The microchip, which was made of plastic, consisted of a circular chamber, a sample inlet, an air outlet, and a stirrer. A typical test chamber was in diameter and in height, unless the chamber height was varied. The microchip was assembled with two plastic plates (one at the top and the other at the bottom), which were fabricated by precision injection molding. On the bottom plate, a fluid pathway including a sample inlet, a circular chamber, and an air outlet were carefully designed. The top and bottom plates were bonded with epoxy. Six microliters of the blood sample were required for filling the test chamber and inlet and outlet channels. Typical test procedures were conducted as follows. The test fluid was placed in the chamber of a microchip. The microchip was then mechanically mounted onto the jig, which was apart from the magnet-rotating mechanism. For disaggregating the RBC aggregates, the stirrer in the microchip rotated at a user-selectable speed for disaggregation of preexisting RBC aggregates ( in the present study), following which the rotating shear is stopped abruptly. Either light reflection or transmission from the suspension is recorded for . After the sudden stoppage of the stirrer in the microchip, there was a transitional phase from a high shear rate that rapidly decreased to zero. However, the duration of the transition, which may depend on the plasma viscosity and the geometry of the aggregometer, was reported to be much shorter than the whole syllectogram period .4 The laser light emitted from the laser diode passes through the polarizer and becomes polarized. The polarized light is irradiated on and scattered by blood cells in the sample fluid. With multiple scattering, the polarized light became depolarized and is allowed to pass through the orthogonal polarizer. Either backscattered or transmitted light was detected by the photodiode, which was linked to the data-acquisition system by a computer. When the stirring suddenly stopped, the disaggregated RBCs started to aggregate. The intensity of light was recorded over time in a syllectogram, as shown in Fig. 2 . As more aggregation transpired, more light was transmitted and the backscattered light decreased. In the syllectogram, after the sudden cessation of stirring, the conventional mathematical representation of the syllectogram takes on the biexponential representation shown as follows: In Eq. 1, and denote the time constants of the aggregation process. Aggregation can be considered a multistage process (i.e., a doublet-, rouleaux-, or 3-D-aggregate formation), which takes only minutes. In the biexponential equation [viz., Eq. 1], and , respectively represent the time constants of the fast rouleaux formation and the slow 3-D aggregate formation.At time , the maximum intensity was obtained [i.e., ]. As measures of RBC aggregation, the parameters of aggregation were determined from the syllectogram by using a curve-fitting program, as shown in Fig. 2.4, 5, 6 The following parameters were defined based on the backscattering method: (i) Amplitude (AMP), the total change in the intensity of reflected light during the period of ; (ii) aggregation half-time , the time for AMP to halve; (iii) surface area (SA), the area above the syllectogram over the first ; (iv) AI, the ratio of the area above the syllectogram to the sum of the areas above and below the curve over the first ; and 5) and , the time constants of the fast rouleaux formation and the slow 3-D aggregate formation, respectively. However, due to similar trends across the listed aggregation parameters, two main parameters (AI, ) were selected and presented for comparing the difference between the light transmittance and light backscattering signals. The use of the LORCA (RR Mechatronics, Hoorn, The Netherlands) as a reference aggregometer has been previously described.4 In brief, the system consists of a Couette geometry that is composed of a glass cup and a precisely fitting bob with a gap between the cylinders; the RBC suspension is contained in the gap. The beam from a laser built into the bob is directed onto the sheared sample. The reflected light is recorded by two photodiodes located in the bob and analyzed by a microcomputer. The sample is first sheared at a user-selectable shear rate for the disaggregation of preexisting RBC aggregates ( in the present study), following which the shearing is stopped abruptly. Light reflection from the suspension is recorded for , and the resulting syllectogram is analyzed to calculate several indices that reflect both the magnitude and duration of aggregation. 3.ResultsPrior to the main experiments, the present study examined the biological variation of RBC aggregation using two different methods. The CV values for measurements on the control samples from the 10 donors were somewhat different for each aggregation parameter, but no significant difference was found between the two methods. For both methods, the lowest biological variations were observed for AI, whereas the highest CVs were for the kinetic parameter, . In addition, the CV values of the 10 repeated measurements on the same sample were for all the aggregation parameters that were measured with the two methods. Similar results can be found elsewhere.9, 10 Figure 2 shows typical syllectograms for the backscattering and transmission methods. While the stirrer rotated, aggregated cells were dispersed and the surface area of the scattering attained a peak. Thus, the intensity of backscattering plateaued at a maximum level, whereas the transmission intensity was minimal. After the stirring suddenly stopped, the intensity of the backscattered light rapidly decreased and the transmission intensity rapidly increased with the lapse of time. These two syllectograms appear to be symmetric. However, there are a surprising number of asymmetries that cause the two methods to yield different values of aggregation indices. The adoption of the OP technique for the backscattering method caused an apparent change in the syllectogram, as shown in Fig. 2. The backscattering method with the OP technique revealed a new syllectogram (dotted line in Fig. 2), which showed an apparent deviation from the syllectogram of backscattering without OP. In Fig. 2, the syllectogram for backscattering yields steeper decrease rather than that for backscattering with OP and these two curves result in significant changes in the analyzed AIs, which are described in Fig. 3 . Fig. 3Effect of the chamber height on AI and for backscattering , transmission , backscattering with orthogonal polarization , and LORCA.  Figure 3 shows the AIs, AI and , which are measured by varying the height, , of the sample chamber. In our measurements, the three following different methods were compared: backscattering without OP ; backscattering with OP ; and transmission without OP . These results were also compared to those of the commercial LORCA aggregometer. As shown in Fig. 3, at the intermediate range of the height of the sample chamber , the backscattering measurements of AI showed good agreement with the LORCA results. We recall that LORCA, which adopts the backscattering method, has a flow gap of in the concentric cylindrical geometry. The transmission measurements show quite smaller values of AI than those of backscattering, even though they are independent of the chamber height. However, the backscattering measurements with OP show good agreement with the transmission measurements . The AI values for become smaller than those for and are almost the same as those for . In other words, the OP technique eliminates the difference between the backscattering and transmission methods in terms of AI measurements. Furthermore, the backscattering measurements with OP yield independence of the chamber height. Similar results were also found in the results for the half-time . The measurements of the half-time for the four cases ( , , , and LORCA), are shown in Fig. 3. The backscattering measurements show good agreement with the LORCA results at the intermediate range of the height of the sample chamber . The transmission measurements yield a considerably larger value than the backscattering measurements. However, the backscattering measurements with OP show good agreement with the transmission measurements. Even though a somewhat unstable region exists at the low range of the chamber height, the half-time for shows good agreement with that for . 4.DiscussionThe backscattering analysis with adopting OP technique yielded good agreement with the transmission analysis. These results might give a clue for understanding the differences between backscattering and transmission methods. Because of the characteristics of the OP technique, only the depolarized light was detected, and the polarized light was excluded from the analysis. The light that penetrated deeply into the cell suspensions and that underwent multiple scattering became depolarized, whereas the light that reflected off the surface-layer cells and directly returned to the orthogonal polarizer remained polarized. The surface-layer cells are the cells located near the surface of blood samples wherein the incident light begins to penetrate. Recall that the polarized light cannot pass through the orthogonal polarizer. Thus, the difference between and was caused by the elimination of the polarized light that was directly backscattered by the cells of the surface layer. Note that indicated lower AIs than . Therefore, it is necessary to explain why the backscattered light from the surface-layer cells causes the AI to be overestimated in the analysis of . When red cells are disaggregated, the surface area of the cells is maximized. Most of the incident light may be backscattered from the surface-layer cells, and some from the deep, suspended cells. Thus, any small change of RBC aggregation in the surface-layer cells may affect significantly on the backscattered intensity, relatively. In fact, as the cells start to aggregate, the corresponding surface area decreases and gates of incident light to penetrate open up. Then, the extent of the light that is backscattered from the surface cells may decrease proportional to the surface area, whereas the extent of the light that penetrates through the surface-layer cells may increase and the possibility of backscattering in bulk cells may increase. However, the backscattered light from bulk cells may be blocked by the surface-layer cells. Therefore, the total backscattered light from cells can rapidly decrease when cells start to aggregate. Thus, the effect of surface-layer cells on backscattering may be significant in the initial stages of aggregation, which cause the values of AI and to be relatively overestimated. Thus, backscattering analysis yields a higher aggregation-index than transmission and backscattering with OP . The adoption of the OP technique in backscattering analysis may minimize the effect of the behavior of surface-layer cells. In that sense, analysis may be very similar to transmission analysis, because both are based on light that is scattered by bulk cells. This may be the reason why the AIs of yielded the same or similar results as those of , as shown in Fig. 4 . However, the agreement between and may be affected by the degree of RBC aggregation. As shown in Fig. 4, there was a relatively large difference between and at a low concentration of dextran. As the RBC aggregation increased with the concentration of dextran, the difference became negligibly small. Fig. 4Effect of the dextran concentration on AI and for backscattering , transmission , backscattering with orthogonal polarization , and LORCA.  The AIs did not significantly vary with the chamber height for and . In other words, both and were independent of the chamber height. However, backscattering showed strong dependencies with regard to the chamber height. Because of the nonlinear characteristics of the syllectogram, it is difficult to interpret the dependence on the chamber height of backscattering analysis. We note that when the chamber height was small, the AIs of backscattering became the same as those of and . For comparing the sensitivities of the various methods, RBC aggregation was measured by four different methods ( , , , and LORCA) with varying concentrations of dextran in PBS, as shown in Fig. 4. For AI and , the measured results showed a slight difference between and , especially at low concentrations (1.5–2%) of the dextran solution. As the dextran concentration increased, the RBC aggregation increased and the difference between and decreased. In addition, for all the methods, there were significant correlations between the dextran concentration and the aggregation parameters. These results showed the same patterns as those measured by LORCA. 5.ConclusionThis paper has described an important methodological study related to the measurement of RBC aggregation. With respect to the light-transmission and light-backscattering methods, this study clearly demonstrated the differences between the data obtained by the two methods, which lead to significantly different calculations of the parameters. Furthermore, the difference was eliminated or minimized if the light reflected from the cells close to the surface was filtered by sending polarized light to the RBC suspension and using an orthogonal polarizer in the pathway of the reflected-scattered light. This is an important finding that may impact on the development of better instruments for measuring RBC aggregation. However, the findings of the present study do not imply that one methodology is more acceptable and valid than the other for testing RBC aggregation in clinical practice. Instead, because the measurements obtained by the two methods yielded comparable results, we reconfirmed that both methods are still valid and acceptable. AcknowledgmentsThis work was supported by the Korea Research Foundation (KRF) Grant No. 2009-0080636 funded by the Korea government (MOST). ReferencesH. J. Meiselman and
O. K. Baskurt,
“Hemorheology and hemodynamics: Dove andare?,”
Clin. Hemorheol Microcirc, 35 37
–43
(2006). 1386-0291 Google Scholar
O. K. Baskurt,
M. R. Hardeman,
M. W. Rampling, and
H. J. Meiselman, Handbook of Hemorheology and Hemodynamics, 242
–266 IOS Press, Amsterdam, The Netherlands
(2007). Google Scholar
H. Zhao,
X. Wang, and
J. F. Stolz,
“Comparison of three optical methods to study erythrocyte aggregation,”
Clin. Hemorheol Microcirc, 21 297
–302
(1999). 1386-0291 Google Scholar
M. R. Hardeman,
J. G. Dobbe, and
C. Ince,
“The laser-assisted optical rotational cell analyzer (LORCA) as red blood cell aggregometer,”
Clin. Hemorheol Microcirc, 25 1
–11
(2001). 1386-0291 Google Scholar
O. K. Baskurt,
H. J. Meiselman, and
E. Kayar,
“Measurement of red blood cell aggregation in a “plate-plate” shearing system by analysis of light transmission,”
Clin. Hemorheol Microcirc, 19 307
–314
(1998). 1386-0291 Google Scholar
S. Shin,
Y. Yang, and
J. S. Suh,
“Measurement of erythrocyte aggregation in a microchip stirring system by light transmission,”
Clin. Hemorheol Microcirc, 41 197
–207
(2009). 1386-0291 Google Scholar
K. Messmer,
“Orthogonal polarization spectral imaging: a new tool for the observation and measurement of the human microcirculation,”
Prog. Appl. Microcirc., 24 1209
–1212
(1999). 0254-5195 Google Scholar
W. Groner,
J. W. Winkelman,
A. G. Harris,
C. Ince,
G. J. Bouma,
K. Messmer, and
R. G. Nadeau,
“Orthogonal polarization spectral imaging: A new method for the study of the microcirculation,”
Nat. Med., 5 6
–10
(1999). 1078-8956 Google Scholar
O. K. Başkurt,
M. Bor-Küçükatay,
O. Yalçin,
H. J. Meiselman, and
J. K. Armstrong,
“Standard aggregating media to test the “aggregability” of rat red blood cells,”
Clin. Hemorheol Microcirc, 22 161
–166
(2000). 1386-0291 Google Scholar
O. K. Başkurt,
M. Uyuklua,
P. Ulkera,
M. Cengiza,
N. Nemethb,
T. Alexy,
S. Shin,
M. Hardeman, and
H. J. Meiselman,
“Comparison of three instruments for measuring red blood cell aggregation,”
Clin. Hemorheol Microcirc, 43 283
–298
(2009). 1386-0291 Google Scholar
|


