
|
|
1.IntroductionThe monitoring of drug diffusion into a cell plays an important role for cell membrane characterization as well as providing an understanding of how drug molecules pass through the phospholipidic bilayer. Surface-enhanced Raman scattering (SERS) is a powerful spectroscopic technique that combines high sensitivity with structural information. The SERS phenomena originates from localized surface plasmon resonances of nanoscopically textured metal structures that lead to large enhancement of Raman scattering fields. This phenomena has the potential of obtaining strong Raman signals from microscopic or even single molecule quantities of analyte.1 The dominant mechanism is an electromagnetic effect that is due to coupling between the Raman field and optically excited surface plasmon resonances in the metal. Thus, SERS is highly dependent on surface plasmon characteristics such as the decay range, which is a few to tens of nanometers from the metal surface.2 A secondary contribution to SERS comes from a chemical mechanism where the probed molecule is adsorbed and thus coupled electronically to the metal nanostructure surface, which leads to a resonance Raman-like enhancement.1 The important characteristic of a SERS structure is nanosized features that lead to high localization of the excited fields. This can be seen in a variety of forms from an ordered array of nanosize objects to amorphous nanostructures such as silver colloids from citrate reduction.3 SERS was previously applied effectively in the study of drug diffusion through artificial membranes.4 SERS and surface-enhanced resonance Raman spectroscopy (SERRS) were used to study diffusion through silastic5 (polydimethylsiloxane) and planar palmitoyloleoylphosphatidylcholine (POPC) monolayers and bilayers, which were employed as membrane models.6, 7 In the first case, metal colloid particles were placed under the silastic membrane. In the case of POPC monolayers and bilayers, SERRS was used to study the interaction of pirarubicin with an artificial membrane, where the membrane was transferred by a Langmuir-Blodgett technique onto a prism coated with silver. A more complicated problem is the detection of drug diffusion through a live cellular membrane. Previously, distribution patterns for anticancer agents8 and photodynamic therapy (PDT) drugs9 were studied using conventional Raman spectroscopy. The SERS technique has also been used for the study of drug diffusion through live cell membranes where gold and silver metal nanoparticles (usually prepared by the methods in Refs. 10, 11) were passively implanted inside cells and the SERS signals from molecular tags and cell compartments were detected.12, 13 However, the use of metal colloids does not enable one to achieve good spatial resolution in the drug distribution due to the inconsistent placement of the colloids in the studied cell. This is why the fabrication of new SERS probes for in vivo applications14 has become a very interesting field for intracellular diagnosis. We use SERS probes, which are micrometer-sized dielectric beads partially covered by nanosized metal colloid particles, to monitor the diffusion of drugs through the membrane of live cancer cells. We show an increased sensitivity of this method in comparison to classical fluorescence techniques. The drug chosen for this study is emodin due to its potential as an anticancer PDT drug. Emodin (6-methyl-1,3,8-trihydroxyanthraquinone) is a naturally occurring anthraquinone extracted from the roots and bark of numerous plants of the genus Rhamnus.15, 16 Previous studies have reported on the antitumoral activity of emodin against certain types of cancers. This action could take place through the inhibition of protein kinase C, protein-tyrosine kinase,17 and also through the mitochondrial18, 19 and membrane lipid raft-associated integrin signaling pathways.20 Thus, an improved method for monitoring the emodin diffusion through the cell membrane is important in light of these studies and can provide information concerning its metabolic pathways from outside to inside the cell. In our experiments, the probes were passively embedded in U87-MG cancer cells through overnight incubation, and due to their micrometer size were assumed to be in contact with the membrane. The SERS signal from the probe depends on the number of molecules that have diffused through the membrane and onto or within close proximity of the metal surfaces. Thus, the Raman signature of the drug can be measured at different times by successive acquisitions of the molecules’ Raman spectra enhanced due to the presence of the probe. Because of their high sensitivity, the probes can be used not only for the detection of drug diffusion through the cellular membrane, but also for monitoring the cellular uptake of these drugs in individual cells. For a typical cellular uptake study, mainly two fluorescence spectroscopy methods are used: fluorescence spectroscopy and flow cytometry.21 For fluorescence methods, the minimal drug concentration that can be detected is rather high because of the requirement to overcome the autofluorescence of the cell system. In flow cytometry, the cell population is treated as an ensemble, giving only average values without specificity to cell compartments. In this paper, the results from the SERS probes are compared with a fluorescence spectroscopy study of the uptake of emodin in the same cell line to demonstrate the feasibility of the SERS probes. 2.Experimental Section2.1.MaterialsEmodin (6-methyl-1,3,8-trihydroxyanthraquinone), dimethylsulfoxide (DMSO), 3-aminopropyl trimethoxysilane (APTMS), silver nitrate , trisodium citrate , sodium dodecyl sulfate (SDS), phosphate-buffered saline (PBS) , and ethanol were obtained from Sigma-Aldrich. The emodin stock solution was prepared in 100% DMSO. Dulbecco’s modified eagle medium (DMEM), fetal bovin serum (FBS), trypsin/EDTA, penicillin, and streptomycin were purchased from Gibco, Invitrogen (United Kingdom). The silica beads were purchased from Micro Particles GmbH (Germany). The aqueous solutions were prepared using deionized water. 2.2.Silver-Covered Silica BeadsSilver colloids were prepared by reduction of silver nitrate by citrate, according to the method described in Ref. 10. Absorption spectra of colloids were characterized between 250 and using a UV-visible Perkin Elmer Lambda 950 spectrophotometer with resolution. Surface-assembled monolayer modification of the silica beads was achieved by slight modification of the method proposed in Ref. 22. Previously, we studied the production of these probes with a complete discussion of the critical parameters in the protocol.23 Briefly, beads of size were dried overnight at and redispersed in of anhydrous ethanol. The beads react with the APTMS solution (0.1% v/v) in ethanol for at room temperature with continuous movement. At this stage, the solution was purified by centrifuging three times at using distilled ethanol and discarding the supernatant. The remaining pellet was further dried slowly at before redispersing in distilled water. Silica beads modified with amino groups were thus obtained. The silver-coated silica beads were prepared in volumes by continuous agitation of the silver colloids and adding the APTMS-modified silica beads. Finally, homogenous silver-coated silica beads were obtained and could be tuned to a range of colloid packing densities on the surfaces. 2.3.CellsU-87 MG human glioma cells were cultured as monolayer and were grown in DMEM containing L-glutamine , sodium pyruvate and glucose , supplemented with 10% FBS, penicillin , and streptomycin . The cells are maintained at in a humidified 5% atmosphere between experiments. For all measurements, the cells were plated in plastic petri dishes with #0 cover glasses on the bottom at an optimal density of . During the measurements, the cells were enclosed in an incubator system (Live Cell Instrument) mounted on the microscope and maintained at in a humidified 5% atmosphere. 2.4.Raman SpectroscopyFigure 1 shows the experimental setup, including an illustration of the embedment and excitation of the probe in the cell. The samples were placed in an inverted microscope (Olympus). The Raman excitation was done with a optical beam from a laser (MicroLaser) focused through a numerical aperture (NA) oil immersion objective (Nikon) at a power of at the sample. The backscattered light was collected by the objective and after a notch filter it passed through a confocal system with a pinhole to a spectrometer. The spectrometer (Acton Research) had a grating and was fitted with a thermoelectrically controlled CCD (Princeton Instruments), cooled to . A video camera provided optical images during experiments. We verified that the probe is embedded in the cell rather than stuck on the top of the membrane or to the coverslip with the cell on top, by changing the focal plane of the microscope and visually checking the position of the focused image of the membrane relative to that of the probe. Fig. 1Depiction of the confocal Raman system used to excite the embedded probes and collect the Raman signal in a backscattering configuration. The inset is an illustration of the probe embedded in a cell as it is being excited by the beam. 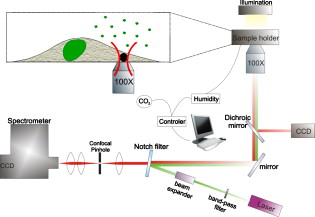 The data from the CCD was proceeded using WinSpec software (Princeton Instruments). For all spectra, a five-point adjacent average smoothing was applied and the background was removed using an established method.24 2.5.Raman Measurement ProtocolsFigure 2 presents an illustration depicting the emodin-diffusion-monitoring experiments with the SERS probes following two protocols. The cells were incubated during the night before the experiment with a fresh culture medium containing the probes. Fig. 2Two protocols used to place the probes in the cell and the consequent emodin diffusion measurement. For both cases, the probes are incubated with the cells overnight before the drug is added for detection. Two experiments are shown: (a) emodin is added to the cells and after a desired incubation time , the cells are rewashed with fresh media, a petri dish of cells is then placed in the microscope stage for Raman measurements; and (b) a petri dish with probes inside the cell is placed on the microscope stage and a drop of emodin, to final concentration , is added . Consecutive spectra from a single probe are collected over a shorter timescale . The symbols for emodin and the probes are defined by the chemical structure and a scanning electron microscopy (SEM) image, respectively. 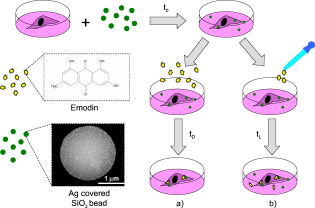 For the primary measurement [Fig. 2], the media of all the samples was replaced with media containing emodin at a concentration. At a given emodin diffusion time , a petri dish of cells was removed from the incubator and rewashed three times with fresh media to remove the excess emodin (emodin that had not diffused into the cell). The cells were then placed in the microscope and the Raman spectra of the probes was recorded. Raman spectra from the probes in six different cells were collected at each elapsed incubation time. This procedure was repeated 5 times, resulting in a total of 30 cells sampled and averaged to produce a single spectrum for each elapsed time. All spectra were collected with a acquisition time at a spectral resolution of . A secondary measurement was conducted to resolve better the range of the diffusion process [Fig. 2]. Consecutive acquisitions were made every from the same SERS probe in a cell after adding a drop of the stock emodin solution such that the final concentration was again . This was repeated 5 times and the spectra were averaged as described before. For all measurements, only the probes that were far from the nucleus, i.e., where the depth of the cell is a few micrometers, were chosen [see Fig. 4 inset in Sec. 4] to be sure that the probe was in contact with the membrane. Fig. 4Monitoring of emodin diffusion using SERS probes: (a) cellular uptake of emodin during ; band (square) and band (triangle); and (b) live cell monitoring of emodin Raman band . Inserted image displays the cell and position of the silver covered silica bead within (red circle). (Color online only.)  2.6.Fluorescence SpectroscopyEmodin in the cell lysate was placed in a quartz cuvette and the fluorescence was measured using a SHIMADZU RF-5301 PC spectrofluorometer with a xenon lamp light source coupled to a monochromator. The signal was detected at to the excitation path. The experiments were carried out at a room temperature and were repeated three times. Three separate spectra were collected at excitation wavelengths corresponding to the three main absorption bands of emodin: 440, 488, and (Ref. 25). The peak intensity value from each emission curve was used as the data point for the diffusion curve at the specific emodin incubation time. 2.7.Fluorescence Measurement ProtocolThe changes in protocol were the absence of the SERS probes in the solutions and using an emodin concentration of . The higher concentration was necessary to obtain a drug fluorescence signal higher than the autofluorescence of the cell. After an incubation time, the cells were washed with PBS (pH 7.4), treated with trypsin/EDTA, harvested, and then centrifuged for at . Then the cells were ruptured with 5% SDS solution and subsequently diluted in 100% DMSO (final percentage 90%) before transferring to a cuvette for measurements. 3.ResultsTo determine appropriate Raman bands that could act as markers of emodin, measurements of two control cases were performed where the probe was in emodin solution and in the cell in the absence of emodin. Figure 3 compares these two control spectra to a typical Raman spectrum of the cell with probe after a long emodin diffusion time. All spectra in Fig. 3 were recorded with the same acquisition time. A significant number of background peaks appear in agreement in all spectra. We attributed most of these peaks to come from the presence of silane that is on the surface of the probe that are similarly enhanced through SERS (Ref. 23). Due to the low concentrations of emodin used, the drug SERS peaks are expected to be weaker than those from the surface groups on the probe that are used to attach the metal colloids, which are constantly within the enhancing fields. The marker bands are identified to be 1170 and [Fig. 3 and 3]. Figure 4 presents the emodin diffusion tracking during a period. The intenisty values from the identified marker bands are used as the data points for the diffusion curve at each emodin incubation time. We included the standard error, defined as the standard deviation divided by the square root of the number of cells tested, which is the appropriate measure when presenting mean values. The repeated measurement for the short time range is given in Fig. 4 for the marker band only. Fig. 3(a) Typical Raman spectrum obtained with the probe embedded in the cell after a long incubation time with emodin (middle plot) is compared to two control measurements where the probe is in the emodin solution (upper plot) and in the cell in the absence of emodin (lower plot). The regions where differences are seen are highlighted in gray. (b), and (c) Individual Raman spectra for the extracted Raman band highlighted in (a) comparing the two spectra from the with (solid line) and without (dashed line) emodin. The arrows show the main Raman bands of emodin, 1170 and , which are used as markers for the monitoring of the emodin diffusion.  To compare these Raman results to a standard technique, the results of the fluorescence spectroscopy uptake measurement, with emodin concentration, are presented in Fig. 5 . Figure 5 presents typical emission spectra from the cell lysate solution at the three excitation wavelengths that correspond to emodin absorption bands. The highest intensity bands are chosen as the markers for the diffusion curves, which are given in Fig. 5. Fig. 5Monitoring emodin uptake with fluorescence spectroscopy: (a) fluorescence spectra of emodin dissolved in the cell lysate to indicate the peak wavelengths to be used as markers at each excitation wavelength ( , line 1; , line 2; and , line 3), and (b) cellular emodin uptake measured by monitoring the intensity maxima of the highest peak from each of the three excitations: 509 (circles), 517 (squares), and (triangles).  4.Discussion4.1.Probe CharacterizationThe combination and improvement of previous chemical techniques allowed for a new robust method for producing the SERS probes. An important feature is the ability to attach any type of metal, both in size and type, to the silica beads, at almost any density on the surface.23 The passive embedment of micrometer-sized dielectric spheres in live cells, through incubation times of the order of hours, was previously reported and attributed to phagocytosis.26, 27, 28 The process is a specific form of endocytosis where larger particles are encapsulated by the cell membrane before the membrane reforms around the particle to transfer it inside. This differs from the usual entry of small particles through typical diffusive or porous pathways through the membrane. The ability to passively embed micrometer-sized latex and silica beads in live cells was previously demonstrated.28 Most importantly, cells similar to the ones studied here have proven to remain viable after incubation and the consequent embedment of numerous micrometer-sized beads. Finally, metal colloids were previously used for SERS studies of live cells and the silver nanostructures were not observed to be toxic to the cell.13 Using the nanosized metal particles alone will still give SERS, however, it is difficult to locate their exact position in the cell. In particular for membrane diffusion studies, it is nearly impossible to determine exactly where the nanoparticle is in relation to the membrane. The anchoring of the metal particles to a larger bead of known size enables one to be sure of their membrane contact by observing the relative distance between the bead surface and the membrane in the focal plane of the imaging system. The determination of appropriate marker bands for the drug is crucial because the dense vibrational spectrum of a cell increases the likelihood of the cell and drug containing common Raman modes. As seen in Fig. 3, the emodin spectrum clearly differentiates from that of the cell at two peak positions: 1170 and . The positions of these two bands agree with previous studies of SERS of emodin in silver colloid solution25 and have been well characterized.29 Bands that are in the vicinity of are thought to originate from OH, , and CH bending motions. This band, in particular, appears in SERS spectra that are excited off resonance, i.e., in the case of our colloids in the near-IR region. Thus, it most likely involves an in-plane CH bending, which is typically insensitive to resonant excitation. The band lies in the region of highest intensities for SERS of emodin that originates from in-plane ring stretching modes.29 The enhancement level of these citrate-reduced silver colloids was noted3 to lie in the range of . However, the Raman spectrum of emodin is weak to nonexistent at standard concentrations in aqueous solutions and in solid form due to the molecules’ high affinity to aggregate. Thus, the molecule typically must be dispersed at very low concentrations to retain its symmetry-dictated properties, such as those that allow the Raman activity, which makes SERS a necessary condition to obtain a measurable Raman spectrum from emodin.30 Additionally, SERS activity must be present to obtain reasonable spectra at short acquisition times and with the extremely minute drug concentrations that are naturally present in the cell. This latter point is quite clear in Fig. 3 in light of the large number of background peaks that are mostly attributed to the surface chemistry of the probe. Determining an enhancement factor for the colloids with emodin is not possible because of the inability to obtain a normal Raman spectra from emodin in the absence of metal. When using these probes, one must also consider the variation of enhancement from probe to probe. This could be due to varying amounts of metal on the surface as well as the size uniformity of the colloids. To counter this, we normalized each spectrum to the intensity of the band, which comes from the APTMS chemical that created the amino group coverage on the probe surface.23, 25 The size of the silica bead and the APTMS coverage on the surface are identical between probes, therefore the intensity of the enhanced Raman band for this material can be used as a relative estimate of the level of probe-induced enhancement. 4.2.Comparison of SERS and Fluorescence Diffusion MonitoringIn the standard fluorescence measurement, the concept of incubating the cells with the drug, then lysing them into solution to measure the drug fluorescence emission is a well-established technique.31 Consequently, the result of Fig. 5 agrees with previous results of emodin diffusion through the human intestinal Caco-2 cell.32 The trend shows common characteristics: a high peak at short incubation time followed by an approximately constant drug concentration for later times. The initial increase of emodin molecules is attributed to its lipofilic character, which allows for the drug accumulating inside the lipidic part of the cell membrane. The decrease of emodin after the initial peak is linked to the drug being pumped out or metabolized by the cell.32 The monitoring of emodin diffusion with the SERS probes, presented in Fig. 4, produces a similar result. Similar to the intensity differences of the fluorescence measurements at different excitation wavelengths, the intensity values for the two marker Raman bands do not coincide. This is most likely due to the disproportionate enhancement of the Raman spectrum as a result of symmetry considerations of each vibrational mode and their coupling to the metal. However, the shapes of the two curves are quite similar and agree well with reference to the incubation time. Most important, the initial climax of emodin concentration at that was present in the fluorescence measurement, is observed in both curves once again. This is seen in Fig. 4 and is further confirmed in the short time range result in Fig. 4. Due to the cell metabolism, the emodin concentration is expected to decrease to a constant level at a long incubation time, as already stated. The concentration dependence obtained with the SERS probe, however, shows a rising tail that then reaches a saturation point where the emodin concentration remains constant at long incubations times. This is possibly due to emodin accumulation in other specific cell compartments such as the mitochondria18, 19 and lysosomes. For drug quantities localized in these areas, the probe would still be sensitive to these molecules as long as they are within the enhancement field decay range, which is typically a few to tens of nanometers.2 We also cannot rule out the possibility of molecule accumulation on the surface of the probe itself. This could cause a rise in the SERS intensity at a slow enough rate such that only the long incubation times are affected. 4.3.Advantages of SERS ProbesThe use of SERS probes for monitoring the drug diffusion through a cell membrane has been shown here to be a tool comparable to common fluorescence techniques. The action of cell lysing and testing the consequent solution in the fluorescence study is a measure of the total cell uptake of emodin. However, a similar trend is seen with the SERS probe that is a measurement of a specific point in the cell. In this paper, only probes that were in the membrane, far from the nucleus, were measured. The similarity is then reasonable when one considers that the pure membrane area makes up a large portion of the cell and is therefore the most responsible for the drug uptake. Future work entails positioning the probe with microinjection techniques to study heterogeneities of the drug diffusion through different areas of the cell. This paper has revealed a number of advantages of SERS probes over conventional fluorescence techniques for the monitoring of drug diffusion through cells. The first is that an order of magnitude less drug concentration could be used. This is important when looking into the onset of drug action in a cell. Second, the use of embedded probes evades the obvious unnatural step of cell lysing and consequent testing of cell components in solution. Aside from the fact that this enables the study of a live cell in a more realistic setting, the added benefit of the single-cell experiment is that a simultaneous combination with other forms of spectroscopy (fluorescence, absorption, etc.) is possible. This leads to less invasive studies of a wider range of parameters under identical cell conditions. Additionally, with more refined injection techniques, the placement of the probes can be user defined, enabling real-time studies and comparisons of drug diffusions through different compartments of the cellular environment. The prevailing disadvantage of SERS versus fluorescence, which must be considered with these probes as well, is the reproducibilty of the metal structures and the consistency of the SERS enhancement. At the onset, SERS is a more volatile optical process because it is highly sensitive to the relative orientation between the molecule and metal surface. Additionally, there are mechanisms between the electromagnetic enhancement, which can occur a short distance away from the metal surface, and the chemical enhancement, which is due to molecular adsorption to the metal, that can be competing or working in tandem, depending on the distance and orientation of the molecule from the metal surface. We found previously that the metal coverage of the SERS probes are highly reproducible and gave consistent SERS intensities for emodin in aqueous solutions.23 However, it is still difficult to obtain consistent enhancement based on the preceding reasons. Despite our normalization procedure, based on the intensity of a Raman band from the silane monolayer of the probe, we believe these factors are strong contributers to the error bars in Fig. 4, which are most likely larger than what would be expected from a typical live cell sample set. Nevertheless, the error at low incubation times is small and worsens at longer times (more than ) making these probes suitable for short-time diffusion characteristics. The inconsistency at longer incubation times could also be due to the build up of emodin at the probe surface, which would skew the measured Raman intensity, or to altered interactions of the drug with the probe surface due to the many other particles in the intracellular medium. We are currently undertaking steps to add a second dielectric layer to cover the metal colloids, which could reduce the amount of accumulation of emodin and other cell material on the surface of the probe. 5.ConclusionWe demonstrated drug diffusion monitoring through a live cell membrane using SERS probes. Micrometer-sized silica beads were partially covered with silver nanocolloids that enhance the Raman signal from molecules that are close to or adsorbed on the bead surface. The probes were embedded in the cell with no perceived damage and excited with a near-IR beam. The resulting spectra show emodin diffusion trends that agree with those found using common fluorescence techniques. The initial fast diffusion is well resolved, while some discrepancies at long drug incubation times remain. AcknowledgmentsWe thank Joan Seoane Suárez (ICREA – Catalan Institution for Research and Advanced Studies, Spain) for providing cells. We acknowledge financial support from Fundació Cellex Barcelona, Spanish Ministry of Science (MIIN FIS2008-00114), and APVV-0449-07 (Slovak Republic). ReferencesX.-M. Qian and
S. M. Nie,
“Single-molecule and single-nanoparticle SERS: from fundamental mechanisms to biomedical applications,”
Chem. Soc. Rev., 37 912
–920
(2008). https://doi.org/10.1039/b708839f 0306-0012 Google Scholar
A. J. Haes,
S. Zou,
G. C. Schatz, and
R. P. Van Duyne,
“A nanoscale optical biosensor: the long range distance dependence of the localized surface plasmon resonance of nobel metal nanoparticles,”
J. Phys. Chem. B, 108
(1), 109
–116
(2004). https://doi.org/10.1021/jp0361327 1089-5647 Google Scholar
K. Kneipp,
H. Kneipp,
I. Itzkan,
R. R. Dasari, and
M. S. Feld,
“Surface-enhanced Raman scattering and biophysics,”
J. Phys. Condens. Matter, 14 R597
–R624
(2002). https://doi.org/10.1088/0953-8984/14/18/202 0953-8984 Google Scholar
L. Lyon,
Ch. Keating,
A. Fox,
B. Baker,
L. He,
S. Nicewarner,
S. Mulvaney, and
M. Natan,
“Raman spectroscopy,”
Anal. Chem., 70
(12), 341
–362
(1998). https://doi.org/10.1021/a1980021p 0003-2700 Google Scholar
E. Wood,
C. Sutton,
A. E. Beezer,
J. A. Creighton,
A. F. Davis, and
J. C. Mitchell,
“Surface enhanced Raman scattering (SERS) study of membrane transport processes,”
Int. J. Pharm., 154 115
–118
(1997). https://doi.org/10.1016/S0378-5173(97)00120-8 0378-5173 Google Scholar
C. Heywang,
M. Chazelet,
M. Masson,
A. Suillerot, and
J. Bolard,
“Incorporation of exogenous molecules inside mono- and bilayers of phospholipids: influence of the mode of preparation revealed by SERRS and surface pressure studies,”
Langmuir, 12
(26), 6459
–6467
(1996). https://doi.org/10.1021/la9601263 0743-7463 Google Scholar
C. Heywang,
M. Chazelet,
M. Masson, and
J. Bolard,
“SERR study of the interaction of anthracyclines with mono- and bilayers of charged phospholipids,”
Langmuir, 13
(21), 5634
–5643
(1997). https://doi.org/10.1021/la962113v 0743-7463 Google Scholar
J. Ling,
S. D. Weitman,
M. A. Miller,
R. V. Moore, and
A. C. Bovik,
“Direct Raman imaging techniques for study of the subcellular distribution of a drug,”
Appl. Opt., 41
(28), 6006
–6017
(2002). https://doi.org/10.1364/AO.41.006006 0003-6935 Google Scholar
C. Otto,
C. J. de Grauwm,
J. J. Duindam,
N. M. Sijtsema, and
J. Greve,
“Applications of micro-Raman imaging in biomedical research,”
J. Raman Spectrosc., 28 143
–150
(1997). https://doi.org/10.1002/(SICI)1097-4555(199702)28:2/3<143::AID-JRS70>3.0.CO;2-9 0377-0486 Google Scholar
P. C. Lee and
D. Meisel,
“Adsorption and surface-enhanced Raman of dyes on silver and gold sols,”
J. Phys. Chem., 86
(17), 3391
–3395
(1982). https://doi.org/10.1021/j100214a025 0022-3654 Google Scholar
W. S. Sutherland and
J. D. Winefordner,
“Colloid filtration: a novel substrate preparation method for surface enhanced Raman spectroscopy,”
J. Colloid Interface Sci., 148
(1), 129
–141
(1992). https://doi.org/10.1016/0021-9797(92)90120-B 0021-9797 Google Scholar
J. Kneipp,
H. Kneipp,
M. McLaughlin,
D. Brown, and
K. Kneipp,
“In vivo molecular probing of cellular compartments with gold nanoparticles and nanoaggregates,”
Nano Lett., 6
(10), 2225
–2231
(2006). https://doi.org/10.1021/nl061517x 1530-6984 Google Scholar
K. Kneipp,
H. Kneipp, and
J. Kneipp,
“Surface-enhanced Raman scattering in local optical fields of silver and gold nanoagregates—from single molecule Raman spectroscopy to ultrasensitive probing in live cells,”
Acc. Chem. Res., 39
(7), 443
–450
(2006). https://doi.org/10.1021/ar050107x 0001-4842 Google Scholar
J. Xie,
Q. Zhang,
J. Y. Lee, and
D. I. C. Wang,
“The synthesis of SERS active gold nanoflower tags for in vivo applications,”
ACS Nano, 2
(12), 2473
–2480
(2008). https://doi.org/10.1021/nn800442q 1936-0851 Google Scholar
C. Tamayo,
M. A. Richardson,
S. Diamond, and
I. Skoda,
“The chemistry and biological activity of herbs used in flor-essence herbal tonic and essiac,”
Phytother Res., 14 1
–14
(2000). https://doi.org/10.1002/(SICI)1099-1573(200002)14:1<1::AID-PTR580>3.0.CO;2-O 0951-418X Google Scholar
Y. Cai,
Q. Luo,
M. Sun, and
H. Corke,
“Antioxidant activity and phenolic compounds of 112 traditional Chinese medical plants associated with anticancer,”
Life Sci., 74 2157
–2184
(2004). https://doi.org/10.1016/j.lfs.2003.09.047 0024-3205 Google Scholar
C. Chang,
C. Ashendel,
T. Chan,
R. Geahlen,
J. McLaughlin, and
D. Waters,
“Oncogene signal transduction inhibitors from chinese medical plants,”
Pure Appl. Chem., 71
(6), 1101
–1104
(1999). https://doi.org/10.1351/pac199971061101 0033-4545 Google Scholar
Y. Su,
H. Chang,
S. Shyue, and
S. Hsu,
“Emodin induces apoptosis in human lung adenocarcinoma cells through a reactive oxygene species-dependent mitochondrial signaling pathway,”
Biochem. Pharmacol., 70 229
–241
(2005). https://doi.org/10.1016/j.bcp.2005.04.026 0006-2952 Google Scholar
Y. Yan,
X. Su,
Y. Liang,
J. Zhang,
C. Shi,
Y. Lu,
L. Gu, and
L. Fu,
“Emodin azide methyl anthraquinone derivate triggers mitochondrial-dependent cell apoptosis involving in caspase-8-mediateed bid cleavage,”
Molec. Cancer Ther., 7
(6), 1688
–1697
(2008). https://doi.org/10.1158/1535-7163.MCT-07-2362 Google Scholar
Q. Huang,
H. Shen,
G. Shui,
M. Wenk, and
C. Ong,
“Emodin inhibits tumor cell adhesion through disruption of the membrane lipid raft-associated integrin signaling pathway,”
Cancer Res., 66
(11), 5807
–5815
(2006). https://doi.org/10.1158/0008-5472.CAN-06-0077 0008-5472 Google Scholar
D. Wlodkowic,
J. Skommer,
S. Faley,
Z. Darzynkiewicz, and
J. M. Cooper,
“Dynamic analysis of apoptosis using cyanine SYTO probes: from classical to microfluidic cytometry,”
Exp. Cell Res., 315 1706
–1714
(2009). https://doi.org/10.1016/j.yexcr.2009.03.006 0014-4827 Google Scholar
T. Endo,
S. Yamamura,
N. Nagatani,
Y. Morita,
Y. Takamura, and
E. Tamiya,
“Localized surface plasmon resonance based optical biosensor using surface modified nanoparticle layer for label-free monitoring of antigen-antibody reaction,”
Sci. Technol. Adv. Mater., 6 491
–500
(2005). https://doi.org/10.1016/j.stam.2005.03.019 1468-6996 Google Scholar
S. Balint,
M. P. Kreuzer,
S. Rao,
G. Badenes,
P. Miskovsky, and
D. Petrov,
“Simple route for preparing optically trappable probes for surface-enhanced Raman scattering,”
J. Phys. Chem. C, 113
(41), 17724
–17729
(2009). https://doi.org/10.1021/jp906318n 1932-7447 Google Scholar
I. Mikhailyuk and
A. Razzhivin,
“Background subtraction in experimental data arrays illustrated by the example of Raman spectra and fluorescent gel electrophoresis patterns,”
Instrum. Exp. Tech., 46
(6), 765
–769
(2003). https://doi.org/10.1023/B:INET.0000008930.87741.b9 0020-4412 Google Scholar
S. Sanchez-Cortes,
D. Jancura,
P. Miskovsky, and
A. Bertoluzza,
“Near infrared surface-enhanced Raman spectroscopic study of antiretroviraly drugs hypericin and emodin in aqueous silver colloids,”
Spectrochim. Acta, Part A, 53 769
–779
(1997). https://doi.org/10.1016/S1386-1425(96)01862-8 0584-8539 Google Scholar
E. D. Korn and
R. A. Weisman,
“Phagocytosis of latex beads by acanthamoeba,”
J. Cell Biol., 34 219
–227
(1967). https://doi.org/10.1083/jcb.34.1.219 0021-9525 Google Scholar
G. J. Pinero and
R. R. White,
“Phagocytosis of latex beads by a human gingival epithelial-like cell line in tissue culture,”
J. Dent. Res., 56 1119
–1126
(1977). 0022-0345 Google Scholar
J. Giorgione and
M. Clarke,
“Heterogeneous modes of uptake for latex beads revealed through live cell imaging of phagocytes expressing a probe for phosphatidylinositol-(3,4,5)-trisphosphate and phosphatidylinositol-(3,4)-bisphosphate,”
Cell Motil., 65 721
–733
(2008). https://doi.org/10.1002/cm.20293 0271-6585 Google Scholar
D. Jancura,
S. Sanchez-Cortes,
E. Kocisova,
A. Tinti,
P. Miskovsky, and
A. Bertoluzza,
“Surface-enhanced resonance Raman spectroscopy of hypericin and emodin on silver colloids: SERRS and NIR FT SERS study,”
Biospectroscopy, 1
(4), 265
–273
(1995). https://doi.org/10.1002/bspy.350010405 1075-4261 Google Scholar
P. Sevilla,
F. Garcia-Blanco,
J. V. Garcia-Ramos, and
S. Sanchez-Cortes,
“Aggregation of antitumoral drug emodin on Ag nanoparticles: SEF, SERS and fluorescence lifetime experiments,”
Phys. Chem. Chem. Phys., 11
(37), 8342
–8348
(2009). https://doi.org/10.1039/b903935j 1463-9076 Google Scholar
S. Kascakova,
Z. Nadova,
A. Mateasik,
J. Mikes,
V. Huntosova,
M. Refregiers,
F. Sureau,
J.-C. Maurizot,
P. Miskovsky, and
D. Jancura,
“High level of low-density lipoprotein receptors enhance hypericin uptake by U-87 MG cells in the presence of LDL,”
Photochem. Photobiol., 84 120
–127
(2008). 0031-8655 Google Scholar
Z. Teng,
S. Zhou,
Y. Ran,
X. Liu,
R. Yang,
X. Yang,
Ch. Yuan, and
Q. Mei,
“Cellular absorption of anthraquinones emodin and chrysophanol in human intestinal caco-2 cells,”
Biosci., Biotechnol., Biochem., 71
(7), 1636
–1643
(2007). https://doi.org/10.1271/bbb.70025 0916-8451 Google Scholar
|


