|
|
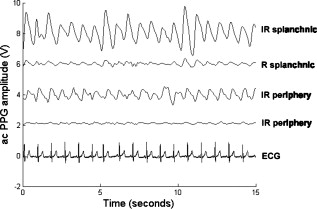
1.IntroductionMonitoring of splanchnic blood oxygen saturation is of paramount importance in anaesthesia, intensive care, and surgery.1 It is essential that the organs and tissues of the splanchnic region are sufficiently perfused with oxygenated blood to survive. When an organ or tissue suffers severe hypoperfusion or extreme hypoxia, organ dysfunction ensues. The failure of one organ can result in the failure of distant organs through the release of toxins and other mediators into the portal blood stream, resulting in multiple organ failure. Despite advances in intensive care management, multiple organ failure remains a common cause of death and morbidity following major surgery.2 Previous studies have indicated that monitoring of the gastrointestinal tract may make early detection of malperfusion feasible.3 Currently, there is no widely accepted and readily available monitoring technique for assessing splanchnic perfusion in the clinical environment.1 Techniques such as polarographic oxygen electrodes, positron emission tomography (PET), and magnetic resonance imaging (MRI) are confined for use as research tools.4 Doppler ultrasound and laser Doppler measure blood flow and not oxygenation, and are also heavily operator-dependent techniques,5, 6 while fluorescein only allows for intermittent assessment.2 Gastric tonometry is one of the few organ-specific monitors approved for clinical use.7 However, due to its operator dependency, expense, and time-consuming nature, it has still not been widely accepted for routine use.8, 9 Reflectance spectrophotometry has been found to be a powerful tool in the assessment of gastric mucosal oxygenation in both animals10 and patients.11 However, clinical experience with this device is limited. Problems related to its use include possible interference with other pigments (e.g., bilirubin), movement artifacts, and difficulties in handling the device.12 Furthermore, it has been noted that the cost of the spectrophotometry systems is too expensive.11 Pulse oximetry has also been used experimentally in the detection of intestinal oxygenation in animals, where it was found to be a rapid, reproducible, as well as a highly sensitive and specific technique for detecting small bowel ischaemia.13, 14 The feasibility of estimating splanchnic blood oxygen saturation in humans has been demonstrated by Ouriel, Fiore, and Geary in a study using a commercial transmission pulse oximeter on the intestine after abdominal aneurysm surgery in 30 patients.15 They found that a loss of pulsatility and unmeasurable suggests inadequate intestinal perfusion. During a second-look laparotomy on a -old girl, Hei and Shun utilized a commercial pulse oximeter probe (Nellcor Oxisensor, Boulder, Colorado) to determine ischaemic intestinal segments.16 Segments with low blood oxygen saturation values were excised. Despite the attractiveness of this technique in estimating blood oxygen saturation of abdominal organs, current pulse oximetry sensors are not suitable for use in such anatomical areas, as current commercial sensors in their majority are bulky, cannot be sterilized, and may compress the splanchnic tissue (assuming clip-on sensors). More recently, the feasibility for acquiring good quality photoplethysmographic (PPG) signals in human abdominal organs, such as the bowel, liver, and kidney during labarotomy, has been demonstrated by a preliminary study using a custom-made reflectance optoelectronic pulse oximetry sensor.1 However, this sensor was not suitable for prolonged continuous monitoring in the abdomen, as it had to be held continuously by the user while investigating a particular organ. Also, the custom-made optoelectronic sensor was only applicable during open laparotomy, where all the organs of interest were exposed. Therefore, there remains a need for a new pulse oximetry sensor that is suitable for use in the human abdomen both operatively and postoperatively. In an attempt to achieve this, the design of a new fiber optic sensor is suggested. The proposal of the clinical experts is to use the small fiber optic sensor (which is electrically isolated and sterilizable using medically approved fibers) and secure it (stitch it) in the organ of interest before the completion of the surgery. The body of the probe will be inserted in a commercial surgical drain tube (i.e., such as French 16) that will be passed outside the abdominal wall where the probe will be connected to the processing system. Once the surgeons are satisfied with the monitoring, they will pull the probe out as they do with all other drainage tubes after operations. Also, the fiber optic probe will also be used for the monitoring of perfusion in the stomach wall and jejunum. For such application, the probe will be inserted orally/nasally with the guidance of an endoscope. As a preliminary to developing such a sensor, this study describes the design, technical development, and validation of a new fiber optic reflectance PPG sensor and processing system. Preliminary PPG measurements from human abdominal organs are also presented. 2.BackgroundPulse oximetry is a noninvasive optical technique that estimates arterial blood oxygen saturation by shining light at two different wavelengths [red (R) and infrared (IR)] through vascular tissue and measuring either the transmitted (transmission pulse oximetry) or reflected (reflectance pulse oximetry) light signal. Both wavelengths are multiplexed, so they are never on at the same time. A demultiplexer is used to separate the mixed (red and infrared) PPG signals before further processing. In this method, the ac pulsatile PPG signal associated with cardiac contraction is assumed to be attributable solely to the arterial blood component. The amplitudes of the red and infrared ac PPG signals are sensitive to changes in arterial oxygen saturation because of differences in the light absorption of oxygenated and deoxygenated hemoglobin at these two wavelengths.17 From the ratios of these amplitudes [Eq. 1] and the corresponding dc PPG components, arterial blood oxygen saturation is estimated. where and are the red and infrared ac components, respectively, and and are the red and infrared dc components, respectively.Commercial pulse oximeters are empirically calibrated from in-vivo data, resulting in look-up tables or equations that are used to find the relationship between the pulse oximeter ratio value and the actual arterial oxygen saturation (using a CO-oximeter). Equation 2 shows a typical linear equation. Hence, the technique of pulse oximetry relies on the presence of adequate peripheral arterial pulsations, which are detected as PPG signals.173.MethodsA new reflectance PPG sensor was developed, comprised of optical fibers coupled to infrared and red subminiature version A (SMA)-mounted emitters and a photodiode. A PPG processing system was also developed for the detection and preprocessing of the red and infrared ac and dc PPG signals before digitization by a data acquisition card. The digitized PPG signals were further processed, analysed, and displayed by a virtual instrument (VI) implemented in LabView (National Instruments, Austin, Texas). The technical details of each stage are described next. 3.1.Fiber Optic Photoplethysmographic SensorFiber optic cables were chosen as a means of transmitting and receiving the light, as they are electrically safe and their dimension (cross sectional area) can be quite small to ultimately facilitate insertion of the sensor into a small cavity. Glass silica step index multimode fibers with a numerical aperture (NA) of 0.37 and a core diameter of were deemed sufficient for the initial sensor. Each fiber cable was SMA terminated at one end. Bare fiber was exposed at the other end, where it was cleaved and polished to attain a flat surface at to the emitting light. These fibers are made from biocompatible materials, are radiation resistant, and are sterilizable by ethylene oxide (EtO) and other methods. To facilitate the multiplexing of the red and infrared signals into a single fiber, a bifurcated fiber (or Y-piece) from Ocean Optics (Ocean Optics, Duiven, The Netherlands) was used (Fig. 1 ). The two ends of the Y-piece were coupled to the SMA-mounted emitters (with peak emission wavelengths of 650 and , respectively), while the other end was attached to a prepared single fiber optic cable (core diameter of ) to transmit both the red and infrared light to the tissue. Another single fiber optic cable (core diameter of ) was used to transmit the backscattered light from the tissue to the photodiode ( active area). Fig. 1Reflectance configuration of the fiber optic reflectance PPG sensor, including desired sensor dimensions.  To compare the PPG signals acquired from abdominal organs when using the fiber optic sensor, an identical (with the same optical and electrical characteristics) peripheral fiber optic PPG sensor has also been developed. Figure 2 shows both the splanchnic and peripheral sensors. 3.2.Photoplethysmographic Processing and Acquisition SystemAn electrically isolated PPG processing and acquisition system was developed to drive the optical components of the splanchnic and peripheral fiber sensors, and to detect and preprocess the ac and dc red and infrared PPG signals. A virtual instrument (VI) was also developed in LabView, which was used to drive some of the hardware components of the processing system, and enable the acquisition, displaying, storing, and analyzing of all acquired PPG signals. A block diagram of the processing system is shown in Fig. 3 . Fig. 3Block diagram illustrating the various stages of the PPG processing system (an identical processing system was also developed for the peripheral fiber optic sensor).  The emitter driver was controlled and driven by the R and IR multiplexing signals. These signals were used to time multiplex the red and infrared emitters at (each emitter is switched on every for an interval of ). The output current of the emitter driver was controlled by an analog voltage (current control voltage). All three signals were generated by the virtual instrument via the output ports of the DAQ card (DAQPad-6015, National Instruments, Austin, Texas). The photodetector detects the energy backscattered by the tissue and gives an output current proportional to the detected light intensity. The output of the current-to-voltage (I-V) differential amplifier contains multiplexed PPG signals corresponding to red and infrared wavelengths. The signal from the current-to-voltage differential amplifier passes to a demultiplexer synchronized to the multiplexing signals from the VI, which separates the red and infrared signals. The two signals (R and IR) after passing through an isolation barrier are filtered to extract the ac and dc PPG components for each wavelength. The output PPG signals are digitized and further analyzed by the virtual instrument. PPG traces corresponding to infrared and red wavelengths are obtained simultaneously and displayed on the personal computer screen. All acquired signals are also saved in spreadsheet format for further postprocessing and analysis. 4.ExperimentsPrior to the finalization of the sensor, it was necessary to determine the optimum separation distance between the emitting and receiving fibers. It is well known that the distance between the emitters and the photodetector in a reflectance pulse oximeter sensor has a direct impact on the quality of the PPG signals acquired,18 and hence the accurate estimation of . Therefore, an investigation was conducted to examine the effect of the source detector separation between the fibers on the PPG (ac and dc) signals and to ultimately establish the optimum separation distance between the light emitting and receiving fiber. Also, in-vivo temperature tests were conducted to confirm that temperature rises at the tip of the fiber optic sensor (contact point with vascular tissue) would not be of clinical significance. 4.1.Fiber-Spacing ExperimentTo conduct this experiment, a precision-drilled perspex finger piece was designed to allow the investigation of PPG signals at separation distances of between the detecting and transmitting fibers. The separation space between the holes was insulated by a black rubbery material to eliminate any light entering the photodiode from the surface of the finger (penumbra effect). During the experiment, ac and dc PPG signals obtained from the index fingers of four healthy volunteers with blood oxygen saturation values in the range of 98 to 100% (measured with a commercial pulse oximeter), at both wavelengths, were recorded simultaneously while varying the separation between the emitting and detecting fibers at increments. Any overhead fluorescent lights were switched off to eliminate any other light interference with the fiber optic sensor. To determine the quality of the signals obtained for each separation distance, a quantitative measure of SNR was desirable. The SNR was calculated using measurements of pulse power against background noise in the frequency domain. 4.2.Fiber Optic Sensor Temperature TestThe operating current of the emitters is relatively low, and the use of fiber optics ensures that the emitters are not in direct contact with the tissue. However, it was still necessary to confirm that the red and infrared sources would not cause any direct thermal damage to the splanchnic tissue. An in-vivo temperature test was conducted to investigate the possibility of excessive temperature rises in the splanchnic area during PPG measurements. The in-vivo test was made on a normal healthy volunteer. The emitting fiber was placed in contact with the mucosa of the cheek inside the mouth. A type-K thermocouple was attached adjacent to the fiber tip, and was also in contact with the mucosa of the mouth. The temperature was recorded until a constant baseline was attained. The infrared light emitter was switched on and the temperature was monitored. Steady-state conditions were achieved after approximately , and monitoring was continued for an additional . The measurement was repeated for a red emitter. 4.3.Preliminary Clinical MeasurementsPrior to engaging in a detailed clinical study, a preliminary (proof of concept) study was performed to evaluate the ability of the sensor to obtain PPG signals from various abdominal organs. Ethics committee approval was obtained to perform PPG measurements on six adults undergoing elective laparotomy. Prior to any PPG measurements, the fiber optic sensor was inserted into a sealed, sterile, transparent ultrasound probe cover (latex-free material). At an appropriate time during the surgery, the sensor was passed to the surgeon and it was applied gently to the surface of each available abdominal organ so that the emitted light was reflected from its surfaces. During the measurements, the overhead operating lights were turned off to ensure no interference with the PPG sensor. Simultaneous ac and dc fiber optic PPG traces from each abdominal organ and the finger were recorded for approximately two minutes. Blood oxygen saturation from a commercial pulse oximeter (transmission mode finger probe, GE Healthcare, Piscataway, New Jersey) was also simultaneously monitored and recorded. 5.Results5.1.Results from the Fiber-Spacing ExperimentPPG signals were recorded from all volunteers at both wavelengths and at all separation distances between the transmitting and receiving fibers. Figure 4 depicts typical finger infrared ac PPG traces from a volunteer at various separation distances between the emitting and the receiving fiber. Fig. 4Typical infrared ac PPG traces from the finger of a healthy volunteer at various fiber separation distances between the emitting and receiving fiber.  Although PPG traces were detected at almost all separation distances, there were differences in signal amplitude and morphology at the various monitoring separations. PPG signals obtained at a separation of were of large amplitude; however, PPG signals at this separation distance were often erratic and unstable. The range of produced good quality, stable PPGs with large amplitudes. Over separation distance, the resulted ac PPGs were of poor quality and very low amplitude. For each separation distance, mean ac and dc amplitudes were calculated for the red and infrared signals by averaging the PPG amplitudes over one minute of data. Figures 5 and 6 show the means of the red and infrared ac PPG and dc PPG signals, respectively, from all four volunteers. Again, it can be seen that the mean ac and dc PPG amplitudes decrease as the separation distance increases. Fig. 5Mean of the infrared (IR) and red (R) ac PPG amplitudes and standard deviations for all separation distances.  Fig. 6Mean of the infrared (IR) and red (R) dc PPG amplitudes and standard deviations for all separation distances. 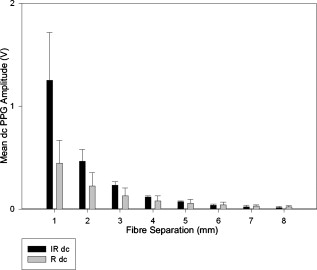 For each separation distance, the mean was calculated [Eq. 1]. This value was then used in Eq. 2 for the estimation of . Figure 7 shows both and the corresponding value for all the separation distances. The SNR of the red and infrared PPGs at all fiber separation distances were also calculated as described in Sec. 4.1. Figure 8 shows the mean SNR values for the red and infrared PPG signals. 5.2.Results from the Fiber Optic Sensor Temperature TestThe temperature of the mucosa was at prior to switching on the red or infrared emitter. After turning on the infrared emitter and waiting for steady-state conditions, it was found that the temperature of the mucosa remained at , and was constant for the remainder of the monitoring period. The same results were observed for the red emitter. 5.3.Results from the Preliminary Clinical MeasurementGood quality, easily recognizable PPG signals with large amplitudes were recorded on all attempts from various abdominal sites—small bowel , large bowel , liver , and stomach . Figures 9, 10, 11, 12 depict typical ac red and infrared PPG signals from all investigated abdominal organs. The amplitudes of the normalized ac splanchnic PPG signals were analyzed with those obtained from the peripheral site (Fig. 13 ). Although this is an uncalibrated system, preliminary values were estimated using Eq. 2. This was to evaluate if the fiber optic sensor and processing system may be capable of providing a reliable means of estimating blood oxygen saturation. The ANOVA test showed that there were no statistically significant differences between the from the abdominal organs and those from the finger (Fig. 14 ). 6.ConclusionA fiber optic reflectance splanchnic PPG sensor and PPG processing and acquisition system are developed and evaluated successfully. The results of the emitter-detector separation experiment show a trend of decreasing ac and dc PPG amplitudes with increasing separation distance. Such a phenomenon is well explained, as the transfer of photons to the emitter via the tissue bed decreases as the distance between the emitting source and the receiving source increases. PPG signals acquired at distance between the transmitting and receiving fibers were found to be unsuitable, as the resulted PPG signals were noisy, erratic, and of extremely large amplitudes. This was possibly due to the photodetector running close to saturation. Also, the relative positions of the transmitting and receiving fibers may affect the distribution of path lengths that photons travel before being captured by the detector.19 As the arterioles and capillaries in the finger do not extend up to the skin surface, at a separation of , it is possible that the photons reaching the detector have passed through a various number of paths—some deeper through pulsatile tissue—while other photons merely probe the surface of the finger. This variable difference in photon path length and the large variation in photon arrival time may explain the erratic signals obtained at this separation distance. Furthermore, such separation distance will ultimately result in the erroneous estimation of blood oxygen saturation, as is shown in Fig. 7. At separation, the ac PPG signals were of better quality than the separation. However, the dc PPGs at this separation distance suggested again that the photodetector could be running close to saturation, or there is a large variation in mean photon, and hence is producing an erroneous calculation of (Fig. 7). Both ac and dc PPG signals at fiber separation distances between 3 and were of good quality with large ac amplitudes and dc values. Such signals will be most suited for the accurate estimation of blood oxygen saturation. Indeed, it has been reported that acquired PPG signals become progressively more stable as the LED/photodetector separation is increased,18 possibly due to less variation in mean path length. PPG signals acquired at separation distances above produced weak signals of low amplitude. These signals will be unreliable in the estimation of blood oxygen saturation, and therefore, such distances between transmitting and receiving fibers should be avoided. More importantly, analysis of the mean value shows that separation distances of 3 and produce values nearing 100% oxygen saturation. For separation distances of and over , the values were below or above the normal expected range. As expected, SNR shows a decrease for higher separation distances , as power (amplitude) of the signal decreases and becomes closer to the baseline noise. However, even though the PPG traces at 1 and are of high amplitudes (Fig. 4), they show low SNR values in comparison to those obtained at separations of 3 and . It was observed that the baseline noise had a greater power at separation distances of 1 and . This is possibly due to increased shot noise because of the high photodiode current caused by the higher intensity of light reaching the diode, and also due to the more erratic nature of the signals. Separation distances of 3 and produce signals with the highest SNR, and hence the best quality signals. Furthermore, these separation distances have produced the most realistic values, as observed in Fig. 7. It is concluded that, in the given system, any changes or either side of these measurements will affect the signal quality (SNR), and hence, the accuracy of the measurement. The results of the in-vivo temperature test showed that the red and infrared emitters had no thermal effect on the mucosa of the mouth. It can be assumed that the sensor will not cause any thermal damage to the tissue of the splanchnic region. The results from the emitter-detector separation experiment led to the finalization and fabrication of the fiber optic sensor prior to clinical trials. Abdominal organ PPG signals have been obtained with large amplitudes on all attempts from the small bowel, large bowel, liver, and stomach. The low frequency artifact present on the splanchnic PPG traces was due to the mechanical ventilator and movement of the hand-held sensor. The ac PPG signals from the splanchnic sites were of larger amplitudes than those obtained from the periphery. These larger amplitudes are possibly due to an underlying difference in vasculature between peripheral and splanchnic tissue. It is likely that arteries lying closer to the surface of the splanchnic organs have resulted in a larger pulsatile component. However, when the ac component is divided by the dc component, the normalized amplitudes of the splanchnic PPG signals show reasonable agreement with those obtained from the periphery using an identical fiber optic sensor (Fig. 13). Preliminary estimates of splanchnic from the uncalibrated system show good agreement with commercial values from the finger. These results are encouraging and indicate the feasibility of measuring splanchnic organ saturation using a reflectance fiber optic PPG sensor. Further work needs to be carried out to validate this hypothesis. Clinical studies are currently being extended to provide a complete evaluation of the system prior to further miniaturization of the splanchnic sensor. Such a sensor miniaturized fiber optic sensor may facilitate postoperative monitoring of splanchnic oxygen saturation of the stomach or bowel. Future work may also include the use of animal models to validate this hypothesis, before considering calibration using CO-oximetry. AcknowledgmentsThis work was supported in full by the Engineering and Physical Sciences Research Council (EPSRC). ReferencesA. J. Crerar-Gilbert,
P. A. Kyriacou,
D. P. Jones, and
R. M. Langford,
“Assessment of photoplethysmographic signals for the determination of splanchnic oxygen saturation in humans,”
Anaesthesia, 57 442
–445
(2002). https://doi.org/10.1046/j.0003-2409.2001.02453.x 0003-2409 Google Scholar
Jury of the Consensus,
“Tissue hypoxia: how to detect, how to correct, how to prevent?,”
Intensive Care Med., 22 1250
–1257
(1996). 0342-4642 Google Scholar
D. R. Dantzker,
“The gastrointestinal tract. The canary of the body?,”
J. Am. Med. Assoc., 270
(10), 1247
–1248
(1993). https://doi.org/10.1001/jama.270.10.1247 0098-7484 Google Scholar
D. Rittoo,
P. Gosling,
C. Bonnici,
S. Burnley,
P. Millns,
M. H. Simms,
S. R. G. Smith, and
R. K. Vohra,
“Splanchnic oxygenation in patients undergoing abdominal aortic aneurysm repair and volume expansion with eloHAES,”
Cardiovasc. Surg., 10 128
–133
(2002). https://doi.org/10.1016/S0967-2109(01)00132-6 0967-2109 Google Scholar
J. J. Ferrara,
D. L. Dyess,
M. Lasecki,
S. Kinsey,
C. Donnell, and
G. Jurkovich,
“Surface oximetry. A new method to evaluate intestinal perfusion,”
Am. Surg., 54 10
–14
(1998). 0003-1348 Google Scholar
D. Lynn Dyess,
B. W. Bruner,
C. A. Donnell,
J. J. Ferrara, and
R. W. Powell,
“Intraoperative evaluation of intestinal ischemia: a comparison of methods,”
South Med. J., 84
(8), 966
–970
(1991). 0038-4348 Google Scholar
P. J. Kinnala,
K. T. Kuttila,
J. M. Gronroos,
T. V. Havia,
T. J. Nevalainen, and
J. H. A. Niinikoski,
“Splanchnic and pancreatic tissue perfusion in experimental acute pancreatitis,”
Scand. J. Gastroenterol., 7 845
–849
(2002). 0036-5521 Google Scholar
J. J. Kolkman,
J. A. Otte, and
A. B. Groeneveld,
“Gastrointestinal luminal PCO2 tonometry: an update on physiology, methodology and clinical applications,”
Br. J. Anaesth., 84
(1), 74
–86
(2000). 0007-0912 Google Scholar
M. Haterhill,
S. M. Tibby,
R. Evan, and
I. A. Murdoch,
“Gastric tonometry in septic shock,”
Arch. Dis. Child, 78 155
–158
(1998). https://doi.org/10.1136/adc.78.2.155 0003-9888 Google Scholar
U. Matern,
J. Haberstroh,
A. el Saman,
E. Pauly,
R. Salm, and
E. H. Farthmann,
“Emergency laparoscopy. technical support for the laparoscopic diagnosis of intestinal ischemia,”
Surg. Endosc, 10 883
–887
(1996). https://doi.org/10.1007/BF00188475 0930-2794 Google Scholar
A. Fournell,
L. A. Schwarte,
T. W. L. Scheeren,
D. Kindgen-Milles,
P. Feindt, and
S. A. Loer,
“Clinical evaluation of reflectance spectrophotometry for the measurement of gastric microvascular oxygen saturation in patients undergoing cardiopulmonary bypass,”
J. Cardiothorac Vasc. Anesth., 16 576
–581
(2002). https://doi.org/10.1053/jcan.2002.126951 1053-0770 Google Scholar
S. M. Jakob and
J. Takala,
“Ards. monitoring tissue perfusion,”
Crit. Care Clin., 18 143
–163
(2002). https://doi.org/10.1016/S0749-0704(03)00070-8 0749-0704 Google Scholar
J. DeNobile,
P. Guzzetta, and
K. Patterson,
“Pulse Oximetry as a means of assessing bowel viability,”
J. Surg. Res., 48 21
–23
(1990). https://doi.org/10.1016/0022-4804(90)90139-S 0022-4804 Google Scholar
P. H. MacDonald,
P. K. Dinda,
I. T. Beck, and
C. D. Mercer,
“The use of oximetry in determining intestinal blood flow,”
Surg. Gynecol. Obstet., 176 451
–458
(1993). 0039-6087 Google Scholar
K. Ouriel,
W. M. Fiore, and
J. E. Geary,
“Detection of occult colonic ischemia during aortic procedures: use of an intraoperative photoplethysmographic technique,”
J. Vasc. Surg., 7 5
–9
(1988). https://doi.org/10.1067/mva.1988.avs0070005 0741-5214 Google Scholar
E. R. L. Hei and
A. Shun,
“Intra-operative pulse oximetry can help determine intestinal viability,”
Pediatr. Surg. Int., 17 120
–121
(2001). https://doi.org/10.1007/s003830000484 0179-0358 Google Scholar
J. G. Webster, Design of Pulse Oximeters, Institute of Physics Publishing, Bristol, UK
(2003). Google Scholar
Y. Mendelson and
B. D. Ochs,
“Noninvasive pulse oximetry utilising skin reflectance photoplethysmography,”
IEEE Trans. Biomed. Eng., 35 798
–805
(1998). https://doi.org/10.1109/10.7286 0018-9294 Google Scholar
J. M. Schmitt,
“Simple photon diffusion analysis of the effects of multiple scattering on pulse oximetry,”
IEEE Trans. Biomed. Eng., 98 1194
–1203
(1991). https://doi.org/10.1109/10.137285 0018-9294 Google Scholar
|