
|
|
|
Cells exposed to laser pulses longer than the thermal diffusion rate can experience damage by either photothermal or photochemical mechanisms, depending on wavelength, exposure duration, and beam diameter. In addition, laser irradiance (E) dictates the degree of chromophore-dependent heating in tissues. In general, the irradiance requirement for damage is reduced as exposure duration is extended. This trend explains why wavelength-dependent nonthermal damage only predominates for long laser exposures, and how thermal damage can be forced to occur from relatively short exposures. Radiant exposure (H) is used to correlate laser dose to damage outcomes, and is calculated by multiplying irradiance by exposure duration. In animals, where measurements of temperature rise and oxidative products are difficult, researchers have relied on evaluations of trends in damage thresholds relative to wavelength (action spectrum) and exposure duration [temporal action profile (TAP)]1 to distinguish a damage mechanism. The principal of irradiance reciprocity, where threshold irradiance is inversely proportional to exposure duration, is a prominent feature of photochemical (nonthermal) damage, and is easily identified in TAP analyses using threshold irradiance (ETAP) or threshold radiant exposure (HTAP). Ocular lesions assessed at post exposure (or longer) for exposures of (or longer) at (or shorter) were considered photochemical.1, 2 When lesions from exposures were assessed at , damage from a exposure was consistent (HTAP) with photothermal processes.2 Therefore, this “latency” in the appearance of damage is also useful in characterizing laser damage mechanisms. While characterizing a novel in-vitro retinal model,3 we made note of a peculiar trend for damage thresholds at that compared with in-vivo thresholds at 457.9 and reported by Lund, Stuck, and Edsall.4 An HTAP analysis of the data revealed thresholds that continued along the thermal trend line to threshold radiant exposure values greater than that for , which was expected to be at irradiance reciprocity. Figure 1 is an HTAP for the ( beam diameter) data taken from Ref. 4. Without the usual log-log axis, the HTAP clearly shows that the post exposure threshold values for the 5-, 8-, and exposures are greater than that of the photochemical threshold . As the authors concluded,4 a lack of latent lesions following laser exposures of and shorter indicated damage by thermal mechanisms. However, the fact that threshold values for the exposures did not decrease to the level of the threshold implied the possibility of mixed damage mechanisms in the progression to purely photochemical processes. The authors discussed how the threshold data suggested a gradual transition between mechanisms due to a delayed appearance of threshold lesions (indicating nonthermal damage) and a dependence on the diameter of the irradiated retinal area (indicating thermal damage). Fig. 1Comparison of in-vivo and in-vitro damage trends. (a) HTAP for 1- and damage thresholds in the in-vivo MVL study of Ref. 4. The data point is expected to represent irradiance reciprocity. (b) HTAP for damage thresholds in the in-vitro retinal model. Estimated thresholds using the BTEC thermal model are represented by the dashed line. Error bars depict upper and lower fiducial limits (95 % confidence intervals).  In this study, we use a combination of new in-vitro damage data and computational simulations of both temperature rise and damage thresholds at to address the shift to photochemical damage processes in more detail. Except for the following changes, laser exposures were as described previously.3 Retinal pigment epithelial (RPE) cells (about 160 melanosomes/cell) were exposed to laser irradiation in 48-well plates containing complete Hank’s balanced salt solution. Cells were exposed to a -diam flat-top beam (via an focal length lens) in an environmentally controlled enclosure (Fig. 2 ) that ensured consistent temperature and relative humidity (60 to 70%). Estimated dose for 50% lethality values were calculated using the Probit method,5, 6 where Probit slopes represent the first derivative with respect to dose at a probability of 0.5. Systematic uncertainty (15%) in our irradiance values was calculated as previously described.7 Fig. 2Schematic representation of beam delivery for in-vitro laser exposures. M, mirror; , half-wave plate; Pol, polarizing beamsplitter; T, optical telescope; BSh, beam shaper; BS, beamsplitter; S, shutter; L, lens; ND, neutral density filter; CCD, charge-coupled device camera; and Obj, microscope objective. 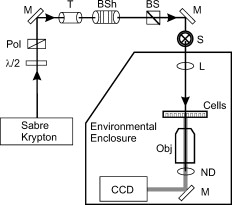 To simulate the experimental exposures, we used a laser-tissue damage program developed by our group.8 The model uses a laser propagation model (geometric optics assumed) to compute a source term (implementing Beer’s law of linear absorption) for a thermal heat solver. The heat solver accounts for the multiple layers comprising the system (buffer, cells, and plastic well plate) and air/surface boundary conditions to predict temperature rise at the -thick cell layer. These temperatures were input into an Arrhenius rate equation that was numerically integrated to determine damage outcomes. The two Arrhenius rate parameters ( ; ) used in the damage integral calculation were those reported by Welch and Polhamus.9 A numerical search algorithm was used to determine the threshold irradiance that solved for an value of 1 at the center of the beam. The 1-h irradiances for the current in-vitro exposures are given in Table 1 . Consistent environmental conditions during exposures led to low variance (fiducial limits) about the threshold values. Notice that, as expected, the irradiance requirement for damage was reduced by extending the duration of the laser exposure, although there was no significant change between the 40- and thresholds. Table 1 also shows that the threshold value for the exposure was exactly half the threshold, defining irradiance reciprocity (nonthermal damage) for the beam at in the in-vitro retinal system. Table 11-h damage threshold irradiance values for 413-nm laser exposures of in in-vitro retinal model. FL are Fiducial limits (95% confidence interval). Systematic uncertainty was determined to be 15%.
An HTAP analysis of the in-vitro results [Fig. 1] shows a trend similar to the assessments of Ref. 4 at [Fig. 1]. Power functions describing the in-vitro and in-vivo data had nearly identical exponents (0.76 and 0.78, respectively), but the in-vivo curve was shifted to lower threshold values by a factor of about 6.5, presumably due to differences in melanosome density as discussed previously.3 Although difficult to see in Fig. 1, the threshold data points for the 0.1- and exposures are near the origin. Notice the inverse relationship between irradiance and radiant exposure, such that the exposure required the greatest irradiance (Table 1) and the least radiant exposure [Fig. 1] for generating threshold damage. However, as seen in Fig. 1, this trend is dramatically broken when the damage mechanism shifted to nonthermal, as indicated by irradiance reciprocity. This necessarily means that there was a significant thermal component in the death process for exposures of . The correlation coefficient for the power function describing the data [see Fig. 1] would suggest a similar degree of thermal component over this entire range of exposure durations. As a means of understanding the thermal component of the in-vitro damage thresholds, we simulated irradiance threshold values ( ) for exposure durations of and plotted the radiant exposure results alongside the in-vitro data [Fig. 1]. The simulated curve fits fairly well with the in-vitro data, falling within the 95% confidence intervals for all but the data point. The deviation in simulated and in-vitro HTAP curves suggests that mixed damage mechanisms may exist for exposures of . However, we understand that our choice in values for the Arrhenius rate parameters, the fact that one of these parameters (frequency factor ) has a slight dependence on temperature, and our 15% systematic uncertainty (Table 1), are all factors that could lead to the observed disparity. Looking at the irradiance thresholds in Table 1, we see no difference between the 40- and exposures, which means the continuation of radiant exposure thresholds along the power curve in the HTAP is directly proportional to the increase in exposure duration. However, this is not necessarily unexpected, because threshold irradiance (and temperature) is proportional to the inverse of log time under the Arrhenius damage model, which predicts a convergence of threshold irradiances (and temperatures) at longer exposure durations. A similar scenario appears to play out in the rhesus eye. The tabulated retinal threshold irradiance values for the exposures reported in Ref. 4 were all three statistically identical as well. Previous authors have used a peak temperature rise of to signify a minimum requirement for damage by thermal means.10 As expected, simulated peak temperature rises (Fig. 3 ) for the 100- and in-vitro threshold values were low (3.8 and , respectively). Figure 3 also shows that simulated peak temperature rises of greater than were calculated for the in-vitro irradiance values for exposures of and shorter, which implies that sufficient heat was generated to produce death by thermal mechanisms. When we looked at the individual damage outcome data (damage versus no damage) for the exposures, we found that the lowest irradiance that caused damage corresponded to a (simulated) temperature rise of . Again, this indicated that all the 60-S exposure damage outcomes had sufficient temperature rises to cause damage by thermal means. However, this does not exclude the possibility of nonthermal (photo-oxidation) events occurring concurrently with this elevation of temperature. The lack of an intermediate temperature rise for the 40- and irradiance values, such as , suggests that if concurrent mechanisms did exist, they were neither additive nor synergistic to the overall damage rate process. Fig. 3Simulated (BTEC model) peak temperature rise values for in-vitro irradiance values (circles) as a function of exposure duration. Peak temperatures of irradiances extrapolated in accordance with reciprocity were also simulated and shown. 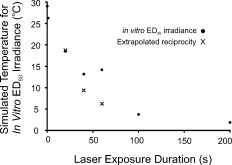 Finally, we were interested in the expected temperature rise of cells receiving the 40- and reciprocity irradiance doses. On extrapolating from the 100- and irradiances, we simulated peak temperatures of 9.4 and for the extrapolated irradiances corresponding to 40- and exposures, respectively. This suggests that if there did exist additive or synergistic effects from thermal and nonthermal damage mechanisms, it would be manifested in the data for exposures. In conclusion, the in-vitro retinal model showed transitions in the damage mechanism for thresholds similar to those found previously in an in-vivo model. In the in-vitro model, the transition from photothermal to nonthermal damage was sudden, occurring somewhere between exposure durations of 60 and . Additional data in this exposure range are being collected to characterize this transition. The current data cannot rule out the possibility of photochemical oxidation occurring during damaging exposures at . We are currently conducting experiments to address this issue. However, we believe that nonthermal processes do not contribute to cell death at postexposure. AcknowledgmentsAny opinions, interpretations, conclusions, and recommendations are not necessarily endorsed by the U.S. Air Force. We thank C. Burney, B. Stuck, T. Khan, and D. Wooddell for helpful discussions regarding the manuscript. We would also like to thank H. Hodnett and D. Stolarski for technical assistance. This work was supported by the Air Force Research Laboratory (contract F41624-02-D-7003) and the Air Force Office of Scientific Research (grant 92HE04COR). ReferencesW. T. Ham Jr., J. J. Ruffolo Jr., H. A. Mueller, and D. Guerry III,
“The nature of retinal radiation damage: Dependence on wavelength, power level and exposure time,”
Vision Res., 20 1105
–1111
(1980). https://doi.org/10.1016/0042-6989(80)90047-4 0042-6989 Google Scholar
W. D. Gibbons and R. G. Allen,
“Retinal damage from long-term exposure to laser radiation,”
Invest. Ophthalmol. Vis. Sci., 16 521
–529
(1977). 0146-0404 Google Scholar
M. L. Denton, M. S. Foltz, K. J. Schuster, G. D. Noojin, L. E. Estlack, and R. J. Thomas, J. Biomed. Opt., 13
(5), 054014
(2008). https://doi.org/10.1117/1.2981831 1083-3668 Google Scholar
D. J. Lund, B. E. Stuck, and P. Edsall,
“Retinal injury threshold for blue wavelength lasers,”
Health Phys., 90
(5), 477
–484
(2006). https://doi.org/10.1097/01.HP.0000190115.83416.cb 0017-9078 Google Scholar
C. P. Cain, G. D. Noojin, and L. Manning,
“A comparison of various probit methods for analyzing yes/no data on a log scale,”
(1996) Google Scholar
D. J. Finney, Probit Analysis, Cambridge University Press, New York
(1971). Google Scholar
B. N. Taylor and C. E. Kuyatt,
“Guidelines for evaluating and expressing the uncertainty of NIST measurement results,”
(1994) Google Scholar
L. Irvin, P. D. S. Maseberg, G. Buffington, C. D. Clark III, R. J. Thomas, M. L. Edwards, and J. Stolarski,
“BTEC thermal model,”
(2008) Google Scholar
A. J. Welch and G. D. Polhamus,
“Measurement and prediction of thermal injury in the retina of Rhesus monkey,”
IEEE Trans. Biomed. Eng., BME-31 633
–644
(1984). https://doi.org/10.1109/TBME.1984.325313 0018-9294 Google Scholar
A. M. Clarke, W. J. Geeraets, and W. T. Ham Jr.,
“An equilibrium thermal model for retinal injury from optical sources,”
Appl. Opt., 8
(5), 1051
–1054
(1969). https://doi.org/10.1364/AO.8.001051 0003-6935 Google Scholar
|
||||||||||||||||||||||||||||||||||||||||||||||||||||


