
|
|
1.IntroductionNew diagnostic methods for detection of early dental caries lesions have emerged during the last decades, each with benefits and limitations.1, 2, 3, 4, 5, 6, 7 One novel and promising method is the use of near-infrared (NIR) wavelengths for transillumination (TI) of dental enamel. The TI method is an imaging technique based on transmission of light through the tooth under inspection and makes it possible to visually discriminate between intact and enamel caries tissue. The image can be captured, saved, and stored in digital format. Early caries imaging with NIR light at has demonstrated considerable potential because enamel tissue is highly transparent in this region of the electromagnetic spectrum.8, 9, 10, 11 The method is nondestructive, nonionizing, and reportedly more sensitive to early demineralization than dental x-rays.8 The use of dental radiography should always be limited, even though it is the most often employed concept of routine examination. In contrast, the TI method offers the advantage of allowing for repeated projection on occlusal and approximal surfaces,9, 10 surfaces where the majority of caries lesion appears.12, 13 Besides, the TI image is presented as a visually recognizable image, which is preferred by the average clinician. Figure 1 illustrates the typical experimental setup of a TI system with a NIR light source, an imaging camera such as a charge-coupled device (CCD), and software for computer-controlled acquisition. Fig. 1Experimental setup of the transillumination system. The enamel in teeth sections of various thicknesses was illuminated with NIR. The transmitted images were captured by a CCD detector.  Optical caries detection methods are based on light that shines on a tooth. They are hindered by absorption, where photons are lost to the material, and scattering, where the direction of photons is changed without loss of energy. Scattering is the dominating process, both in enamel and dentine, and is highly wavelength sensitive, shorter wavelengths scattering more than longer ones. Fried,14 demonstrated that dental enamel is highly transparent when illuminated with NIR light, while dentine scatters strongly in the visible and NIR region. This implies that the TI technique is appropriate to study caries lesions in enamel and less so in dentine. Methods employing wavelengths in the visible range of the electromagnetic spectra , such as laser-induced fluorescence15 and digital imaging fiber-optic transillumination,16 which uses high intensity white light, are limited by strong scattering in sound enamel. The quantitative light-induced fluorescence method17 also employs wavelengths in the visible spectra . The method’s diagnostic capacity is based on scattering and loss of natural fluorescence of the tooth. The light scattering in the lesion acts as a barrier for excitation light to reach the underlying dentine, and as a barrier for fluorescence light from the layers below the lesion to reach the tooth surface. The method is therefore limited to the assessment of incipient caries lesions. Methods that use longer wavelengths, such as in the NIR spectra , can penetrate the tissue more deeply. This deeper penetration is crucial for TI. The identification of dental caries with the TI method is based on the fact that increased mineral loss in enamel lesion leads to a two orders of magnitude increase in scattering coefficient at wavelength.8, 18 Caries thus appear as dark regions on the image because less light reaches the detector. In order to quantify TI as an imaging technique one can determine the spatial resolution that can be attained. Spatial resolution refers to the minimum distance between distinguishable objects in an image, for example, clearly defining the extent or shape of features such as caries tissue in comparison to surrounding healthy tissue. As Hall and Girkin2 pointed out, a deeper light penetration into the tooth associated to longer wavelengths is in principle also coupled to a decreased ability to spatially resolve small details. However, the limit imposed on the spatial resolution by the wavelength employed is not a decisive factor in TI measurements. Any wavelength from the ultraviolet to the NIR is sufficiently short to resolve the smallest caries lesions of interest. Therefore, the limit imposed on the spatial resolution by the wavelength employed in TI measurements is determined by scattering and absorption. Fried,14 reported that wavelengths in the NIR region offer the greatest potential due to the weak scattering and absorption in dental hard tissue. Most of this previous work was carried out at wavelength, where low-cost light sources are available. Thus, the wavelengths of choice in the present work were 1.28 and . The latter wavelength is chosen in the hope that the increased absorption of water in demineralized tissue could increase the contrast of caries images. For the implementation of the TI technique in a clinical environment, it is important to be able to quantify the spatial resolution and in this way determine how small a detectable caries lesion can be. We implemented a procedure to determine the spatial frequency of the imaging system from traces obtained by light transmission across intact enamel in vitro. To this end, rather than working with caries tissue of undetermined contrast, we used artificial patterns recorded on masks. The periodic patterns had a known number of line pairs per millimeter (LP/mm), where a line pair consisted of an absorbing line and an adjacent lucent space. The spatially periodic patterns were projected on the surface of intact teeth of various thicknesses, resulting in a distribution of shallow regions that were entirely dark, mimicking an array of “perfect” shallow caries lesions. This known input image then passed through the enamel tissue to the detector and the contrast of the recorded image was used for the measurement of the resolution of the system. Because highly subjective perception and judgment is involved when estimating the contrast, the quality of the imaging system can instead be characterized by the entire modulation transfer function (MTF).19, 20 MTF is the function that describes the modulation at a given spatial frequency. Imaging systems reproduce high spatial frequency signals with worse contrast than low spatial frequency, and consequently their MTFs decrease with increasing spatial frequency. The importance of the location of the caries lesion and how the resolution differs when the resultant image has to traverse a thick part versus a thinner part of the tooth to reach the detector is also of interest. Dental radiographs lack sufficient ability for early caries detection.1, 21, 22 An initial caries lesion may be missed or be underestimated in size in radiographs due to low attenuation of radiation in lesion, particular physical properties of the tooth structure, and imperfect technique (such as overlapping). The TI method offers the advantage of allowing repeated projection to overcome some of these limitations. In this paper, a tooth section with artificial enamel caries was illuminated from both sides with NIR light followed by detection of the transmitted image. In this way, the contrast of the signal generated by a single lesion located near the tooth surface facing the CCD camera could be compared to that recorded when the CCD camera was placed on the opposite side of the tooth. Thus, the same caries generated two images, one acquired through a thinner enamel layer (caries near CCD) and one through a thicker layer (caries far from CCD). The sample thickness was then reduced consecutively on one side, and the image capturing procedure was repeated for each thickness. This exploits the advantage of TI over x-rays of allowing performing these two measurements to estimate where the caries is located on the approximal surface, because for uniform enamel if the caries is equidistant from the buccal and from the lingual tooth surfaces, respectively, the resolution is expected to be equal. Thus, the aim of this paper was to characterize the performance of a TI system for the study of enamel caries lesions using two wavelengths in the NIR spectrum, 1.28 and , and determine the resolution attainable from the MTF of the system at these wavelengths. Furthermore, we examined the possibility of estimating the enamel caries position by comparing images obtained from the two sides of a tooth section. 2.Material and Methods2.1.Ethical ConsiderationsPatients at the Federal University of Pernambuco, Department of Prothest and Surgical Dental Facial undergoing extraction were asked for informed consent according to approval from the Ethical Committee of the University in Recife PE (268/2007), and teeth were collected and stored in a physiological saline solution 0.9% to preserve tissue hydration. 2.2.Experimental SetupThe laser light from fiber-optics used as the illumination source operated at two different wavelengths: (Raman Fiber Laser, Key Optical System, China) with a maximum available output power of and a bandwidth of 0.57 or (super luminescent diode SLD-571, SUPERLUM, Moscow, Russia) with a maximum available output power of and a bandwidth of . The laser beam impinged on a objective and produced a diverging beam of light that illuminated the tooth section. The tooth to camera distance was and the total image exposure time was . The readout noise of the imaging background was controlled by adjusting the polarizers from parallel to perpendicular to each other. The detector was adjusted to limit the degree of saturation and to provide adequate contrast to the captured images. The detector was a CCD camera with spectral response characteristic (MicronViewer 7290A, Electrophysics, Fairfield, New Jersey ) but, because of the wavelength dependence of the quantum efficiency of the CCD camera, the intensity used at was slightly higher than at . The digital images were captured using the software program Spiricon Laser Beam Diagnostics (LBA-PC, Version 2.5, Ophir-Spiricon Inc., Logan, Utah) and analyzed with a downloadable image-processing program, ImageJ (NIH, Bethesda, Maryland). A diffuser was used in front of the illuminated teeth, creating a wide distribution of incidence angles, reducing coherence, and thus reducing the problem with speckle. The diffuser consisted of a -thick piece of white Kodak lens cleaning tissue. 2.3.Spatial ResolutionTwo intact human third molar teeth were selected for the study. A buccolingual section, thick, was sawn perpendicularly to the occlusal surface from each tooth using a low speed diamond wheel saw (Model 650, South Bay Technology, San Clemente, California). Resolution test charts set by the U.S. Air Force in 1951 (MIL-STD-150A standard) were produced by the process of photolithograph printed by a graphic image setter (Imagesetter Mako 56, ECRM, Watford, UK ). The spatial resolution of the TI system was tested with this bar test tool (i.e., one dark line and one light space per period), also known as LP/mm. Eight test charts with various values of spatial periods were used: 0.10; 0.15; 0.20; 0.30, 0.40; 0.50; and 0.60 and . This range was chosen to simulate early caries lesions and has not been investigated in detail previously. TI images from the section of the first tooth were obtained using both wavelengths and with a sequence of all sizes of the charts. The masks were attached closely to the tooth section and to the surface located closest to the light source (see Fig. 2 ). Each image was captured twice, once with the chart positioned horizontally and once with the chart positioned vertically. Imaging of the thick section of the second tooth was performed in the same way. Both sections were thereafter sawed (Micro Electrical Motor, Beltec, LB 100 Model, São Paulo, Brazil) consecutively into 6-, 5-, 4-, 3-, 2-, and sections and the imaging procedure was repeated for each thickness. Figure 3 shows an example of a thick section and corresponding intensity profile with the period test pattern (i.e., , which indicates -thick features, irradiated with ). Two observers calculated the contrast (C) and spatial frequency (LP/mm) of acquired TI images. This was done by plotting with the image processing program the profile of intensity values along a line set on a designated area in the enamel region. The modulation , i.e., Michelson contrast, was calculated defined as: , with and , representing the highest and lowest mean intensity of the peaks. Qualitatively, the modulation and the contrast—as defined in the reference by Jones,10 —give similar results when the background intensity is low. The modulation is half of the contrast when the background intensity is large. A modulation of 1 (100%) means that the noise is negligible, and if the modulation is 0, no information is available. Fig. 2Illustration of an image sequence for the determination of spatial resolution of the TI system. Resolution test charts with a known numbers of line pairs per millimeter (i.e., black and white bars) were projected on the surface of intact teeth of various thicknesses. Each tooth section was imaged twice, with the test chart positioned horizontally and vertically, respectively.  Fig. 3(a) Image obtained through a section of a molar tooth with period resolution test chart placed vertically illuminated with wavelength radiation. (b) Line scan of the intensity profile. The black and hatched spots define the values of and used for the determination of modulation.  After an interval of one week, the same observers repeated the procedure for assessing the examiner reliability, evaluated by Lin’s intraclass correlation coefficient (ICC).23 2.4.Location of the Caries LesionA -deep cavity was prepared in an intact human molar tooth to simulate an approximal enamel caries lesion, using a diamond bur ( diam, no. 1011, KG Sorensen, São Paulo, Brazil) [Fig. 4 ]. The excavated cavity was filled with calcium hydroxide cavity lining material (Dycal®) and sealed with a thin layer of composite Filtek Z 350, color A2 (3M Espe, São Paulo). A buccolingual section, thick, was sawn perpendicularly to the occlusal surface using a low speed diamond wheel saw (model 650, South Bay Technology) [Fig. 4]. The distance from the outer enamel surface of the section and to the boundary of the simulated caries lesion was thick, called caries side. The simulated caries lesion was estimated to , which meant a remaining -thick enamel tissue on the noncaries side [Fig. 4]. TI images were acquired from both sides of the tooth section using uniform illumination at both wavelengths. The sample was then reduced consecutively on the noncaries side by a microelectrical motor (Beltec, LB 100 Model) into 5-, 4-, 3- and sections. The image-capturing procedure was repeated for each thickness. Here, the modulation was calculated from , where is the average intensity measured in a lesion and is the average intensity measured at neighboring healthy tissue. The modulation was determined from both sides of the tooth section. The center of the simulated lesion was used to define the position of the caries. Therefore, the distance of the center of the lesion to the surface on the caries side was always regardless the tooth-section thickness. Each image was acquired twice, once with and once without a thin paper diffuser to reduce speckle, at the expense of intensity loss. Images with less speckle pattern were chosen for further evaluation. Fig. 4Human molar tooth with a simulated enamel caries lesion, here illustrated as a filled circle (a). The two proximal surfaces were sawn off and left (b) a tooth section. First, the NIR light was projected on the noncaries side with the CCD camera placed on the caries side, which was held constant throughout the image-capturing procedure. Second, the NIR light was projected on the caries side with the CCD camera placed on the (c) noncaries side. The tooth section was then subsequently reduced on the noncaries side (from ) and image capturing was repeated from both sides for each thickness. 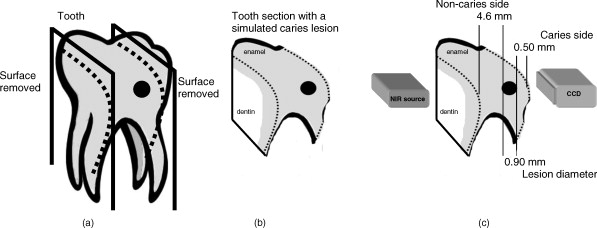 3.Results3.1.Spatial ResolutionTwo intact molar teeth sections of various thicknesses were illuminated. Occasional differences were found between the optical resolution values obtained for the two sections of same thickness, but no overall trend was found favouring either of the wavelengths used. The test charts were detectable with various resolutions when imaged through tooth sections as thick as when illuminated with a wavelength. When using the longer wavelength transmission, a usable image was measured in all sections up to . It was not possible to determine the optical resolution in the sections regardless of the wavelength used here. Figure 5 shows the modulation transfer function against spatial frequency when the shorter wavelength illuminated 1-, 2-, and thick tooth sections. Figure 5 shows the MTFs at wavelength for tooth sections 2-, 3-, and thick. In both these sequences, it is clear that the image degrades as it traverses thicker layers of enamel, because the modulation decreases with thickness. The fitting to a single exponential is acceptable and is improved with the use of a double exponential function. No saturation of the modulation is observed, even for the widest lines and thinnest tooth sections, the largest values of always being . This implies that the background is not negligible, even in these cases. The modulation values for a given spatial frequency and comparable tooth thickness is higher for than for wavelength illumination. Nevertheless, the difference can be attributed to experimental factors, such as the higher illumination level used to compensate for the spectral response of the camera. The range of LP/mm that can be distinguished on the resultant image for a given chosen threshold contrast was estimated in 1, 2, 3-, and sections when illuminated with and is presented in Table 1 . The analysis of the optical resolution was undertaken once again one week later, and the ICC (0.97) revealed excellent examiner reliability. Fig. 5(a) Modulation transfer function of imaging system for sample 1 at wavelength. Results for (top line), (middle line), and (bottom line) thick sections are shown. (b) Modulation transfer function of TI system for sample 2 at wavelength. Results for (top line), (middle line) and (bottom line) thick sections are shown. 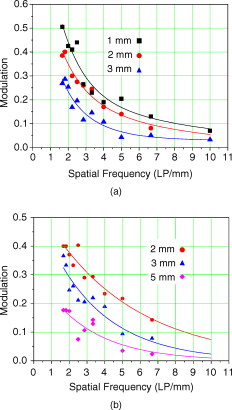 Table 1The lowest value obtained of the spatial resolution (in LP/milimeter) of the TI system measured for tooth sections of thickness 1–4mm for various threshold values above which the modulation is considered sufficient for caries detection. The wavelength used was 1.28μm .
3.2.Location of the Caries LesionThe artificial-enamel caries lesion was clearly detectable in all images obtained in the case of the caries near the CCD, regardless of the sample thickness or used wavelength. In the case of the caries far from the CCD camera, the modulation was poorer. Figure 6 illustrates the images of the section when the lesion was located: Fig. 6 near the CCD camera (clearly seen with large modulation), and Fig. 6 far from the CCD (almost undetectable). The modulation was calculated for all thicknesses in the case of the caries far from the CCD, as illustrated by the squares in Fig. 7 . The fitted line is a single exponential. The modulation for the simulated lesion located near the CCD camera is also shown in Fig. 7 and illustrated by filled circles. Here, the modulation was relatively constant for all thicknesses except for the -thick section, where a 16% modulation was found. As expected and seen in Figs. 6 and 6, the modulation recorded is larger when caries is near the CCD camera than when the caries is on the other side. This is reflected by a large ratio between these two modulation values: . When the tooth section was thinned down to and the caries was 2.05 and from the faces, respectively, the ratio reduced to , with the modulation taking the values, 0.45 and 0.15. Fig. 6TI images of a single sample with an artificial caries lesion located: (a) closest to the CCD camera and (b) far from the CCD camera.  Fig. 7Modulation measured for TI images of an artificial lesion away from the tooth surface for various tooth thicknesses (see schematic in Fig. 4) The circles show the modulation with the CCD camera on the near side of the caries and the squares on the far side. 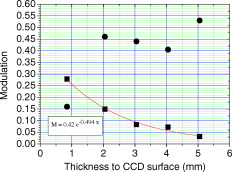 The ratio of modulation as a function of thickness of enamel traversed by the resultant image of the caries lesion on its way to the CCD camera is described in Fig. 8 . This graph can be regarded as a measure of the degradation of the modulation as the image of the caries traverses various thicknesses of healthy tissue. The curve fitted is an exponential ( , where is the thickness given in millimeters). The ratio of the modulation values expected is equal to 1 when the caries lesion is located at the center of the approximal surface of the tooth. Here, the artificial caries was drilled near one surface and, therefore, the caries is at the center only when the sample becomes thin. The filled square (red) in Fig. 8 illustrates this situation. In spite of the large experimental error of the reading for the tooth section, the fitted curve for takes value 1 within a small fraction of a millimeter from where the two sides are equal. We also plot the data taken from Fig. 5 in the measurement of the MTF of the system using projected images, for comparison. The modulation at a chosen spatial frequency ( , i.e., -wide lines) was determined for 1-, 2-, and tooth sections. The ratio between and is plotted as circles in the same graph of Fig. 8. The data also show how the image of a feature deteriorates if it has to traverse a thicker layer of enamel before detection by the CCD. The rapid variation in the ratio (from 16 to 1 for only ) makes the fitted curve quite forgiving. The location of the caries lesion from the ratio between modulation values read from both sides of the tooth section has an error estimated at . Fig. 8Ratio between modulation values measured from both sides of a tooth. The distance from the near surface of the tooth to the center of the artificial caries was . The square point (red) at ratio 1 shows the value expected when the (far) thickness also is . The gray circles give the values and using the curves in Fig. 5 at LP/mm. (Color online only.) 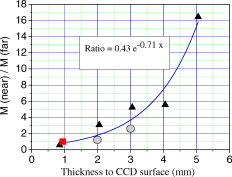 4.DiscussionThe TI system evaluated in the present study showed that useful images could be obtained at wavelength transmitted through enamel in tooth sections as thick as , and the through sections as thick as . This can be considered equivalent to imaging the contact area of approximal surfaces on molar and premolar teeth, a curved area with convex shape and therefore likely to be thinner than . These findings are similar to previous research performed by Jones,10 where a NIR imaging system operating at was used for detection and imaging of simulated approximal enamel caries. A clearly demarcated boundary between the simulated lesions and the surrounding healthy enamel was shown, and the authors suggested that resolving caries lesions through enamel is clinically feasible. Bühler 9 demonstrated the transparency of occlusal enamel surfaces, approximated in thickness, and showed that the NIR imaging can be used for the detection and imaging of occlusal caries lesion as well. We found no overall trend in favor of one of the wavelengths used when evaluating the optical resolution of acquired images. This indicates that the lower quantum efficiency of the CCD camera at is compensated for by the higher optical power used at this wavelength. All other parameters maintained, the cheaper light source should be preferred (the LED in the present case). Besides the considerations of cost and safety, acceptance of transillumination as a clinical technique for early diagnostic of caries should involve demonstrating adequate spatial resolution (i.e., sensitivity to small-size lesions). Radiographic diagnosis of approximal enamel caries has relatively low sensitivity to correctly identifying surfaces damaged by caries.1, 24, 25 The nonionizing TI system presented in this paper shows the ability to detect spatial frequencies of at modulation and at modulation. This indicates that features of 250 and , respectively, can be resolved with relative ease. Caution must be exercised, though because we use here the “perfect” caries lesion (i.e., frequency charts composed of line pairs of a perfect absorber and adjacent lucent space) to estimate the optical resolution of our TI system. Although contrast is a highly subjective evaluation,26 it is easier to detect lines of constant frequency than an irregular object, such as a natural caries lesion. Therefore, similar studies including teeth with natural caries would be valuable. The use of various masks allows estimating the smallest lesion measurable for a given modulation. Besides, it allows evidencing various limitations of the technique that deserve attention. Figure 9 shows a picture of a tooth illuminated through a horizontal mask. Interesting features from an optical point-of-view include refraction of light in dentine because of the tooth curvature and variations in density that lead to image distortion, shadowing and nonuniform illumination. Total internal reflection may also cause a dark rim around the tooth image. Even the spatial period may appear modified. Some of these features are less severe in the real case as the caries is in the tooth (and not a projected image). Nevertheless, care must be exercised and such optical effects taken into account in an all-optical measurement. Fig. 9Transillumination of tooth with the projection of a known pattern reveals various optical effects that can potentially distort the image in real caries measurements. 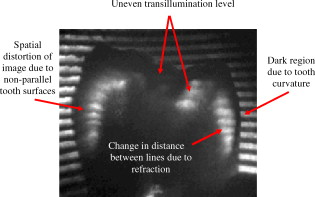 In the paper by Jones,10 the image quality was determined by calculating the intuitive contrast defined as rather than the conventional modulation used here. Note that the modulation always has lower values than the contrast: the source within the full system with the largest blur factor will determine the MTF of the total system.27 In that work, they show good contrast even for a -thick tooth (e.g., , which corresponds to ), where the image of the artificial caries situated in the midsection of the tooth has to traverse of sound enamel to reach the camera. No apparent monotonic degradation of the image contrast for thicker samples is observed from those results, which are based on the average of a larger number of measurements than the results of Figure 8 here. The difference in the present work may be that the conditions for image acquisition here were kept as constant as possible during the sequence of experiments It is not possible to compare our spatial resolution results to those of other TI systems for lack of similar studies. The literature is more extensive regarding digital oral radiographic systems where spatial frequency is one of the parameters used to describe image quality. Kashima28 reported that for dentistry the minimum spatial frequency for producing diagnostically acceptable intraoral x-ray images was between 2 and , depending on radiographic details investigated. There are studies assessing the diagnostic accuracy of digital imaging systems for the detection of caries lesions using spatial frequency, and in general, the greater the number of LP/millimeter the better. These reports cannot be considered as a comparison of the effect of the diagnostic accuracy, and the theoretical spatial resolution per se is not related to an improved detection of caries.29 As with all imaging systems, physical measurements are only part of the evaluation of the image quality. The efficiency of an imaging system encompasses several parameters, such as brightness, contrast, blur, etc. Images produced by the same signal may have different visual appearance and characteristics on different display devices. Clearly, this is unwanted in medical applications where the image and, consequently, the diagnosis, needs to be invariable and consistent. In this explorative study, the optical resolution of acquired images was estimated using ImageJ and analyzed on the same computer screen by two examiners, repeated one week later. Although the in vitro reliability for the analytical stage was excellent, further studies are required with several examiners analyzing TI images on several computer screens, evaluating the importance of differences in sample characteristics and of variation in image capturing procedure. An important benefit of the TI method is the possibility to repeatedly illuminate the tooth without ionizing radiation and being able to use miniature- or fiber-coupled light sources and imaging cameras. This should allow in vivo repeatable projection on the tooth to estimate the location of the caries lesion on the approximal surface from the ratio between the modulations of images captured from opposite sides of the tooth. In our in vitro measurements, the estimated error was when the caries image traversed of sound enamel, potentially corresponding to a total tooth thickness in excess of , Fig. 4. This compares favorably to the DIFOTI method, which employs wavelengths in the visible range and therefore is highly limited by strong light scattering, making it difficult imaging through more than 1 or of tooth.30 In conclusion, physical measures of an imaging technique based on transillumination of NIR light for detection of dental enamel caries have been performed. The optical resolution is described in terms of the modulation transfer function for various values of spatial frequency. The results show that the evaluated TI system can detect a spatial frequency of (i.e., a feature size of with modulation). Resolution of [i.e., features sizes was obtained with lower value of modulation (5–10%)]. Reduction of the modulation of the image of approximal caries lesion as it traverses thicker layers of enamel was used as a tool to determine the relative position of the caries in relation to the two surfaces of the tooth. AcknowledgmentsThe study was supported by grants from the Swedish Patent Revenue Fund for Research in Preventive Dentistry. ReferencesJ. D. Bader, D. A. Shugars, and A. J. Bonito,
“Systematic reviews of selected dental caries diagnostic and management methods,”
J. Dent. Educ., 65 960
–968
(2001). 0022-0337 Google Scholar
A. Hall and J. M. Girkin,
“A review of potential new diagnostic modalities for caries lesions,”
J. Dent. Res., 83 C89
–94
(2004). https://doi.org/10.1177/154405910408301S18 0022-0345 Google Scholar
L. Karlsson and S. Tranæus,
“Supplementary methods for detection and quantification of dental caries,”
J. Laser Dent., 16 8
–16
(2008). Google Scholar
I. A. Pretty,
“Caries detection and diagnosis: novel technologies,”
J. Dent., 34 727
–739
(2006). https://doi.org/10.1016/j.jdent.2006.06.001 0300-5712 Google Scholar
A. F. Zandona and D. T. Zero,
“Diagnostic tools for early caries detection,”
J. Am. Dent. Assoc., 137 1675
–1684
(2006). 0002-8177 Google Scholar
L. P. Choo-Smith, C. C. Dong, B. Cleghorn, and M. Hewko,
“Shedding new light on early caries detection,”
J. Am. Dent. Assoc., 74 913
–918
(2008). 0002-8177 Google Scholar
H.-C. Wang, S. Fleming, Y.-C. Lee, S. Law, M. Swain, and J. Xue,
“Laser ultrasonic surface wave dispersion technique for non-destructive evaluation of human dental enamel,”
Opt. Express, 17 15592
–15607
(2009). https://doi.org/10.1364/OE.17.015592 1094-4087 Google Scholar
C. L. Darling, G. D. Huynh, and D. Fried,
“Light scattering properties of natural and artificially demineralized dental enamel at ,”
J. Biomed. Opt., 11 34023
(2006). https://doi.org/10.1117/1.2204603 1083-3668 Google Scholar
C. Bühler, P. Ngaotheppitak, and D. Fried,
“Imaging of occlusal dental caries (decay) with near-IR light at ,”
Opt. Express, 13 573
–582
(2005). https://doi.org/10.1364/OPEX.13.000573 1094-4087 Google Scholar
R. S. Jones, G. D. Huynh, G. C. Jones, and D. Fried,
“Near-infrared transillumination at for the imaging of early dental decay,”
Opt. Express, 11 2259
–2265
(2003). https://doi.org/10.1364/OE.11.002259 1094-4087 Google Scholar
J. Wu and D. Fried,
“High contrast near-infrared polarized reflectance images of demineralization on tooth buccal and occlusal surfaces at ,”
Lasers Surg. Med., 41 208
–213
(2009). https://doi.org/10.1002/lsm.20746 0196-8092 Google Scholar
M. S. Hopcraft and M. V. Morgan,
“Pattern of dental caries experience on tooth surfaces in an adult population,”
Community Dent. Oral Epidemiol., 34 174
–183
(2006). https://doi.org/10.1111/j.1600-0528.2006.00270.x 0301-5661 Google Scholar
I. Mejàre, C. Källestål, H. Stenlund, and H. Johansson,
“Caries development from of age: a prospective radiographic study, prevalence and distribution,”
Caries Res., 32 10
–16
(1998). https://doi.org/10.1159/000016424 0008-6568 Google Scholar
D. Fried, R. E. Glena, J. D. B. Featherstone, and W. Seka,
“Nature of light scattering in dental enamel and dentin at visible and near-infrared wavelengths,”
Appl. Opt., 34 1278
–1285
(1995). https://doi.org/10.1364/AO.34.001278 0003-6935 Google Scholar
R. Hibst and R. Gall,
“Development of a diode laser-based fluorescence caries detector,”
Caries Res., 32 294
(1998). 0008-6568 Google Scholar
A. Schneiderman, M. Elbaum, T. Shultz, S. Keem, M. Greenebaum, and J. Driller,
“Assessment of dental caries with digital imaging fiber-optic transIllumination (DIFOTI): in vitro study,”
Caries Res., 31 103
–110
(1997). https://doi.org/10.1159/000262384 0008-6568 Google Scholar
E. de Josselin de Jong, F. Sundström, H. Westerling, S. Tranaeus, J. J. Ten Bosch, and B. Angmar-Månsson,
“A new method for in vivo quantification of changes in initial enamel caries with laser fluorescence,”
Caries Res., 29 2
–7
(1995). https://doi.org/10.1159/000262032 0008-6568 Google Scholar
C. L. Darling and D. Fried,
“Optical properties of natural caries lesions in dental enamel at ,”
Proc. SPIE, 5687 102
–110
(2005). https://doi.org/10.1117/12.604554 0277-786X Google Scholar
J. C. Feltz and M. A. Karim,
“Modulation transfer function of charge-coupled devices,”
Appl. Opt., 29 717
–722
(1990). https://doi.org/10.1364/AO.29.000717 0003-6935 Google Scholar
S. K. Park, R. Schowengerdt, and M.-A. Kaczynski,
“Modulation-transfer-function analysis for sampled image systems,”
Appl. Opt., 23 2572
–2582
(1984). https://doi.org/10.1364/AO.23.002572 0003-6935 Google Scholar
J. Yang and V. Dutra,
“Utility of radiology, laser fluorescence, and transillumination,”
Dent. Clin. North Am., 49 739
–752
(2005). https://doi.org/10.1016/j.cden.2005.05.010 0011-8532 Google Scholar
A. Wenzel, F. Haiter-Neto, and E. Gotfredsen,
“Influence of spatial resolution and bit depth on detection of small caries lesions with digital receptors,”
Oral Surg. Oral Med. Oral Pathol. Oral Radiol. Endod., 103 418
–422
(2007). https://doi.org/10.1016/j.tripleo.2006.05.016 1079-2104 Google Scholar
L. I. Lin,
“A concordance correlation coefficient to evaluate reproducibility,”
Biometrics, 45 255
–268
(1989). https://doi.org/10.2307/2532051 0006-341X Google Scholar
D. N. Ricketts, E. J. Whaites, E. A. Kidd, J. E. Brown, and R. F. Wilson,
“An evaluation of the diagnostic yield from bitewing radiographs of small approximal and occlusal carious lesions in a low prevalence sample in vitro using different film types and speeds,”
Br. Dent. J., 182 51
–58
(1997). 0007-0610 Google Scholar
S. Tranaeus, X. Q. Shi, and B. Angmar-Mansson,
“Caries risk assessment: methods available to clinicians for caries detection,”
Community Dent. Oral Epidemiol., 33 265
–273
(2005). https://doi.org/10.1111/j.1600-0528.2005.00234.x 0301-5661 Google Scholar
A. Workman and D. S. Brettle,
“Physical performance measures of radiographic imaging systems,”
Dentomaxillofac Radiol., 26 139
–146
(1997). https://doi.org/10.1038/sj.dmfr.4600241 0250-832X Google Scholar
T. T. Farman, R. H. Vandre, J. C. Pajak, S. R. Miller, A. Lempicki, and A. G. Farman,
“Effects of scintillator on the modulation transfer function (MTF) of a digital imaging system,”
Oral Surg. Oral Med. Oral Pathol. Oral Radiol. Endod., 99 608
–613
(2005). https://doi.org/10.1016/j.tripleo.2004.08.013 1079-2104 Google Scholar
I. Kashima,
“Computed radiography with photostimulable phosphor in oral and maxillofacial radiology,”
Oral Surg. Oral Med. Oral Pathol. Oral Radiol. Endod., 80 577
–598
(1995). https://doi.org/10.1016/S1079-2104(05)80155-6 1079-2104 Google Scholar
G. Li, W. E. Berkhout, G. C. Sanderink, M. Martins, and P. F. van der Stelt,
“Detection of in vitro proximal caries in storage phosphor plate radiographs scanned with different resolutions,”
Dentomaxillofac Radiol., 37 325
–329
(2008). https://doi.org/10.1259/dmfr/62591340 0250-832X Google Scholar
C. L. Darling and D. Fried,
“Real-time near IR imaging of CO2 laser ablation of enamel,”
Opt. Express, 16 2685
–2693
(2008). https://doi.org/10.1364/OE.16.002685 1094-4087 Google Scholar
|
|||||||||||||||||||||||||||||||||||||||||||||||||


