
|
|
1.IntroductionMost brain imaging techniques, such as optical imaging of intrinsic signal (OIS) and functional magnetic resonance imaging (fMRI), rely on blood oxygen content for imaging neuronal activity.1, 2, 3 Thus, hemodynamic changes play an important role in investigating the coupling relationship between neurovascular response and functional brain mapping.4 Cerebral hemodynamics is considered to be closely related to several compartments, including arterial, venous, arteriolar, venular, and other capillary dynamics.5, 6 To collect information on the detailed activity of cerebral vessels, researchers have constructed many vascular models by investigating the dynamics of the vascular compartments using optical imaging of intrinsic signal. Friston developed a nonlinear dynamic model of hemodynamic response to neural activity by linking the normalized deoxyhemoglobin changes to stimulation in the venous compartment.7 This model was extended by Zheng via construction of a three-compartment hemodynamic model, including the arterial, venous, and capillary compartments, for further study of the relationship between hemodynamic changes and neural activity.8, 9 Vanzetta and Grinvald developed the dual-wavelength imaging method to identify the microvascular compartments for analyzing the activity-dependent dynamics of the cortical blood volume and oximetry.5 Recently, vascular compartment dynamics has been examined with 3-D laminar optical tomography (LOT) and in vivo two-photon microscopy during somatosensory stimulation.10 More detailed information about hemodynamics has been revealed using these newly developed techniques. Schiessl employed independent component analysis (ICA) to study hemodynamic responses by separating the vascular compartments to improve the signal-to-noise ratio (SNR) in functional brain mapping.11 They studied the distinct response dynamics of the arterial, venous, and capillary compartments by identifying each region using ex vivo vascular casts following the LOT data and two-photon image acquisition. Luo investigated the different responses between venules and arterioles by laser speckle imaging of the cerebral blood flow in microcirculation.12, 13 By separating the arteries and veins, it would be feasible to investigate in greater detail the spatiotemporal characteristics of arterial, venous, and capillary bed regions independently to determine their coupling relationships with neural activity using 2-D optical imaging. Automatic separation of arteries and veins is also important for computer-aided diagnosis of vascular diseases, e.g., aneurysm, stenosis, and retinal arteriosclerosis.14, 15, 16 To enhance the visualization of the vascular structure, it is critical to segment the vascular network and to distinguish arteries and veins. However, due to the complexity of the vascular network, it is time consuming and impractical to do this manually, suggesting a need for robust and quick techniques to identify and separate arteries from the vascular network with a minimal amount of manual intervention. According to our known literature, little work has been published to automatically identify arteries and veins in the cerebral cortex. A few papers have reported on artery-vein separation using retinal fundus image and magnetic resonance angiography (MRA). Yu and Akita identified the vessel types by utilizing the intensity difference between arteries and veins in a retinal fundus image.17, 18 A piecewise Gaussian model for profiling and differentiating retinal arteries and veins was proposed to describe the intensity distribution by considering the central reflex characteristic of the vessels.19 Grisan developed a so-called divide et impera strategy with color information for automatic discrimination of retinal vessels into arteries and veins.20 However, these described methods utilize only the intensity profile and may be prone to errors in the optical image of the cerebral cortex. More recently, Narasimha-Iyer combined structural and functional features that are the ratio of optical densities obtained through dual-wavelength illumination to separate retinal arteries and veins with an improved result.21 In MRA and computed tomography (CT), several methods to separate arteries and veins have also been proposed for many potential applications in the head, neck, lungs, heart, abdomen, and lower extremities.22, 23 These separation strategies include acquisition methods, post-processing techniques, and image-processing methods.22 A software package called 3DVIEWNIX-AVS for artery-vein separation was developed to improve the vascular visualization of contrast-enhanced MRA images.24 Although the above strategies have been successfully applied in 3-D MRA images, most of them, such as the phase-contrast and time-resolved acquisition approaches, may be unsuitable to apply to on 2-D optical imaging data because of their specificity related to MRA. In this paper, we present an automated method for artery-vein separation in cerebral cortical images recorded with optical imaging of intrinsic signal. Differing from prior works, this artery-vein separation method utilizes the vessel dynamic information based on the fact that the power spectra of the intrinsic physiological oscillations distribute differently on arteries than on veins. First, we extracted the vascular network from one cortical image, then determined the spectral features of the intrinsic signals by the multi-taper method (MTM) and statistical F-test. Finally, we separated the arteries and veins using the fuzzy c-means (FCM) method and region-growing approach. These procedures are described in this paper followed by a discussion, in which we analyze the limitations of our method and characterize the phase distributions of the intrinsic signals. 2.Materials and Methods2.1.Optical Imaging of Intrinsic SignalOptical imaging of intrinsic signal (OIS) is a functional brain-mapping technique that is increasing in popularity. OIS measures neural activities by imaging the reflected and scattered light from the active cerebral cortex. OIS offers both a higher spatial and temporal resolution than that achieved by most other alternative imaging techniques, such as fMRI and positron emission tomography (PET), for imaging cortical functional architecture.1, 25, 26, 27 In this study, all the image data were recorded using the IMAGER 3001 system (Optical Imaging Inc., New York). A schematic of the OIS system is shown in Fig. 1 . The camera system consisted of a charge-coupled device (CCD) array with high precision ( depth, dynamic range) and a set of front-to-front camera lenses with a diameter of . The camera was mounted to an XYZ regulation holder that was fixed on a vibration-isolated table for steady focusing on the region of interest (ROI) of the cerebral cortex. The cortical surface was epiilluminated with green light from a stabilized tungsten halogen lamp via light guides. This wavelength is one of the isosbestic points for the absorption of oxyhemoglobin and deoxyhemoglobin and can reflect cerebral blood volume changes more significantly than red light in the visible spectrum. Also, imaging with this green light can maximize the contrast of the vasculature and provide morphological information for segmentation of the blood vessels. A personal computer was used to capture and store the image data. The size of one image could reach in a factual imaging area of (approximate per pixel), which offered high-resolution images for the vessel-type separation procedure. Fig. 1Intrinsic optical imaging system. A stabilized halogen lamp provides the illumination source of a specific wavelength using a light filter. The high-resolution CCD camera has a depth, dynamic range, and two reverse-connected camera lenses. The personal computer stores the collected image data.  2.2.Animal Preparation and Data CollectionIn vivo imaging experiments were performed using male Sprague-Dawley (SD) rats ( , ) provided by the neurophysiology department in Xiangya Medical College of Center South University. The surgical procedures were described in detail in many previous reports.2, 26, 28, 29 Briefly, the rats were anesthetized with urethane by intraperitoneal injection. The anesthetic depth was maintained at a moderate level. The animal skull was exposed via a midline scalp incision and then thinned over the somatosensory cortex between bregma and lambda using a saline-cooled dentistry drill until the vessels of the cortex could be clearly observed. A chamber was fixed on the thinned skull using dentistry cement and filled with silicone oil to increase the translucency. The body temperature was measured by a temperature recorder and maintained at using a heating regulator pad. The respiration rate and heart rate (electrocardiogram) were monitored by a physiological record instrument (MP150, BIOPAC Inc., USA) to ensure a stable physiological state during data collection throughout each animal experiment. The recorded respiration frequency (RF) distributed from and the heartbeat frequency (HF) distributed from . During the optical imaging, the optical axis of the camera lens was kept perpendicular to the ROI to guarantee high-quality imaging. The image data were captured at . The sampling time duration was in our experiments, corresponding to a sampling resolution of in frequency. The RF and HF values detected from the optical imaging were basically the same as those in the physiological record instrument. 2.3.Extraction of the Vessel Network and its CenterlineThe first step of the artery-vein separation was to segment the vasculature from one cortical gray image chosen arbitrarily from the image sequence. Though few vessel segmentation methods are proposed for the cortical images, numerous approaches for retinal vessel extraction have been presented in the literature.30, 31, 32, 33, 34 We extracted the vessel network using an extended method proposed by Li 30 with a Gaussian-Laplacian filter and automated threshold selection.31, 35 The boundary of the extracted vessel was refined using the Gaussian matched filter constructed by the nonlinear Levenberg-Marquardt method.30 Figures 2, 2, 2 show a retinal image and the segmented vessels by Li’s method and our initial segmentation method, respectively. Among the four leading algorithms in the retinal DRIVE database (see Table 1 ), this initial vessel segmentation method ensures that false vessels produce the lowest acceptable level of true positives, which is practicable for our artery-vein separation method. Fig. 2Extraction of the vasculature and its centerline network. (a) A retinal fundus image used in Ref. 30. (b) Vessels detected by method used in Ref. 30. (c) Vessels extracted by our initial vessel segmentation method. (d) Raw cortical gray image captured with the optical imaging system. (e) Vasculature segmented from the raw gray image. (f) Centerline of the vascular network obtained by morphological operation of thinning. The branching points are marked by a larger gray value. 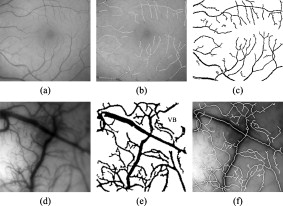 Table 1Performance comparisons of the initial vessel segmentation method and four other leading algorithms on the retinal DRIVE database. The performance comparison shows that our initial vessel segmentation method is practicable for the separation of arteries and veins, ensuring false vessels produce the lowest acceptable level of true positives.
TPR: truth positive rate; FPR: false positive rate; Ac: accuracy. Here, the TPR, FPR, and Ac are computed depending on the pixel number of each class. An extracted cortical vessel network denoted by VB is shown in Fig. 2, and the raw gray image can be seen in Fig. 2. To extract the vessel centerline from the vessel network, VB was first converted into a binary image. Then a morphological thinning operator35 was applied to the binary image to obtain the vascular centerlines, as shown in Fig. 2. The branching and crossover points were detected and labeled on the centerline network. For each intersection point, the number of its neighboring pixels with logical 1 should be no less than three under the definition of eight-connectivity. All of the detected branching and crossover points were assigned with a value differing from the other pixel values in the centerline network. These intersection points segmented the vessels into pieces on which the artery-vein separation procedure was implemented. Any two neighboring vessel segments were judged whether they belonged to the same vessel based on the similarity of their tangential directions in the neighborhood of the noted intersection point. 2.4.Feature Extraction in Frequency DomainThe time course for each pixel was transformed into the frequency domain to extract the spectral features. A mean time course for all image pixels is shown in Fig. 3 . If denotes the average gray level of the ’th image, , where is the number of the sampling image in each trial, then , where is the duration of one trial. Using the MTM,36, 37 was transformed into an expression of power spectral density (PSD) denoted by , . Fig. 3(a) Mean time course for all pixels of the captured image sequence. (b) Power spectral density of the mean time course as estimated by the MTM algorithm in Matlab. RF and HF, as well as eigenfrequencies F1 and F2, are labeled. The bandwidth between the two black dashed lines indicates the frequency range for computing the spectral power ratio values. The power summation in this spectral range is used as the denominator. (c) Results of statistical F-test spectral components showing. HF had a significance level (horizontal dashed line at the bottom), while RF, F1, and F2 had a significance level (dashed line at the top).  The MTM utilizes multiorthogonal data tapers known as a discrete prolate spheroidal sequence (DPSS) to estimate the spectrum in the adaptive weighted forms. Briefly, for a time sequence , , the frequency eigencoefficients can be computed by36, 37 where is the sequence of data samples, is the frequency in standard units, and is the ’th DPSS data window or taper defined as the real, unit-energy sequences on . The number of the data tapers is determined by , where is the bandwidth in standardized units. When the range of the spectrum is not too large, the multitaper estimate can be approximated asFor a periodic signal at frequency with amplitude , the least-squares estimate of is given byThe statistical F-test is presented as follows:where is the complex amplitude at frequency estimated by ordinary least-squares regression; , the ’th Slepian function, is the Fourier transform of the corresponding Slepian sequence; and is the minimized residual sum of squares, so the ratio of the energy in the F-test can be explained by assuming a line component to the residual energy. The standardized F variance-ratio test has 2 and degrees of freedom.37 If the value at frequency is larger than the given threshold, is thought to be a periodic component rather than the background noise.Due to the limited frequency resolution and the different physiological sources for respiration and heartbeat,38, 39 signals below , known as low-frequency oscillations with a center component of ,38 were not prepared for discussion in the following vessel separation procedure. In the frequency range of greater than , four significant linear spectral components were detected by spectrum estimation and statistical F-test at significance level . These four components were HF, RF, the first significant frequency denoted as F1, and the second significant frequency denoted as F2. For an SD rat, RF is approximately and HF is approximately ; the actual values of RF and HF are dependent on experimental individuals and their physiological state.39 For example, in the shown data, RF was approximately and HF approximately [see Fig. 3]. Based on the F-test results on each spectral component, the values indicated that there were significant linear components at the four frequency points [for HF, ; for RF, F1, and F2, ; see Fig. 3]. Additionally, the spectral power of these four linear components occupied over 10% of the gross power ranging from . Therefore, RF, F1, F2, and HF were all selected as the feature frequencies for artery-vein separation. A spectral power-ratio calculation in the range of was implemented at each pixel to reduce the effect of uneven illumination and to enhance the contrast between vessels and cortical parenchyma. Four power-ratio images corresponded to the four eigenfrequencies. Each power-ratio image was obtained by computing the ratio of the spectral power at the corresponding eigenfrequency to the summation of the spectral power ranging from at each pixel. The spectral amplitudes and power-ratio values constructed four couples of new gray intensity images, which were termed the spectral amplitude images and power-ratio images of RF, F1, F2, and HF, respectively (see Fig. 4 ). Fig. 4(a) Normalized spectral amplitude 1, 2, 3, and 4, and (b) normalized power-ratio distributions 1, 2, 3, and 4 of RF, F1, F2, and HF, respectively .  Both sides of most veins had higher RF amplitude than in venous central region. The RE is considered to reflect the periodical changes of the cerebral blood volume in the veins. The statistical significance of RF was also an important factor for choosing RF as one of the eigenfrequencies. The frequency of F2 behaved much stronger in the capillaries and thin vessels than in large vessels. The amplitude of F2 was relatively small in the main veins, and its power ratio was relatively small in both arteries and veins. The F2 frequency was considered to mainly reflect the red blood cells (RBCs) that traveled discretely in the vessels observed under OIS. This phenomenon was in accordance with observations by Vanzetta,40 and can be seen clearly in the recorded video after being bandpass filtered. Due to the thick walls of the main blood vessels, RBC movement may not be seen in the large arteries and veins using optical imaging. The amplitudes of F1 and HF were significantly different in the arteries than the veins. Both F1 and HF (especially HF) were observed to be stronger in the arteries than in the veins. The power-ratio image of HF revealed more differences in amplitude intensity distribution between the major arterial and venous regions, which provided more detailed information for the separation of arteries and veins. Therefore, both the amplitude and power ratio of HF were chosen as the elements of the feature vector for artery-vein separation. The arteries moved and oscillated in a different pattern with both sides of the arteries exhibiting higher HF amplitudes than the central regions, which presumably was caused by the vasomotion and transverse oscillation section by section at the frequency of the heartbeat. The eigenfrequency of F1 presented partly the same physiological response as HF. F1 had larger amplitude intensities in the arteries than RF and F2. The optical intrinsic signals would be a mixture in the artery-vein overlapping place, which must be taken into account in the artery-vein separation procedure. The cerebral cortex consists of three compartments—arteries, veins, and the capillary bed—according to the spectral distribution of the four eigenfrequencies [see Figs. 4 and 4]. For each compartment, four typical rectangular regions were manually selected with square regions, and the mean pixel sequence of each area was then transformed into the spectral domain by MTM to compare their spectral differences (see Fig. 5 ). Fig. 5Comparison of the power spectra in arteries, veins, and capillary bed. (a) Illustration of the manually selected typical feature regions with three class regions located in the arteries, veins, and capillary bed. Each of the four regions in the same compartment is marked with the same color. (b) Power spectra estimation of the pixel sequences in the arteries, veins, and capillary bed. All the spectra were estimated by the MTM algorithm. 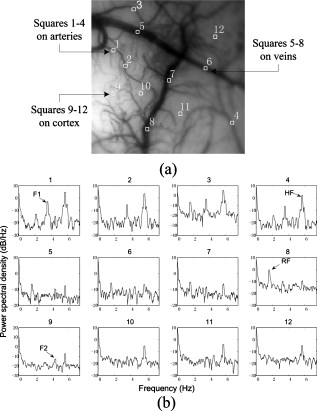 Figure 5 shows that the spectral magnitudes of HF and F1 were much higher than that of the other frequencies in the range in the arterial regions. In the venous regions, the spectral magnitudes of RF were higher in the frequency range, and the absolute spectral amplitudes of HF were comparable to RF. In the capillary bed, HF and F2 were the two dominant frequencies. Therefore, RF and HF were considered to be the main factors for identifying arteries and veins. In the F-test values, HF was less significant than RF, F1, and F2, which was probably because the arterial compartment occupied a small area in the ROI of the cerebral cortex. 2.5.Artery-Vein Separation Using the Fuzzy C-Means MethodTo separate the arteries and veins, the FCM clustering method41 was first used to determine the arterial seeds. Considering the uneven spectral power distribution of the intrinsic physiological signals, the seeded region-growing method42 was then applied to form integral vessel pieces from the classified seeds on the centerline of the vascular network. FCM clustering is an elementary but popular approximate clustering approach. It can be used to classify a data set with items into classes. The principle of this clustering approach is described as follows: Mathematically, the objective function of FCM for partitioning a dataset into clusters can be given by where is the fuzzy membership degree matrix that satisfiesand stands for the centroids of the clusters. The notation stands for the Euclidean norm, and is the number of elements in the dataset. The parameter represents the weighting exponent on each fuzzy membership and can be arbitrarity selected from the domain of .The FCM clustering approach was used to classify the arterial seeds from the four couples of spectral amplitude and power-ratio images. A morphologically clean filter was then performed on the clustered image to remove the point noise. Subsequently, an intersection operator was conducted on the vascular centerline to obtain the seeds of each compartment. The seeded region-growing method was applied to the vessel segments to reconstruct the arteries and veins based on the classified seeds. Two criteria were defined in the growing region:
The five steps of the separation procedure, with the arteries, veins, and vascular network denoted by , , and , respectively, are described below: Step 1: Extract the vascular network from the grayscale cortical image and obtain the centerline of the vascular network with the method described in Sec. 2.3. Step 2: Determine the arterial seed sets by the FCM clustering method. After the clustering returns, pixels in the cluster with maximum mean spectral power of HF are judged to be the arterial parts. The pseudo-code of the FCM method is given below.
Step 3: Find the arterial seeds on the centerline of the vascular network by applying the morphological operator of intersection ‘∩’. Step 4: Run the region-growing procedure to obtain the integral arterial centerline segments. The pseudo-code of region growing for arteries is given below.
Step 5: Execute the morphological operation of dilation on . The size of the dilation kernel was set to depending on the estimation of the maximum vessel diameter. The arteries and veins were then obtained by and , respectively. Here, the notation ‘\’ represents the difference between the two sets. The FCM clustering method was implemented on the feature vectors consisting of the four couples of eigenspectra images on the vasculature. After considering the artery-vein overlap and their relative location, i.e., whether the artery was located on the top of the vein or vice versa, we set the number of clusters to four in the FCM procedure. Implementing the clustering on the vasculature has the advantage of reducing the capillary disturbance to the arteries and veins, but it has the disadvantage of losing some vessel segments, which were absent from the extracted vascular network. We also tried to cluster the spectral distributions in the whole image. However, six or more classes must be defined to separate arteries and veins efficiently, taking account of the additional components such as arterioles, venules, and capillary regions for interchanging oxygen and nutrients. If an active area is stimulated, more predefined clusters are required. The FCM algorithm can converge to the same final clustering result when given different initial membership matrices in different runs. Figure 6 illustrates the convergence of FCM with different initial membership matrices on one image data point. 3.ResultsA sampling cortical image sequence was first adopted to validate the separation method. This sequence contained three main pieces of vessels, including both arteries and veins. Arterial seeds were obtained using the FCM clustering procedure from the amplitude and power-ratio mappings of RF, F1, F2, and HF [see Figs. 7 and 7 ], and then the arteries and veins were identified from the vascular network using the region-growing method. The separation results are shown in Fig. 7, where the red parts are arteries and the blue parts are veins. Figure 7 shows the raw gray image. Fig. 7(a) Spectral amplitude distributions of RF, F1, F2, and HF. (b) Power-ratio distributions of the four eigenfrequencies. (c) Raw cortical image. (d) Artery-vein separation result. The red and blue regions represent arteries and veins, respectively. (Color online only.) 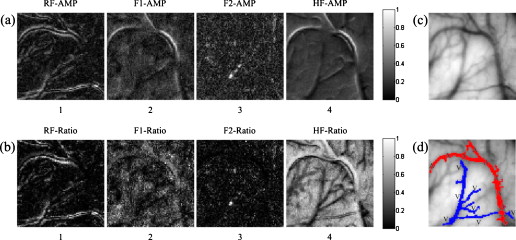 The separation results from the sampling cortical image validated the five steps of the separation procedure described above. We applied this procedure to the other cortical images with more arteries and veins. Figure 8 shows one example result of the separated arteries and veins. Four veins labeled V1 through V4 and five arteries labeled A1 through A5 [see Figs. 8 and 8] were extracted by the FCM and region-growing methods using the spectral amplitude and power ratio images of RF, F1, F2, and HF, as well as the corresponding vascular network. All the separated arterial and venous segments, plotted in red and blue, respectively, are shown in Fig. 8. The separation result with the arterial and venous centerline superimposed on the raw cortical image is shown in Fig. 8. We marked two typical misjudgments of the vessel types as C1 and C2 [see Fig. 8] and will discuss them below. Ground-truth data were obtained from the 12 cortical gray images by the physiological expert, who manually labeled significant vessels and indicated their types. The vessels whose type exhibited ambiguity were excluded in the ground-truth data. The separation results were compared against the ground-truth data to estimate the performance. The true positive rate (TPR) was computed by the total length of the ground truth arterial/venous segments divided by the total length of the correctly classified arterial/venous segments. The sum of the true positive rate and misclassification rate was 1 for one vessel type.21 The TPR of our separation method reached 97.7% for the arteries and 98.4% for the veins. The misclassification of arteries as veins was 2.3%, and the misclassification of veins as arteries was 1.6%. Fig. 8Example result of artery-vein separation using the FCM clustering approach and region growing method. (a) Venous centerline segments labeled as V1, V2, V3, and V4. (b) Extracted arterial centerline segments labeled A1 through A5. (c) Artery-vein contrast image: red parts represent arteries, blue parts represent veins, and cyan pixels show the overlapping parts of arteries and veins. (d) Superimposition of arteries and veins on the raw gray image. The two typical limitations in the artery-vein separation results are denoted by C1 and C2. The points marked by C1 represent the first limitation where arterial fragments belonging to the same artery were divided into pieces by larger veins. The points marked by C2 represent the second limitation, a misjudgment of arterial segments. (e) Estimated power spectrum in arterial, venous, and capillary bed regions. The black line represents power spectra in the capillary bed, the blue line represents power spectra in venous regions, and the red line represents power spectra in arterial regions. (Color online only.)  Following the artery-vein separation, the power spectral density of the pixel sequences in the arteries, veins, and capillary bed were estimated by MTM to compare their oscillational distribution characteristics in the frequency domain. In the arterial regions, the power spectra of F1 and HF were significantly larger than those in the venous regions, while the power spectra of RF and F2 had greater values in the veins [as shown in Fig. 8]. The three mean time courses were normalized before the spectrum estimation. The spectrum in the capillary bed displayed a median value compared with those in the arterial and venous regions, which may be explained by the contribution of the remaining arterioles and venules. Overall, these three spectral densities suggest that the different oscillational characteristics may provide useful information for the detailed hemodynamic analysis by separating arteries and veins. The veins separated by using the venous maximal RF power in the region-growing procedure are also shown in Fig. 9 for comparison. Some small veins were missed with this strategy, which presented a relatively weak performance in contrast with the approach above. Hence, we chose the subtraction strategy to obtain the veins. 4.DiscussionThe artery-vein separation method used in this study had two limitations, as marked in Fig. 8. First, the area enclosed by C1 contained typical artery and vein crossover points, termed break points. In C1, the arterial fragments, which factually belonged to the same artery, were divided into two more parts by the thick veins lying over the arteries. In some situations, it is important to connect the adjacent arterial fragments that are divided by the veins for functional brain mapping analysis or hemodynamic modeling. In this case, because the directions of the two arterial parts were very close, it was feasible to link the two parts together using an image-processing method. However, if an artery travels below the vein for a distance and its direction alters significantly on the other side of this vein, it would be a challenging problem to link the arterial fragments together unless certain heuristic information has been given. The second limitation of the vessel-type separation is illustrated in the area marked by C2. C2 was located at the crossover regions of the arteries and veins with abundant arterioles. One vessel part at the inner top of C2 was judged to be an artery and the other part at the inner bottom of C2 to be a vein. In C2, there were many small arterioles and venules located nearby, and their inevitable interference with the neighboring major arteries and veins likely resulted in misjudgments of the vessel types. We attempted to separate the arteries and veins using the phase distribution of the four eigenfrequencies, as shown in Fig. 10 . In the phase distribution of RF, both the arteries and veins exhibited a bilateral antiphase, which provided little contribution to the vessel-type separation but was useful for vessel extraction. Fortunately, phases of F1 and HF exhibited significant differences between the regional arteries and veins. The phase maps of F1 and HF depicted a bilateral antiphase distributed along all the vessels. However, the phenomenon of bilateral antiphase in the arteries was altered section by section, i.e., the bilateral phases in one section were the reverse of the neighboring section, which was likely caused by the arterial wiggle. In contrast, the phases in the veins were maintained almost constant throughout all sections along the two sides of the vessels. This was mainly caused by the RF vasomotion. Therefore, based on these features, we could determine whether the vessel was an artery or not. However, the phase distribution of F2 provided information mainly in small vessels; due to the limited spatial resolution, the very small vessels were difficult to correctly identify. The optical intrinsic signals captured from rats anesthetized by pentobarbital sodium also had four significant frequencies in the domain of (data not shown), which is in accordance with the spectral distribution of signals from rats anesthetized by urethane. Thus, overall the results from the present study suggest that the four eigenfrequencies rely on only the physiological state of the animal, and are intrinsic physiological oscillations. The RF and HF were relatively stronger in veins and arteries than in other small vessels, whereas F1, and especially F2, exhibited a relatively high amplitude in small vessels, including some in the deeper layers of the cerebral cortex. In this sense, RF and HF were the dominant elements for the separation of arteries and veins. The duration of image acquisition was set to in this work, which ensured an adequate frequency resolution for RF, F1, F2, and HF. However, the duration was not critical for artery-vein separation. A shorter duration can be feasible as long as it provides the proper frequency resolution. The minimum duration would vary for individuals and their physiological state during the experiments. The proposed method is distinct from prior work applied to retinal imaging and MRA. Almost all the prior work identified arteries and veins by utilizing the color or intensity information of the vessels. The performance of the dual-wavelength method21 was reported to be 97% and 90% accuracy for the retinal arteries and veins, respectively. The performance of our method reached 97.7% and 98.4% for the cerebral cortical arteries and veins, respectively, by utilizing the signal spectral features. We believe that the performance of our artery-vein separation method could be further improved under multiple-wavelength illumination. Nevertheless, applying our proposed method to retinal images would be a challenging task due to the problem of eye motion and blinking during the acquisition of a series of images. Though our method works on vessels with considerable width, its success is limited on very thin arterioles and venules. Very thin vessels with a width of one pixel or so are difficult to extract from the cortical gray image. For thin vessels, a successful classification method depends on the reliable extraction of the vessel hierarchy in vasculature and accurate labeling with their parent vessels. 5.ConclusionThe artery-vein separation method proposed in the present study was achieved using the spectral amplitudes and power ratios of the intrinsic physiological oscillations of RF, F1, F2, and HF. Each of the four feature frequencies was significant (F-test, ). The amplitudes and power ratios of the four frequencies in all the pixels constituted the feature vector, which was clustered using the FCM method to find the arterial seeds. By combining the extracted vessel network, this method was able to separate arteries and veins by 2-D optical imaging of intrinsic signal. The separation method was useful for hemodynamic modeling in different vessel types and may be valuable for cerebral surgery or diagnosis of vascular diseases by arterial morphological analysis. This method might also be extended to the identification of vessel types in depth-resolved optical imaging and focusing deeper into the cerebral cortex. A potential future study is to investigate the distributions of other intrinsic physiological signals, such as low-frequency oscillations, and the analysis of their power spectral differences in arteries and veins with optical imaging of intrinsic signal. AcknowledgmentsThis work was supported by the National Natural Science Foundation of China (grants 60835005 and 60771062) and the National Basic Research Program of China (grant 2007CB311001). ReferencesA. Grinvald, R. D. Frostig, E. Lieke, and R. Hildesheim,
“Optical imaging of neuronal activity,”
Physiol. Rev., 68
(4), 1285
–1366
(1988). 0031-9333 Google Scholar
N. Pouratian and A. W. Toga,
“Optical imaging based on intrinsic signals,”
Brain Mapping: The Methods, 109
–110 2nd ed.Academic Press, San Diego
(2002). Google Scholar
D. Attwell and C. Iadecola,
“The neural basis of functional brain imaging signals,”
Trends Neurosci., 25
(12), 621
–625
(2002). https://doi.org/10.1016/S0166-2236(02)02264-6 0166-2236 Google Scholar
A. Devor, A. K. Dunn, M. L. Andermann, I. Ulbert, D. A. Boas, and A. M. Dale,
“Coupling of total hemoglobin concentration, oxygenation, and neural activity in rat somatosensory cortex,”
Neuron, 39
(2), 353
–359
(2003). https://doi.org/10.1016/S0896-6273(03)00403-3 0896-6273 Google Scholar
I. Vanzetta, R. Hildesheim, and A. Grinvald,
“Compartment-resolved imaging of activity-dependent dynamics of cortical blood volume and oximetry,”
J. Neurosci., 25
(9), 2233
–2244
(2005). https://doi.org/10.1523/JNEUROSCI.3032-04.2005 0270-6474 Google Scholar
P. Li, S. Chen, W. Luo, and Q. Luo,
“In vivo optical imaging of intrinsic signal during cortical spreading depression in rats,”
Progr. Biochem. Biophys., 30
(4), 605
–611
(2003). Google Scholar
K. J. Friston, A. Mechelli, R. Turner, and C. J. Price,
“Nonlinear responses in fMRI: The balloon model, volterra kernels, and other hemodynamics,”
Neuroimage, 12
(4), 466
–477
(2000). https://doi.org/10.1006/nimg.2000.0630 1053-8119 Google Scholar
Y. Zheng, J. Martindale, D. Johnston, M. Jones, J. Berwick, and J. Mayhew,
“A model of the hemodynamic response and oxygen delivery to brain,”
Neuroimage, 16
(3), 617
–637
(2002). https://doi.org/10.1006/nimg.2002.1078 1053-8119 Google Scholar
Y. Zheng, D. Johnston, J. Berwick, D. Chen, S. Billings, and J. Mayhew,
“A three-compartment model of the hemodynamic response and oxygen delivery to brain,”
Neuroimage, 28
(4), 925
–939
(2005). https://doi.org/10.1016/j.neuroimage.2005.06.042 1053-8119 Google Scholar
E. M. C. Hillman, A. Devor, M. B. Bouchard, A. K. Dunn, G. W. Krauss, J. Skoch, B. J. Bacskai, A. M. Dale, and D. A. Boas,
“Depth-resolved optical imaging and microscopy of vascular compartment dynamics during somatosensory stimulation,”
Neuroimage, 35
(1), 89
–104
(2007). https://doi.org/10.1016/j.neuroimage.2006.11.032 1053-8119 Google Scholar
I. Schiessl, W. Wang, and N. McLoughlin,
“Independent components of the haemodynamic response in intrinsic optical imaging,”
Neuroimage, 39
(2), 634
–646
(2008). https://doi.org/10.1016/j.neuroimage.2007.09.022 1053-8119 Google Scholar
H. Cheng, Q. Luo, Q. Liu, Q. Lu, H. Gong, and S. Zeng,
“Laser speckle imaging of blood flow in microcirculation,”
Phys. Med. Biol., 49
(7), 1347
–1357
(2004). https://doi.org/10.1088/0031-9155/49/7/020 0031-9155 Google Scholar
P. Li, S. Ni, L. Zhang, S. Zeng, and Q. Luo,
“Imaging cerebral blood flow through the intact rat skull with temporal laser speckle imaging,”
Opt. Lett., 31
(12), 1824
–1826
(2006). https://doi.org/10.1364/OL.31.001824 0146-9592 Google Scholar
A. J. Houben, M. C. Canoy, H. A. Paling, P. J. Derhaag, and P. W. de Leeuw,
“Quantitative analysis of retinal vascular changes in essential and renovascular hypertension,”
J. Hypertens., 13
(12), 1729
–1733
(1995). https://doi.org/10.1097/00004872-199512010-00040 0263-6352 Google Scholar
H. Narasimha-Iyer, M. J. Beach, B. Khoobehi, J. F. Ning, H. Kawano, and B. Roysam,
“Algorithms for automated oximetry along the retinal vascular tree from dual-wavelength fundus images,”
J. Biomed. Opt., 10
(5), 054013
(2005). https://doi.org/10.1117/1.2113187 1083-3668 Google Scholar
T. Y. Wong, R. Klein, A. R. Sharrett, M. I. Schmidt, J. S. Pankow, D. J. Couper, B. E. K. Klein, L. D. Hubbard, and B. B. Duncan,
“Retinal arteriolar narrowing and risk of diabetes mellitus in middle-aged persons,”
J. Am. Med. Assoc., 287
(19), 2528
–2533
(2002). https://doi.org/10.1001/jama.287.19.2528 0098-7484 Google Scholar
J. J. Yu, B. Hung, and H. Sun,
“Automatic recognition of retinopathy from retinal images,”
Proc. Int. Conf. IEEE Engineering Medicine and Biology Society, 12
(1), 171
–173
(1990) Google Scholar
K. Akita and H. Kuga,
“A computer method of understanding ocular fundus images,”
Pattern Recogn., 15
(6), 431
–443
(1982). https://doi.org/10.1016/0031-3203(82)90022-X 0031-3203 Google Scholar
H. Li, W. Hsu, M. L. Lee, and H. Wang,
“A piecewise Gaussian model for profiling and differentiating retinal vessels,”
14
–17
(2003). Google Scholar
E. Grisan and A. Ruggeri,
“A divide et impera strategy for automatic classification of retinal vessel into arteries and veins,”
890
–893
(2003). Google Scholar
H. Narasimha-Iyer, J. M. Beach, B. Khoobehi, and B. Roysam,
“Automatic identification of retinal arteries and veins from dual-wavelength images using structural and functional features,”
IEEE Trans. Biomed. Eng., 54
(8), 1427
–1435
(2007). https://doi.org/10.1109/TBME.2007.900804 0018-9294 Google Scholar
T. Lei, J. K. Udupa, P. K. Saha, and D. Odhner,
“Artery-vein separation via MRA-An image processing approach,”
IEEE Trans. Med. Imaging, 20
(8), 689
–703
(2001). https://doi.org/10.1109/42.938238 0278-0062 Google Scholar
J. Svensson, P. Leander, J. H. Maki, F. Stahlberg, and L. E. Olsson,
“Separation of arteries and veins using flow-induced phase effects in contrast-enhanced MRA of the lower extremities,”
Magn. Reson. Imaging, 20
(1), 49
–57
(2002). https://doi.org/10.1016/S0730-725X(02)00479-4 0730-725X Google Scholar
T. Lei, J. K. Udupa, D. Odhner, L. G. Nyúl, and P. K. Saha,
“3DVIEWNIX-AVS: A software package for the separate visualization of arteries and veins in CE-MRA images,”
Comput. Med. Imaging Graph., 27
(5), 351
–362
(2003). https://doi.org/10.1016/S0895-6111(03)00029-6 0895-6111 Google Scholar
R. D. Frostig, E. E. Lieke, D. Ts’o, and A. Grinvald,
“Cortical functional architecture and local coupling between neuronal activity and the microcirculation revealed by in vivo high-resolution optical imaging of intrinsic signals,”
Proc. Natl. Acad. Sci. U.S.A., 87
(16), 6082
–6086
(1990). https://doi.org/10.1073/pnas.87.16.6082 0027-8424 Google Scholar
J. Mayhew, D. Hu, Y. Zheng, S. Askew, Y. Hou, J. Berwick, P. J. Coffey, and N. Brown,
“An evaluation of linear model analysis techniques for processing images of microcirculation activity,”
Neuroimage, 7 49
–71
(1998). https://doi.org/10.1006/nimg.1997.0311 1053-8119 Google Scholar
P. M. Kaskan, H. D. Lu, B. C. Dillenburger, J. H. Kaas, and A. W. Roe,
“The organization of orientation-selective, luminance-change and binocular-preference domains in the second (V2) and third (V3) visual areas of new world owl monkeys as revealed by intrinsic signal optical imaging,”
Cereb. Cortex, 19
(6), 1394
–1407
(2009). https://doi.org/10.1093/cercor/bhn178 1047-3211 Google Scholar
P. Li, Q. Luo, W. Luo, S. Chen, H. Cheng, and S. Zeng,
“Spatiotemporal characteristics of cerebral blood volume changes in rat somatosensory cortex evoked by sciatic nerve stimulation and obtained by optical imaging,”
J. Biomed. Opt., 8
(4), 629
–635
(2003). https://doi.org/10.1117/1.1609199 1083-3668 Google Scholar
S. Chen, P. Li, W. Luo, H. Gong, S. Zeng, and Q. Luo,
“Time-varying spreading depression waves in rat cortex revealed by optical intrinsic signal imaging,”
Neurosci. Lett., 396 132
–136
(2006). https://doi.org/10.1016/j.neulet.2005.11.025 0304-3940 Google Scholar
X. K. Li, T. Fang, J. K. Tyan, and M. Fang,
“Method for retinal vessel detection and diameter measurement,”
Proc. SPIE, 5370 1746
–1756
(2004). https://doi.org/10.1117/12.534539 0277-786X Google Scholar
X. Jiang and D. Mojon,
“Adaptive local thresholding by verification-based multithreshold probing with application to vessel detection in retinal images,”
IEEE Trans. Pattern Anal. Mach. Intell., 25
(1), 131
–137
(2003). https://doi.org/10.1109/TPAMI.2003.1159954 0162-8828 Google Scholar
J. Staal, M. Abramoff, M. Niemeijer, M. Viergever, and B. van Ginneken,
“Ridge-based vessel segmentation in color images of the retina,”
IEEE Trans. Med. Imaging, 23
(4), 501
–509
(2004). https://doi.org/10.1109/TMI.2004.825627 0278-0062 Google Scholar
M. Martinez-Perez, A. Hughes, S. Thom, A. Bharath, and K. Parker,
“Segmentation of blood vessels from red-free and fluorescein retinal images,”
Med. Image Anal., 11 47
–61
(2007). https://doi.org/10.1016/j.media.2006.11.004 1361-8415 Google Scholar
B. Al-Diri, A. Hunter, and D. Steel,
“An active contour model for segmenting and measuring retinal vessels,”
IEEE Trans. Med. Imaging, 28
(9), 1488
–1497
(2009). https://doi.org/10.1109/TMI.2009.2017941 0278-0062 Google Scholar
M. Sonka, V. Hlavac, and R. Boyle, Image Processing, Analysis, and Machine Vision, 180
–183 3rd ed.Cengage-Engineering, Florence, KY
(2007). Google Scholar
D. J. Thomson,
“Spectrum estimation and harmonic analysis,”
Proc. IEEE, 70
(9), 1055
–1097
(1982). https://doi.org/10.1109/PROC.1982.12433 0018-9219 Google Scholar
D. J. Thomson,
“Jackknifing multitaper spectrum estimates,”
IEEE Signal Process. Mag., 24
(4), 20
–30
(2007). https://doi.org/10.1109/MSP.2007.4286561 1053-5888 Google Scholar
H. Obrig, M. Neufang, R. Wenzel, M. Kohl, J. Steinbrink, K. Einhäupl, and A. Villringer,
“Spontaneous low frequency oscillations of cerebral hemodynamics and metabolism in human adults,”
Neuroimage, 12
(6), 623
–639
(2000). https://doi.org/10.1006/nimg.2000.0657 1053-8119 Google Scholar
J. Mayhew, S. Askew, Y. Zheng, J. Porrill, G. W. M. Westby, P. Redgrave, D. M. Rector, and R. M. Harper,
“Cerebral vasomotion: A oscillation in reflected light imaging of neural activity,”
Neuroimage, 4
(3), 183
–193
(1996). https://doi.org/10.1006/nimg.1996.0069 1053-8119 Google Scholar
I. Vanzetta, G. S. Masson, T. Deneux, and O. Faugeras,
“Cerebral blood flow recorded at high sensitivity in two dimensions using high resolution optical imaging,”
3rd IEEE International Symposium on Biomedical Imaging: Macro to Nano, 1264
–1267
(2006) Google Scholar
S. Theodoridis and K. Koutroumbas, 500
–522 2nd ed.Academic Press, San Diego
(2003). Google Scholar
S. A. Hojjatoleslami and J. Kittler,
“Region growing: A new approach,”
IEEE Trans. Image Process., 7
(7), 1079
–1084
(1998). https://doi.org/10.1109/83.701170 1057-7149 Google Scholar
|


