1.IntroductionAdvances in molecular probes, transgenic mouse models, and imaging instrumentation as part of the field of molecular imaging are enabling elucidation of in vivo cell biology, molecular pathways, and disease mechanisms.1 Fluorescence imaging techniques are widely used to visualize dynamic biological processes in cells and living animals, but most wide-field microscopes are limited to thin or transparent samples and are largely used on cells and excised tissues. Intravital microscopy, where the microscope objective is placed in proximity to tissues of living animals, is revealing cellular and molecular changes that were previously inaccessible.2 Recently, we have developed a microelectromechanical systems (MEMS)-based dual-axis confocal (DAC) microscope that performs 3-D cellular imaging in a miniaturized package conducive to in vivo imaging for the purpose of improving preclinical studies and enabling clinical point-of-care microscopy.3 The DAC architecture provides optical sectioning performance with cellular resolution4 as well as superior rejection of scattered light, relative to conventional single-axis confocal microscopes, leading to deeper imaging in tissue.5, 6 The hand-held DAC microscope is well suited for imaging the skin, where depths down to can be acquired noninvasively. This includes the full epidermis and upper dermis of the mouse footpad, which has similar thickness and layer composition to human skin. The genetics of monogenic skin disorders—skin diseases resulting from a single gene mutation—are well characterized and have identified targets for developing molecular therapies.7 Small interfering RNAs (siRNAs) are promising drug candidates for these disorders due to potency and selectivity for silencing target genes.8 Despite demonstrated effects of siRNA for controlling gene expression in cultured cells, development of siRNA-based therapies for treating patients, including those with monogenic skin disorders, has largely stalled at the point of effective delivery.9, 10 Our group has previously reported on the development of reporter mouse models enabling the study of siRNA delivery to the skin, where siRNA silencing of the reporter gene was demonstrated.8, 11 Here, we demonstrate the ability of the hand-held DAC microscope to perform 3-D in vivo molecular imaging to study gene expression in mouse skin models and reveal the spatiotemporal gene expression patterns in response to siRNAs targeting the reporter gene. In vivo fluorescence signal levels at different time points are quantified as a means of assessing therapeutic response. Intravital imaging in the skin offers the potential for accelerating the development of therapies in dermatology. 2.Materials and Methods2.1.Imaging Systems2.1.1.Dual-axis confocal microscopeThe -diam DAC microscope is based on a dual-axis architecture12 and MEMS technology13 for miniaturization, and has a transverse resolution of and axial resolution of at wavelength. A schematic of the imaging system is shown in Fig. 1 , with the DAC microscope alongside the laser and detection apparatus. Details of the microscope setup and components were previously reported.3 The 2-D MEMS mirror raster scans the focal volume to generate a 2-D en face image ( plane) at , while the piezoelectric actuator translates the MEMS scanner in depth ( direction) every to acquire a 3-D dataset, satisfying the Nyquist sampling rate for cellular optical sectioning. 3-D image stacks were reconstructed into volume renderings using Amira® software (Visage Imaging, San Diego, California). 2.1.2.Maestro™ and IV100The Maestro™ optical imaging system (CRi, Woburn, Massachusetts) was used for whole-animal fluorescence imaging. Images were acquired with an excitation filter of wavelength, and a long-pass emission filter for imaging green fluorescent protein (GFP). Multispectral image acquisition was performed and later used for spectral unmixing of autofluorescence with the Maestro software. The Olympus IV100 is a laser scanning microscope for intravital imaging. Images were acquired at with a objective, and a argon laser was used for imaging the levels of GFP expression. Image stacks were taken every depth. Image acquisition and viewing were done with the FluoView software (Olympus Corporation, Center Valley, Pennsylvania). 2.2.Animal Models and In Vivo ImagingTransgenic mouse models that express GFP in the skin were used. The [mK17 ]-GFP mice (K17-GFP mice) were kindly provided by Coulombe.14 Skin-specific dual-reporter click beetle luciferase/humanized monster GFP mice (Tg CBL/hMGFP mice) were previously described and maintained in the animal facility at Stanford University.11 The mice were under 2% isoflurane anesthesia during in vivo imaging. For DAC imaging, an optical gel (index of refraction is 1.46) was applied to the region of the skin as an optical coupling agent. All animal work was carried out under strict adherence to institutional guidelines for animal care of both National Institutes of Health and Stanford University. 2.3.QuantificationThe in vivo GFP signal level in a given tissue volume was assessed by AMIDE software.15 For quantification of DAC images, illumination and detection settings were held constant within and between image datasets. Within the acquired 3-D volume, a region of interest was drawn consistently over different datasets for comparison of mean signal levels. 3.Results and DiscussionMicroscopic images of transgenic mouse skin models are shown in Fig. 2 . In these models, GFP is expressed in different compartments of the skin depending on the skin-specific promoter regulating the expression of the reporter protein or the recombinase used to direct skin specificity. These mouse models can be used to target different skin compartments for therapeutic development. Figures 2, 2, 2, 2 show images from mice where GFP expression is driven by a keratin 17 (K17) promoter.14 This promoter leads to GFP expression in epithelial structures such as hair follicles and glands. Figure 2 is an image of an ex vivo vertical skin section from the K17-GFP mouse taken with a conventional microscope (tabletop Axio Observer inverted fluorescence microscope). The tissue was removed, frozen, sectioned into -thick slices, and stained with DAPI for visualizing nuclei. Strong GFP expression is evident in the hair follicles. In comparison, the DAC microscope was used to image another live K17-GFP mouse, and images of optical sections of the skin are shown in Figs. 2 and 2. These are single en face images acquired at 26 and in depth, where the two planes correspond to two cut-away slices from the full 3-D volume rendered in Fig. 2. Fig. 2Microscopic imaging of transgenic mouse skin models. (a) through (d) are images of skin on the back of the K17-GFP mouse model. (a) Ex vivo skin vertical cross section ( thick) image taken with a tabletop Axio Observer inverted fluorescence microscope showing GFP (green) signal and DAPI (blue) stain. (b), (c), and (d) in vivo imaging with DAC microscope where en face images at (b) and (c) depth are shown; these are cross sections of (d) the 3-D tissue volume. (e) through (h) are images of footpad skin of the Tg CBL/hMGFP mouse model. (e) Ex vivo skin vertical cross section image taken with a tabletop Axio Observer microscope showing GFP signal and DAPI stain. (f), (g), and (h) In vivo imaging with DAC microscope where en face images at (f) and (g) depth are cross sections of (h) the 3-D tissue volume. All scale bars are .  Figures 2, 2, 2, 2 are from the Tg CBL/hMGFP mouse model, where hMGFP is localized in the top layers of the epidermis—the stratum corneum (SC) and granular layer (G).11 The ex vivo skin section is shown in Fig. 2, where the expression pattern in the stratum corneum appears uniform, and in the granular layer appears as aggregates. Figures 2 and 2 show in vivo DAC images from another live mouse at 7 and depth corresponding to the SC and G layers, respectively. Each plane can be identified in the 3-D tissue volume shown in Fig. 2. These figures demonstrate that the DAC microscope not only performs molecular imaging with cellular resolution in vivo, but can also acquire full-perspective 3-D volumes that are difficult to attain with skin sections. It should be noted that the high dynamic range and sensitivity of the microscope allows for imaging GFP expression at depths that are relevant to the study of skin pathologies and response to therapy. The Tg CBL/hMGFP mouse [Figs. 2, 2, 2, 2] was previously developed as a model in which to test delivery tools for treating monogenic skin disorders.11 Delivery technologies aimed at directing siRNA into skin cells at relevant layers of the skin can be tested in this mouse model, since the use of siRNA targeting GFP would enable gene silencing effects to be readily visualized, i.e., decrease in fluorescence signal at the site of delivery. The effects of this localized gene silencing can be initially observed in macro- and mesoscopic intravital images (Fig. 3 , left and right panels, respectively). The Tg CBL/hMGFP mouse was treated daily for three days with intradermal injections of of specific siRNA (CBL3,11 right footpad) targeting GFP and compared to an irrelevant siRNA (K6a 513a.12,11 left footpad). At the fourth day post-treatment, a maximum decrease in GFP signal was observed macroscopically with Maestro™ (Fig. 3, left panel). Then, the middle regions of the footpads, at the site of siRNA injections, were imaged with the IV100 microscope (Fig. 3, right panel) for better visualization of GFP inhibition in the right footpad. Although these images show the gene silencing effect of the specific siRNA treatment compared to the irrelevant control siRNA treatment in vivo, it is difficult to assess protein expression at the cellular level, and to quantify the GFP signal over time. Fig. 3SiRNA silencing visualized by macro- and mesoscopic intravital imaging post-treatment of a Tg CBL/hMGFP mouse. Irrelevant control siRNA (left footpad) and specific siRNA (right footpad) were injected intradermally at daily intervals for . Left panel: macroscopic image taken with CRi Maestro™. Right panel: mesoscopic images taken with Olympus IV100. 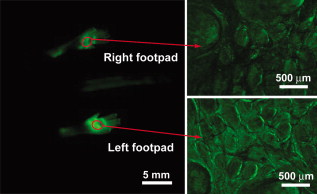 Microscopic images of ex vivo skin sections from a Tg CBL/hMGFP mouse, after two weeks of daily intradermal injections of siRNA, reveal gene knockdown [Fig. 4 ]. While a normal pattern of GFP expression can be seen for the left footpad (irrelevant control siRNA), the right footpad (specific siRNA) demonstrates significant inhibition of GFP expression. However, using traditional fluorescence microscopy of skin sections, we can only observe one time-point per mouse. To visualize change over time with this method, multiple mice would need to go through the same procedure and be sacrificed at different time points to study the dynamic response to therapy and restoration of expression. Mouse-to-mouse variability is generally hard to account for in these scenarios. Fig. 4SiRNA silencing visualized at the microscopic level in the Tg CBL/hMGFP mouse model. Irrelevant control siRNA and specific siRNA were injected intradermally into the left and right footpad, respectively. (a) Ex vivo skin sections after two weeks of treatment. Scale bars are . (b) In vivo imaging of footpads after of treatment using the DAC microscope. Sequential time points correspond to days post-treatment. The 3-D volume dimensions are . (c) Quantification of GFP signal levels from image stacks taken with the DAC microscope. Each footpad at each timepoint is imaged over multiple sites. Each column corresponds to the average of the datasets, and bars indicate the standard deviation. For days 3 and 5, the difference between left and right footpad are statistically significant, while for day 39, the difference is not statistically significant.  The DAC microscope allows for sequential cellular level imaging and quantification in vivo. The previous siRNA experiment was replicated with a Tg CBL/hMGFP mouse that was treated over and was followed post-treatment with the DAC microscope. The anesthetized mouse was imaged in multiple locations on each footpad. Since the left footpad (irrelevant control siRNA) appeared to have uniform fluorescence under the DAC microscope, image stacks were taken around the general area of intradermal injections in the mid-region of the footpad, corresponding to the area shown in the right panel of Fig. 3. For the right footpad (specific siRNA), the DAC microscope was used to scan an area of decreased GFP signal and acquire 3-D datasets over multiple sites. Representative 3-D image volumes taken in the mid-region at different time points post-treatment are shown in Fig. 4. The GFP expression levels are significantly lower in the specific siRNA-treated right footpad compared to the normal expression of the left footpad at day 3 post-treatment. However, since siRNA silencing is inherently a transient response, the GFP signal recovers some time after the treatment ends. This can be clearly seen at day 39 post-treatment. The laser power and PMT, transimpedance amplifier gain levels (Fig. 1), are controlled to be constant within and between datasets. Therefore, all volume renderings in Fig. 4 show levels of GFP in vivo that can be compared over time. A subset of the 3-D volume was taken into account for quantification, where the skin layer thickness and attributes are consistent. Fig. 4 shows the average GFP signal levels of the left and right footpad for the days represented in Fig. 4. At days 3 and 5 post-treatment, we observed statistically significant GFP inhibition in the right footpad, indicative of gene silencing. On day 39 post-treatment , the signal level for the right footpad recovered to similar levels of the left footpad. We note that the ratios of the average GFP signal of the right to left footpad are 40.6, 46.2, and 85.9% for days 3, 5, and 39 post-treatment, as expected as the therapeutic effect wanes. This form of quantification of sequential in vivo gene expression gives us an opportunity to directly monitor the effects of therapy. We demonstrate here the ability of the miniature DAC microscope to perform quantitative in vivo 3-D molecular imaging in skin. The high dynamic range of the microscope enables imaging of gene expression deep in tissue. With the capability to noninvasively image throughout the epidermis, effects of siRNA therapy on skin cells have been directly monitored. This can serve as a platform for tracking the progress and efficacy of drug candidates and delivery mechanisms over time. AcknowledgmentsThe authors would like to thank Frezghi Habte, Wibool Piyawattanametha, and Michael J. Mandella for their technical assistance, and Pierre A. Coulombe for providing the K17-GFP mice. We also thank Christopher M. Barnard for his thoughtful review of the manuscript. This work was supported by the National Institutes of Health [U54 CA105296 (Contag) and R44 AR055881 (Kaspar)]. Gonzalez-Gonzalez is the recipient of a Pachyonychia Congenita Project fellowship. ReferencesN. Blow,
“In vivo molecular imaging: the inside job,”
Nat. Methods, 6 465
–469
(2009). https://doi.org/10.1038/nmeth0609-465 1548-7091 Google Scholar
R. K. Jain, L. L. Munn, and D. Fukumura,
“Dissecting tumour pathophysiology using intravital microscopy,”
Nat. Rev. Cancer, 2 266
–276
(2002). https://doi.org/10.1038/nrc778 1474-175X Google Scholar
H. Ra, W. Piyawattanametha, M. J. Mandella, P. L. Hsiung, J. Hardy, T. D. Wang, C. H. Contag, G. S. Kino, and O. Solgaard,
“Three-dimensional in vivo imaging by a handheld dual-axes confocal microscope,”
Opt. Express, 16 7224
–7232
(2008). https://doi.org/10.1364/OE.16.007224 1094-4087 Google Scholar
E. González-González, H. Ra, R. Spitler, R. P. Hickerson, C. H. Contag, and R. L. Kaspar,
“Increased interstitial pressure improves nucleic acid delivery to skin enabling a comparative analysis of constitutive promoters,”
Gene Ther., 0969-7128 Google Scholar
L. K. Wong, M. J. Mandella, G. S. Kino, and T. D. Wang,
“Improved rejection of multiply scattered photons in confocal microscopy using dual-axes architecture,”
Opt. Lett., 32 1674
–1676
(2007). https://doi.org/10.1364/OL.32.001674 0146-9592 Google Scholar
J. Liu, M. J. Mandella, J. Crawford, C. H. Contag, T. D. Wang, and G. S. Kino,
“Efficient rejection of scattered light enables deep optical sectioning in turbid media with low-numerical-aperture optics in a dual-axis confocal architecture,”
J. Biomed. Opt., 13 034020
(2008). https://doi.org/10.1117/1.2939428 1083-3668 Google Scholar
S. A. Leachman, R. P. Hickerson, P. R. Hull, F. J. D. Smith, L. M. Milstone, E. B. Lane, S. J. Bale, D. R. Roop, W. H. I. McLean, and R. L. Kaspar,
“Therapeutic siRNAs for dominant genetic skin disorders including pachyonychia congenita,”
J. Dermatol. Sci., 51 151
–157
(2008). https://doi.org/10.1016/j.jdermsci.2008.04.003 0923-1811 Google Scholar
R. P. Hickerson, F. J. D. Smith, R. E. Reeves, C. H. Contag, D. Leake, S. A. Leachman, L. M. Milstone, W. H. I. McLean, and R. L. Kaspar,
“Single-nucleotide-specific siRNA targeting in a dominant-negative skin model,”
J. Invest. Dermatol., 128 594
–605
(2008). 0022-202X Google Scholar
U. R. Hengge,
“Gene therapy progress and prospects: the skin—easily accessible, but still far away,”
Gene Ther., 13 1555
–1563
(2006). https://doi.org/10.1038/sj.gt.3302855 0969-7128 Google Scholar
S. A. Leachman, R. P. Hickerson, M. E. Schwartz, E. E. Bullough, S. L. Hutcherson, K. M. Boucher, C. D. Hansen, M. J. Eliason, G. S. Srivatsa, D. J. Kornbrust, F. J. Smith, W. I. McLean, L. M. Milstone, and R. L. Kaspar,
“First-in-human mutation-targeted siRNA phase Ib trial of an inherited skin disorder,”
Mol. Ther., 18 442
–446
(2010). https://doi.org/10.1038/mt.2009.273 Google Scholar
E. González-González, H. Ra, R. P. Hickerson, Q. Wang, W. Piyawattanametha, M. J. Mandella, G. S. Kino, D. Leake, A. Avilion, O. Solgaard, T. Doyle, C. H. Contag, and R. L. Kaspar,
“siRNA silencing of keratinocyte-specific GFP expression in a transgenic mouse skin model,”
Gene Ther., 16 963
–972
(2009). https://doi.org/10.1038/gt.2009.62 0969-7128 Google Scholar
T. D. Wang, M. J. Mandella, C. H. Contag, and G. S. Kino,
“Dual-axis confocal microscope for high-resolution in vivo imaging,”
Opt. Lett., 28 414
–416
(2003). https://doi.org/10.1364/OL.28.000414 0146-9592 Google Scholar
H. Ra, W. Piyawattanametha, Y. Taguchi, D. Lee, M. J. Mandella, and O. Solgaard,
“Two-dimensional MEMS scanner for dual-axes confocal microscopy,”
J. Microelectromech. Syst., 16 969
–976
(2007). https://doi.org/10.1109/JMEMS.2007.892900 1057-7157 Google Scholar
N. Bianchi, D. Depianto, K. McGowan, C. Gu, and P. A. Coulombe,
“Exploiting the keratin 17 gene promoter to visualize live cells in epithelial appendages of mice,”
Mol. Cell. Biol., 25 7249
–7259
(2005). https://doi.org/10.1128/MCB.25.16.7249-7259.2005 0270-7306 Google Scholar
A. M. Loening and S. S. Gambhir,
“AMIDE: a free software tool for multimodality medical image analysis,”
Mol. Imaging, 2 131
–137
(2003). https://doi.org/10.1162/153535003322556877 1535-3508 Google Scholar
|


CITATIONS
Cited by 13 scholarly publications and 1 patent.
Skin
Microscopes
Green fluorescent protein
In vivo imaging
Confocal microscopy
3D image processing
Mouse models


