
|
|
1.IntroductionHematopoietic stem cells (HSCs) are characterized by the ability to self-renew, differentiate into various lineage-committed cells, and sustain hematopoiesis over the lifetime of an animal.1 In the stem cell research discipline, accuracy in characterizing HSCs or other kinds of stem cells is a primary goal and has immense implications on experiment analysis and interpretations. Traditionally, isolation of human hematopoietic stem cells for therapeutic and research purposes is based mainly on expression of cell surface markers such as CD34.2, 3, 4 However, both subsets of human and cells have demonstrated long-term repopulation ability in vivo.5, 6, 7 Moreover, the expression of CD34 appeared to be reversible (from to ) in murine and human cells.8, 9 The heterogeneity of cell phenotypes possessing repopulating potential,6, 7, 10, 11 the variability of cell surface markers between species, and the dissociation of cell phenotype and reconstituting capacity impose difficulties in identification of the primitive bone marrow stem cells.12, 13 The alternative approach to isolation of the bone marrow-derived stem cell subset is based on the functional and physical properties of the cells.11, 14, 15 There are several common assays to evaluate stem cell capabilities for self-renewal and differentiation following stem cell isolation—repopulation in in vivo experiments in mice, xenogeneic transplantation using severe combined immunodeficient mice for identifying human engrafting cells,16 long-term culture initiating cell (LTC-IC) assay for quantification of long-term culture initiating cells,17 myeloid-lymphoid initiation cell assay for assessment of multipotent of human progenitors, etc.18 All these methods for identification, verification, and quantification of HSCs as described before are complicated, time consuming, expensive, and demand highly skilled manpower. Thus, there is need for a simple biochemical method that can identify and quantify stem cells with a high degree of certainty for research and clinical use. Over the last decade, Fourier transform infrared (FTIR) spectroscopy has been established as a simple and rapid clinical diagnostic method, since it offers important clues regarding changes in macromolecules, such as lipids, proteins, carbohydrates and nucleic acids, in a sample.19 Each cell type can be recognized based on its individual spectral signature, which is derived from its characteristic biochemical composition and structure. In the present research, we investigated the biochemical characteristics of HSCs using FTIR spectral analysis. In addition, we evaluated its applicability for quantifying HSCs in bone marrow (BM) following isolation according to a novel approach based on HSC functional and physical properties (the smallest population of murine nucleated bone marrow cells ). 2.Materials and Methods2.1.AnimalsMice used in this study were C57BL/6J and B.6SJL/Boy strains purchased from Jackson Laboratory (Bar Harbor, Maine). All experimental animals were housed in a conventional clean facility using barrier mouse housing facilities [Tecniplast (Exton, Pennsylvania) individually ventilated chambers], and given ad-libitum access to autoclaved mouse chow and acidified water. 2.2.Isolation of CellsWhole bone marrow cells were harvested by flushing medullar cavities of femurs, tibias, and iliac bones. Single cell suspensions of wBMC from ten mice were loaded into the chamber of a counterflow centrifuge (Beckman Instruments, Palo Alto, California) at a flow rate of with a constant rotor speed of at RT. The smallest subset of nucleated cells (Fr25) were collected at a rate of in . Lineage-positive cells, including T and B lymphocytes, macrophages, granulocytes, and erythroid cells, were immunomagnetically depleted. The Fr25 cells were incubated for at with rat antimouse monoclonal antibodies (mAb) against GR-1 (RB6-8C5), Mac-1 (M1/70), B220 (RA3-3A1/6.1), and CD-5 (53-7.3) extracted from hybridoma cell lines (ATCC, Rockville, Maryland), and purified Ter-119 (eBioscience Incorporated, San Diego, California). Antibody-coated cells were incubated with sheep antirat magnetic beads ( cells) (Dynal Biotech ASA, Oslo, Norway) at for . Rosetted cells were precipitated by exposure to a magnetic field, and the supernatant containing lineage-negative cells was collected. The isolated cells were evaluated for viability by the trypan blue exclusion test and evaluated for size characteristics and expression of hematopoietic lineage markers using a Vantage SE flow cytometer (Becton Dickinson, Franklin Lakes, New Jersey). 2.3.Fourier Transform Infrared Microscopy Measurements and Data Analysisof packed cells were deposited on a zinc selenide (ZnSe) slide to form an approximate monolayer of cells, and then air dried for under laminar flow to remove water. Measurements of selected microscopic sites with an aperture of and similar ADC rates were performed using the FTIR microscope IR scope 2 (Bruker Optik GmbH, Ettlingen, Germany) in transmission mode as described previously.20 FTIR microscopy (MSP) was chosen as a favorable methodology for this study, since other systems such as FTIR-attended total reflectance (ATR) which can measure cells in their native culture media, are limited in their sensitivity due to water interference, restricted penetration depth of the evanescent waves into the sample (about ), and higher contribution from scattering effects compared to FTIR-MSP.21 The spectra were baseline corrected using a polynomial rubber band with 64 points (OPUS software Bruker Optik GmbH, Ettlingen, Germany) and were vector normalized in the region or min-max normalized in the region of . To obtain precise absorbance values at a given wave number with minimal background interference, the second derivative spectra were used to determine intensities of the biomolecules of interest. The second derivative method is highly susceptible to changes in full width at half maximum (FWHM) of the IR bands. However, in the case of biological samples, all cells from the same type are composed of similar basic components, which give relatively broad bands. Thus, there is a possibility of neglecting the changes in the band FWHM.22 2.4.StatisticsData are presented as the error (SEM) derived from at least three independent experiments. Statistical analysis was performed using the student t-test. -values were considered significant. Linear regressions were done by the least-squares method, and the data analysis package (Origin, Micro-Cal, Incorporated, Northampton, Massachusetts) was used when comparing a series of datasets. Data reduction by principal component analysis (PCA) was implemented as previously described.23 3.Results3.1.Characterization of Hematopoietic Stem Cells by Flow CytometryTo obtain fractions of bone marrow cells enriched in primitive stem cells, we adopted a technique of counterflow centrifugal elutriation.24 The elutriated fraction collected at a flow rate of was immunomagnetically depleted of cells expressing hematopoietic lineage markers using monoclonal antibodies against granulocytes, macrophages, T and B lymphocytes, and erythroid cell-specific antigens. The size characteristics of wBMC and cells as determined by flow cytometric analysis of side and forward scatter parameters are demonstrated in Fig. 1 . cells represented the smallest fraction of the unfractionated wBMC population. Bone marrow is a heterogeneous population containing both hematopoietic and nonhematopoietic cells. To evaluate the hematopoietic contents of the subset, expression of the pan-hematopoietic marker CD45 was examined and compared to whole BMC. Both BMC and cells were composed of a major hematopoietic population (96 and 81%, respectively). Fig. 1Evaluation of cell size and expression of hematopoietic markers in wBMC and Fr25lin- cells. Whole bone marrow (wBMC) and elutriated lineage-depleted Fr25 (Fr25lin-) cells were stained with a cocktail of monoclonal antibodies against hematopoietic lineage markers (GR-1, Mac-1, B220, Ter-119, and CD5) and CD45.  3.2.Fourier Transform Infrared Microscopy Analysis of Hematopoietic Stem CellsBiochemical analysis of extracted HSCs and comparison to wBMC was conducted using FTIR-MSP. FTIR-MSP spectra of wBMC and HSCs in the regions and after baseline correction and min-max normalization to amide II are shown in Fig. 2 . The spectra exhibits significant differences between wBMC cells and HSCs at several wave numbers; each corresponds to specific functional groups related to fundamental cellular components such as lipids, proteins, and carbohydrates/nucleic acids. Fig. 2Fourier transform infrared (FTIR) spectra of bone marrow (BM) cells and hematopoietic stem cells (HSCs). (a) Representative FTIR spectra exhibit significant differences between BM cells and HSCs after baseline correction and amide-II normalization. Each spectrum represents the average of five measurements at different sites for each sample. The main absorbance bands are marked. (b) Second derivative extended spectra of BM cells and HSCs after baseline correction and vector normalization. 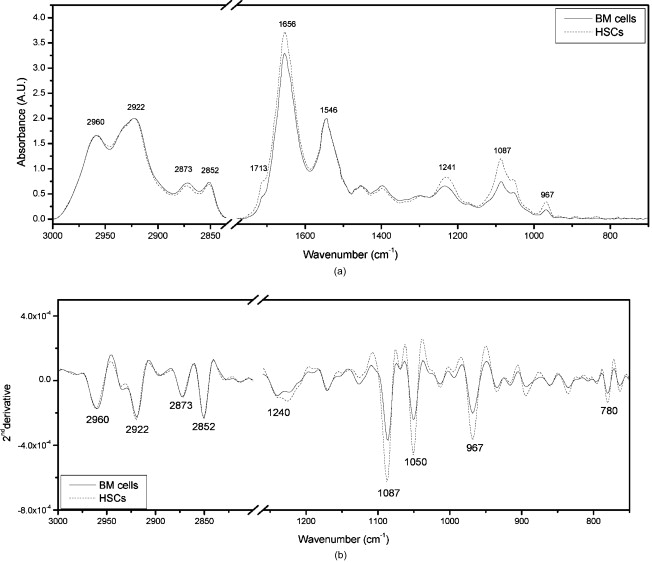 The region contains absorbance bands due to symmetric and asymmetric and stretching vibrations related mainly to proteins and lipids, respectively.25 The absorbance ratio of methylene to methyl bands quantified by the bands integrated absorbance at 2960 and divided by 2922 and was higher for the HSCs than for BM . Although the parameter of lipids/proteins is significant for characterizing HSCs, the difference between HSCs and BM cells is quite small, thus, there is a need for a better biochemical parameter. The phosphate bond absorption at (asymmetric vibration) and (symmetric vibration) is more prominent in the HSCs spectra than in the wBMC spectra, as presented in Figs. 2 and 2. These bands are related mainly to nucleic acids and carbohydrates.25, 26 Another band that is more prominent in HSCs is located at and corresponds to C–C/C–O stretching of deoxyribose-ribose skeletal vibration of the DNA.27 3.3.Principal Component Analysis and Statistical Analysis of Fourier Transform Infrared Microscopy SpectraTo determine the main spectral characteristics of HSCs and BM cells, unbiased PCA analysis was conducted. The FTIR-MSP spectra are composed of 286 vector components corresponding to absorbance intensities. PCA analysis reduces the number of variables to six principle components (PCs).24 The best separation between HSC and BM cell spectra was achieved by PC4 versus PC1, as presented in Fig. 3 . PC1 adequately separates between the two groups of cells, while PC4 provides the heterogeneity of each one of the individual groups. According to PC4, HSCs have less heterogeneity than the total BM cell population. The loading of each PC reveals the main vibrational bands for distinction between HSCs and BM cell spectra [Fig. 3]. As observed in Fig. 3, there are several major bands contained in the PC1 loadings such as 966, 1088, and , which correspond to nucleic acids/carbohydrates, and the band, which corresponds to untiparallel -sheets of proteins and to stretching vibrations that are hydrogen bonded.25 PC4 loadings show a different set of bands [Fig. 3] as expected. The later contributes mainly to the heterogeneity of both HSCs and BM cells. Fig. 3Statistical analysis of FTIR-MSP spectra. (a) PCA was employed on FTIR-MSP spectra composed of 286 vector components, reducing it to six PCs, which describe 98.1% of the data variance. PC4 versus PC1 was found to give the best separation between HSCs and BM cell spectra. (b) Absolute loading values of PC1 and PC4 in the region . (c) The absorbance bands at 781, 966, and , which are mainly related to DNA, are more prominent in the HSCs spectra than in the BM spectra. Values plotted are the means ±SEM derived from at least three independent experiments. .  The bands that give the finest distinction according to the PCA analysis correspond mostly to the DNA. A student t-test was employed to determine the ability of these bands to serve as markers for identifying HSCs in the BM using FTIR-MSP, as presented in Fig. 3. To verify that these biomarkers correspond to DNA, an additional characteristic band of DNA at was also tested and was found to be appropriate for characterizing HSCs [Figure 3].27 3.4.Quantification of Hematopoietic Stem Cells by Fourier Transform Infrared MicroscopyTo evaluate the utility of FTIR for quantifying the number of HSCs from wBMC (which also contain of HSCs)11 based on the characteristic biomarkers of HSCs, we aimed to determine the minimal detectable percentage of HSCs in the BM. For this goal, HSCs were diluted with BM in decreasing percentages and measured by FTIR. Several wave numbers (1088, 966, and ), which were found to be the most significant markers to characterize HSCs, were used in determining the maximal sensitivity of FTIR for HSCs quantification. Figure 4 shows the characteristic spectra obtained with different concentrations of HSCs diluted in BM cells, and a correlation curve between HSC percentages in the BM and the respective absorbance at [Fig. 4]. To evaluate the utility of quantifying HSCs in the BM, we calculated a linear regression curve for each single experiment, excluding errors due to the complicated cell extraction procedure. A good correlation was achieved . Using this spectral parameter, we were able to differentiate between samples diluted up to approximately 0.1% HSCs compared with pure BM samples. However, due to the complexity of this experiment, the exact sensitivity and accuracy limits of FTIR-MSP in detection of HSCs in BM should be further investigated. Fig. 4Quantification of HSCs in whole BM cell populations by FTIR-MSP. Isolated HSCs were diluted (from 0 to 100% HSCs) in whole BM cell population. (a) Second derivative extended representative spectra of HSCs and BM cells after baseline correction and vector normalization. (b) A linear correlation between the absorbance band of the DNA at and the percentage of HSCs in BM cell population. Values plotted are the means ±SEM derived from at least three independent experiments. 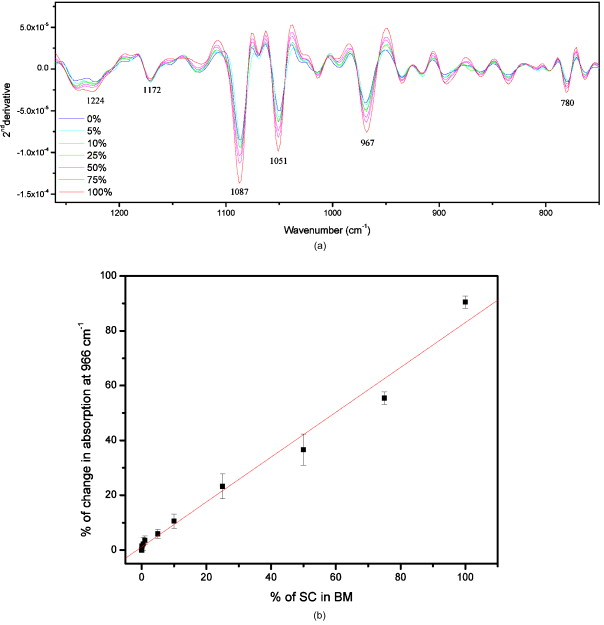 4.DiscussionIn the present study, we demonstrated the utility of FTIR spectroscopy for distinguishing HSCs from other BM cells according to differences in structure and quantity of several major biomolecules such as lipids, nucleic acids, and carbohydrates (Figs. 2 and 3). Based on these characteristic biochemical features of HSCs, we present FTIR as a practical tool for detection of HSCs in the BM (Fig. 4) for clinical and research applications. Isolation of HSCs, as performed in this study, is based on multiple characteristics of the stem cells. Using physiological features of the cells, such as size and granularity, we separated the smallest population of nucleated bone marrow cells. The next step of the isolation procedure relies on the exclusion of cells expressing characteristic lineage CDs rather than searching for CDs characterizing the HSCs themselves, as used in the common methods. As presented in Fig. 1, the isolated stem cell subset was characterized by their small size and primarily comprises the hematopoietic cells that did not express lineage markers. This cell population was previously shown to repopulate the hematopoietic system of myeloablative mice in the long term.24 Earlier FTIR spectroscopy studies on various types of stem cells reported a higher absorbance of nucleic acids in comparison to mature cells.28, 29 On the contrary, other groups reported an opposite trend of nucleic acid absorbance when immature leukemic cell lines were treated with all-transretinoic acid to promote differentiation.30 These findings indicate a unique chromatin structure of stem cells related to their fundamental biological function. Changes in chromatin structure are an important factor responsible for stem cell self-renewal, differentiation capability, and other functions associated with gene expression. Thus, the fate of a stem cell and the entire hematopoietic lineage is determined by chromatin remodeling.31, 32, 33 DNA enzymes can influence HSC chromatin structure and histone modifications. For instance, the activity of DNA methyltransferase is known to be essential for HSCs self-renewal.34 Recent research revealed that inhibition of histone deacetylase, which is responsible for “open” or “rigid” chromatin structure, enhances proliferation and self-renewal of HSCs.35 Chromatin structure is also affected by transcription activity, which is assumed to be elevated following an increase of mRNA found in HSCs.36 An increase in mRNA of embryonic stem cells following differentiation was found by Raman spectroscopy analysis, which indicates high transcription activity for stem cells.37, 38 In our results we did not find a significant difference between the absorption bands related to RNA in the spectra of HSCs and BM cells. Thus, it might indicate high mRNA levels of cells in both BM and HSCs. However, additional study is needed to confirm this issue using other standard biochemical methods. The higher DNA absorbance in HSCs in comparison to BM cells, as revealed in our study, can imply abnormal cell cycle activity.39 However, it is well known that most of the HSCs in the BM remain quiescent and only a limited number enter the cell cycle, thus they are unlikely to affect the FTIR spectra.40 Other possible sources for this increase in IR “visible” DNA structure might designate less tight DNA conformation,41 which can point for a highly and unique transcription activity of the HSCs, although most of them are in their quiescence state.15, 42, 43 Thus, our results support the other findings, which indicted a unique chromatin conformation in HSCs.31, 32, 33 Additional absorption bands characteristic to HSCs over other BM cells are , which correspond to total cellular lipids. Phospholipids, proteins, and other plasma membrane components participate in all cellular functions. HSCs can be recognized by specific glycoproteins (CDs) present on their membranes’ surface, which affects plasma membrane characteristics. One such glycoprotein, for instance, is CD133 (Prominin-1), which is a common marker for HSCs as well as other SCs and cancer cells.44, 45 CD133 interacts with membrane cholesterol and is specific to cholesterol in membrane rafts. It is also assumed to affect membrane lipid composition and organization.46 All these facts indicate an exclusive membrane composition and structure of HSCs, as confirmed by our results from FTIR spectral analysis. The higher ratio in HSCs relative to BM cells presented in this study was found by our group to indicate leukemia and other malignancies.47 Thus we point out here a possible similarity between stemness and malignancy, which demands further study on membrane structure and composition. In addition to the ability to characterize HSCs, FTIR can also be used for quantification of HSCs in the BM according to the individual biochemical profile as revealed earlier. The DNA spectral region was found by advanced, unbiased PCA statistical analysis (Fig. 3) as the most profound region suitable for basic quantification and achieved satisfying sensitivity. Our analysis indicates that one HSC per thousand BM cells can be identified (Fig. 4). Similar analysis was also carried out for the unique DNA absorbance band at and gave similar results (data not shown). Thus, we suggest FTIR as a simple method for characterization of stem cells from the biochemistry level using a small amount of dried intact cells, in addition to the opportunity of quantification of stem cells in a sample (after calibration with 100% stem cells of the desired type). This test can be implemented as a supplementary tool to present existing standard methodologies for stem cell analysis for research and medical applications. 5.ConclusionsFTIR spectroscopy can supply valuable information regarding the unique biochemical composition and structure of HSCs. These spectral patterns of lipids, nucleic acids, and carbohydrates can arise from the HSC function in comparison to other cells in the BM. Furthermore, we show here a possible practical use of FTIR for identifying and quantifying HSCs in the BM prior to, or following, cell isolation, thus verifying the purity of cell extraction. Still, further research on other cell types in the hematopoietic lineage is needed to learn more about hematopoiesis from the biochemical viewpoint, and expand the applications of FTIR spectroscopy in biology and medicine. AcknowledgmentsThis study was supported (in part) by grant number 3-3680 from the Chief Scientist Office of the Ministry of Health, Israel. We thank Nadir Ashkenazi, Center for Stem Cell Research, Department of Pediatric Hematology-Oncology, Schneider Children’s Medical Center, for providing the hematopoietic stem cells and the bone marrow cells. ReferencesS. J. Szilvassy,
“The biology of hematopoietic stem cells,”
Arch. Med. Res., 34 446
–460
(2003). https://doi.org/10.1016/j.arcmed.2003.06.004 0188-0128 Google Scholar
C. I. Civin, L. C. Strauss, C. Brovall, M. J. Fackler, J. F. Schwartz, and J. H. Shaper,
“Antigenic analysis of hematopoiesis. III. A hematopoietic progenitor cell surface antigen defined by a monoclonal antibody raised against KG-1a cells,”
J. Immunol., 133 157
–165
(1984). 0022-1767 Google Scholar
R. J. Berenson, W. I. Bensinger, R. S. Hill, M. J. Fackler, J. F. Schwartz, and J. H. Shaper,
“Engraftment after infusion of CD34+ marrow cells in patients with breast cancer or neuroblastoma,”
Blood, 77 1717
–1722
(1991). 0006-4971 Google Scholar
H. Link, L. Arseniev, O. Bähre, J. G. Kadar, H. Diedrich, and H. Poliwoda,
“Transplantation of allogeneic CD34+ blood cells,”
Blood, 87 4903
–4909
(1996). 0006-4971 Google Scholar
R. J. Berenson, R. G. Andrews, W. I. Bensinger, D. Kalamasz, G. Knitter, C. D. Buckner, and I. D. Bernstein,
“Antigen CD34+ marrow cells engraft lethally irradiated baboons,”
J. Clin. Invest., 81 951
–955
(1988). https://doi.org/10.1172/JCI113409 0021-9738 Google Scholar
M. Bhatia, J. C. Wang, U. Kapp, D. Bonnet, and J. E. Dick,
“Purification of primitive human hematopoietic cells capable of repopulating immune-deficient mice,”
Proc. Natl. Acad. Sci. U.S.A., 94 5320
–5325
(1997). https://doi.org/10.1073/pnas.94.10.5320 0027-8424 Google Scholar
M. Osawa, K. Hanada, H. Hamada, and H. Nakauchi,
“Long-term lymphohematopoietic reconstitution by a single CD34-low/negative hematopoietic stem cell,”
Science, 273 242
–245
(1996). https://doi.org/10.1126/science.273.5272.242 0036-8075 Google Scholar
T. Sato, J. H. Laver, and M. Ogawa,
“Reversible expression of CD34 by murine hematopoietic stem cells,”
Blood, 94 2548
–2554
(1999). 0006-4971 Google Scholar
E. D. Zanjani, G. Almeida-Porada, A. G. Livigston, H. Zeng, and M. Ogawa,
“Reversible expression of CD34 by adult human bone marrow long-term engrafting hematopoietic stem cells,”
Exp. Hematol., 31 406
–412
(2003). https://doi.org/10.1016/S0301-472X(03)00051-1 0301-472X Google Scholar
K. Ikuta and I. L. Weissman,
“Evidence that hematopoietic stem cells express mouse c-kit but do not depend on steel factor for their generation,”
Proc. Natl. Acad. Sci. U.S.A., 89 1502
–1506
(1992). https://doi.org/10.1073/pnas.89.4.1502 0027-8424 Google Scholar
R. J. Jones, M. I. Collector, J. P. Barber, M. S. Vala, M. J. Fackler, W. S. May, C. A. Griffin, A. L. Hawkins, B. A. Zehnbauer, J. Hilton, O. M. Colvin, and S. J. Sharkis,
“Characterization of mouse lymphohematopoietic stem cells lacking spleen colony-forming activity,”
Blood, 88 487
–491
(1996). 0006-4971 Google Scholar
C. Dorrell, O. I. Gan, D. S. Pereira, R. G. Hawley, and J. E. Dick,
“Expansion of human cord blood CD34(+)CD38(−) cells in ex vivo culture during retroviral transduction without a corresponding increase in SCID repopulating cell (SRC) frequency: dissociation of SRC phenotype and function,”
Blood, 95 102
–110
(2000). 0006-4971 Google Scholar
G. J. Dooner, G. A. Colvin, M. S. Dooner, K. W. Johnson, and P. J. Quesenberry,
“Gene expression fluctuations in murine hematopoietic stem cells with cell cycle progression,”
J. Cell Physiol., 214 786
–795
(2008). https://doi.org/10.1002/jcp.21273 0021-9541 Google Scholar
S. M. Lanzkron, M. I. Collector, and S. J. Sharkis,
“Homing of long-term and short-term engrafting cells in vivo,”
Ann. N.Y. Acad. Sci., 872 48
–54
(1999). https://doi.org/10.1111/j.1749-6632.1999.tb08452.x 0077-8923 Google Scholar
S. M. Lanzkron, M. I. Collector, and S. J. Sharkis,
“Hematopoietic stem cell tracking in vivo: a comparison of short-term and long-term repopulating cells,”
Blood, 93 1916
–1921
(1999). 0006-4971 Google Scholar
T. A. Bock, D. Orlic, C. E. Dunbar, H. E. Broxmeyer, and D. M. Bodine,
“Improved engraftment of human hematopoietic cells in severe combined immunodeficient (SCID) mice carrying human cytokine transgenes,”
J. Exp. Med., 182 2037
–2043
(1995). https://doi.org/10.1084/jem.182.6.2037 0022-1007 Google Scholar
A. L. Petzer, P. W. Zandstra, J. M. Piret, and C. J. Eaves,
“Differential cytokine effects on primitive (CD34+CD38−) human hematopoietic cells: novel responses to Flt3-ligand and thrombopoietin,”
J. Exp. Med., 183 2551
–2558
(1996). https://doi.org/10.1084/jem.183.6.2551 0022-1007 Google Scholar
M. Punzel, S. D. Wissink, J. S. Miller, K. A. Moore, I. R. Lemischka, and C. M. Verfaillie,
“The myeloid-lymphoid initiating cell (ML-IC) assay assesses the fate of multipotent human progenitors in vitro,”
Blood, 93 3750
–3756
(1999). 0006-4971 Google Scholar
M. Diem, P. Griffiths, and J. Chalmers, Vibrational Spectroscopy for Medical Diagnosis, John Wiley and Sons, New York
(2008). Google Scholar
E. Bogomolny, S. Argov, S. Mordechai, and M. Huleihel,
“Monitoring of viral cancer progression using FTIR microscopy: a comparative study of intact cells and tissues,”
Biochim. Biophys. Acta, 1780 1038
–1046
(2008). 0006-3002 Google Scholar
Z. Hammody, R. K. Sahu, S. Mordechai, E. Cagnano, and S. Argov,
“Characterization of malignant melanoma using vibrational spectroscopy,”
Sci. World J., 5 173
–182
(2005). Google Scholar
N. Toyran, P. Lasch, D. Naumann, B. Turan, and F. Severcan,
“Early alterations in myocardia and vessels of the diabetic rat heart: an FTIR microspectroscopic study,”
Biochem. J., 397 427
–436
(2006). https://doi.org/10.1042/BJ20060171 0264-6021 Google Scholar
A. Zwielly, J. Gopas, G. Brkic, and S. Mordechai,
“Discrimination between drug-resistant and non-resistant human melanoma cell lines by FTIR spectroscopy,”
Analyst, 134 294
–300
(2009). https://doi.org/10.1039/b805223a 0003-2654 Google Scholar
R. J. Jones, J. E. Wagner, P. Celano, M. S. Zicha, and S. J. Sharkis,
“Separation of pluripotent haematopoietic stem cells from spleen colony-forming cells,”
Nature, 347 188
–189
(1990). https://doi.org/10.1038/347188a0 0028-0836 Google Scholar
H. Mantsch and D. Chapman, Infrared Spectroscopy of Biomolecules, John Wiley and Sons, New York
(1996). Google Scholar
S. Wartewig, IR and Raman Spectroscopy, 1
–175 John Wiley and Sons, New York
(2003). Google Scholar
M. Diem, M. Romeo, S. Boydston-White, M. Miljkovic, and C. Matthaus,
“A decade of vibrational micro-spectroscopy of human cells and tissue (1994–2004),”
Analyst, 129 880
–885
(2004). https://doi.org/10.1039/b408952a 0003-2654 Google Scholar
M. J. German, H. M. Pollock, B. Zhao, M. J. Tobin, A. Hammiche, A. Bentley, L. J. Cooper, F. L. Martin, and N. J. Fullwood,
“Characterization of putative stem cell populations in the cornea using synchrotron infrared microspectroscopy,”
Invest. Ophthalmol. Visual Sci., 47 2417
–2421
(2006). https://doi.org/10.1167/iovs.05-1254 0146-0404 Google Scholar
M. J. Walsh, T. G. Fellous, A. Hammiche, W. R. Lin, N. J. Fullwood, O. Grude, F. Bahrami, J. M. Nicholson, M. Cotte, J. Susini, H. M. Pollock, M. Brittan, P. L. Martin-Hirsch, M. R. Alison, and F. L. Martin,
“Fourier transform infrared microspectroscopy identifies symmetric PO(2)(-) modifications as a marker of the putative stem cell region of human intestinal crypts,”
Stem Cells, 26 108
–118
(2008). https://doi.org/10.1634/stemcells.2007-0196 1066-5099 Google Scholar
M. J. Liu, Z. Wang, R. C. Wu, S. Q. Sun, and Q. Y. Wu,
“Monitoring all-transretinoic acid-induced differentiation of human acute promyelocytic leukemia NB4 cells by Fourier-transform infrared spectroscopy,”
Leukemia, 17 1670
–1674
(2003). https://doi.org/10.1038/sj.leu.2403019 0887-6924 Google Scholar
J. Cerny and P. J. Quesenberry,
“Chromatin remodeling and stem cell theory of relativity,”
J. Cell Physiol., 201 1
–16
(2004). https://doi.org/10.1002/jcp.20071 0021-9541 Google Scholar
H. Araki, K. Yoshinaga, P. Boccuni, Y. Zhao, R. Hoffman, and N. Mahmud,
“Chromatin-modifying agents permit human hematopoietic stem cells to undergo multiple cell divisions while retaining their repopulating potential,”
Blood, 109 3570
–3578
(2007). https://doi.org/10.1182/blood-2006-07-035287 0006-4971 Google Scholar
K. Georgopoulos,
“Haematopoietic cell-fate decisions, chromatin regulation and ikaros,”
Nat. Rev. Immun., 2 162
–174
(2002). https://doi.org/10.1038/nri747 1474-1733 Google Scholar
Y. Tadokoro, H. Ema, M. Okano, E. Li, and H. Nakauchi,
“De novo DNA methyltransferase is essential for self-renewal, but not for differentiation, in hematopoietic stem cells,”
J. Exp. Med., 204 715
–722
(2007). https://doi.org/10.1084/jem.20060750 0022-1007 Google Scholar
G. Bug, H. Gül, K. Schwarz, H. Pfeifer, M. Kampfmann, X. Zheng, T. Beissert, S. Boehrer, D. Hoelzer, O. G. Ottmann, and M. Ruthardt,
“Valproic acid stimulates proliferation and self-renewal of hematopoietic stem cells,”
Cancer Res., 65 2537
–2541
(2005). https://doi.org/10.1158/0008-5472.CAN-04-3011 0008-5472 Google Scholar
R. Manfredini, R. Zini, S. Salati, M. Siena, E. Tenedini, E. Tagliafico, M. Montanari, T. Zanocco-Marani, C. Gemelli, T. Vignudelli, A. Grande, M. Fogli, L. Rossi, M. E. Fagioli, L. Catani, R. M. Lemoli, and S. Ferrari,
“The kinetic status of hematopoietic stem cell subpopulations underlies a differential expression of genes involved in self-renewal, commitment, and engraftment,”
Stem Cells, 23 496
–506
(2005). https://doi.org/10.1634/stemcells.2004-0265 1066-5099 Google Scholar
I. Notingher, I. Bisson, A. E. Bishop, W. L. Randle, J. M. Polak, and L. L. Hench,
“In situ spectral monitoring of mRNA translation in embryonic stem cells during differentiation in vitro,”
Anal. Chem., 76 3185
–3193
(2004). https://doi.org/10.1021/ac0498720 0003-2700 Google Scholar
J. W. Chan, D. S. Taylor, S. M. Lane, T. Zwerdling, J. Tuscano, and T. Huser,
“Nondestructive identification of individual leukemia cells by laser trapping Raman spectroscopy,”
Anal. Chem., 80 2180
–2187
(2008). https://doi.org/10.1021/ac7022348 0003-2700 Google Scholar
S. Boydston-White, T. Gopen, S. Houser, J. Bargonetti, and M. Diem,
“Infrared spectroscopy of human tissue. V. Infrared spectroscopic studies of myeloid leukemia (ML-1) cells at different phases of the cell cycle,”
Biospectroscopy, 5 219
–227
(1999). https://doi.org/10.1002/(SICI)1520-6343(1999)5:4<219::AID-BSPY2>3.0.CO;2-O 1075-4261 Google Scholar
R. Pelayo, K. Miyazaki, J. Huang, K. P. Garrett, D. G. Osmond, and P. W. Kincade,
“Cell cycle quiescence of early lymphoid progenitors in adult bone marrow,”
Stem Cells, 24 2703
–2713
(2006). https://doi.org/10.1634/stemcells.2006-0217 1066-5099 Google Scholar
M. Diem, S. Boydston-White, and L. Chiriboga,
“Infrared spectroscopy of cells and tissues. Shining light onto a novel subject,”
Appl. Spectrosc., 53 148A
–161A
(1999). https://doi.org/10.1366/0003702991946712 0003-7028 Google Scholar
E. Passegué, A. J. Wagers, S. Giuriato, W. C. Anderson, and I. L. Weissman,
“Global analysis of proliferation and cell cycle gene expression in the regulation of hematopoietic stem and progenitor cell fates,”
J. Exp. Med., 202 1599
–1611
(2005). https://doi.org/10.1084/jem.20050967 0022-1007 Google Scholar
S. H. Cheshier, S. J. Morrison, X. Liao, and I. L. Weissman,
“In vivo proliferation and cell cycle kinetics of long-term self-renewing hematopoietic stem cells,”
Proc. Natl. Acad. Sci. U.S.A., 96 3120
–3125
(1999). https://doi.org/10.1073/pnas.96.6.3120 0027-8424 Google Scholar
S. V. Shmelkov, R. St. Clair, D. Lyden, and S. Rafii,
“AC133/CD133/Prominin-1,”
Int. J. Biochem. Cell Biol., 37 715
–719
(2005). https://doi.org/10.1016/j.biocel.2004.08.010 1357-2725 Google Scholar
S. V. Shmelkov, J. M. Butler, A. T. Hooper, A. Hormigo, J. Kushner, T. Milde, R. St Clair, M. Baljevic, I. White, D. K. Jin, A. Chadburn, A. J. Murphy, D. M. Valenzuela, N. W. Gale, G. Thurston, G. D. Yancopoulos, M. D’Angelica, N. Kemeny, D. Lyden, and S. Rafii,
“CD133 expression is not restricted to stem cells, and both CD133+ and CD133− metastatic colon cancer cells initiate tumors,”
J. Clin. Invest., 118 2111
–2120
(2008). 0021-9738 Google Scholar
D. Corbeil, K. Röper, C. A. Fargeas, A. Joester, and W. B. Huttner,
“Prominin: a story of cholesterol, plasma membrane protrusions and human pathology,”
Traffic (Oxford, U. K.), 2 82
–91
(2001). https://doi.org/10.1034/j.1600-0854.2001.020202.x 1398-9219 Google Scholar
R. K. Sahu, S. Argov, A. Salman, U. Zelig, M. Huleihel, N. Grossman, J. Gopas, J. Kapelushnik, and S. Mordechai,
“Can Fourier transform infrared spectroscopy at higher wavenumbers (mid IR) shed light on biomarkers for carcinogenesis in tissues?,”
J. Biomed. Opt., 10 054017
(2005). https://doi.org/10.1117/1.2080368 1083-3668 Google Scholar
|


