|
|
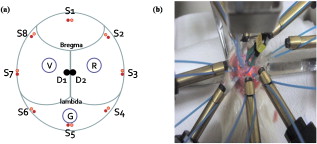
1.IntroductionNeuroscience has benefited greatly from recent advances in genetic engineering. Transgenic mice, such as knock-out, knock-in, and knock-down mice, can be used to produce animal models of neuropathological human and animal diseases and contribute greatly to our understanding of their basic cellular and molecular pathways.1 The use of transgenic mice has untangled various complicated phenomena occurring in the brain, which is the most complex system in nature. Innovative neuroimaging techniques employed in studies of mouse brain have accelerated neuroscientific knowledge by enabling visualization from the cellular level to the network level.2 However, the small size of the mouse brain ( in volume) has been a challenge to apply current neuroimaging technology, such as functional magnetic resonance imaging (fMRI) or positron emission tomography. Near-infrared spectroscopy (NIRS), first introduced by Ref. 3, assesses oxy- and deoxyhemoglobin concentrations based on absorption spectrum of hemoglobin molecules or track the neural activation based on scattering changes. In recent years, neuroimaging based on NIRS has been successfully applied to clinical and physiological studies mostly on human brain.4, 5 Because NIRS is noninvasive and applicable to a freely moving condition, NIRS has a strong potential as a functional brain monitoring system in clinical or cognitive neuroscience research. The main assumption of applying NIRS to functional study of the brain is that the oxygen demands in the region of neural activation facilitate the oxygen supply by triggering vasodilation, resulting in an increase in oxyhemoglobin and decrease in deoxyhemoglobin.6 However, cerebral blood flows have spontaneous fluctuations; hence, it is challenging to differentiate the function-related blood flow from spontaneous blood fluctuations. Moreover, the underlying mechanism about the vasodilation with respect to dynamic metabolic requirements remains unknown. One of the approaches to study the underlying mechanism will be using an animal model under physiological or molecular manipulation. In this study, we aimed to assess the hemodynamic changing simultaneously with electrophysiological recording. To identify the highly activated state of the brain, we pharmacologically induced an epileptic state to the mouse. Epileptic events are well known to be one of the most catastrophic phenomena in the brain because a large population of neurons is depolarized in a synchronized manner. We simultaneously applied eight channels of frequency-domain NIRS and one-channel electroencephalography (EEG) to the mouse brain during pharmacologically driven seizures and focused on the hemodynamic responses, including systemic hemodynamic responses7 and rhythmical activities.8 We aimed to characterize the following issues: (i) what the systemic (long-term) hemodynamic responses to seizure events are compared to the predrug baseline, (ii) how the hemodynamics is correlated to the individual epileptic events, (iii) whether the hemodynamics in different regions of the brain are synchronized or desynchronized during seizure, and (iv) whether the out-of-phase relationship between oxy- and deoxyhemoglobin is disrupted or not during seizure. We also sought to establish a prototype for applying the NIRS technique with simultaneous electrical recording to a mouse brain. 2.Materials and Methods2.1.Animal PreparationAll mice preparation and experimental procedures followed the institutional guidelines of the Korea Institute of Science and Technology (KIST). Twelve adult female ICR mice [ , , Orientbio Inc., Seongnam, South Korea] were anesthetized with Avertin (2%, body weight) and mounted on a stereotaxic apparatus (David Kopf Instruments, Model 902, Tujunga, California). Following a midline incision, the scalp was opened and held with microclamps. For the EEG recording, two screw electrodes with an impedance of ( diam) were implanted on the skull (anterior-posterior: , lateral: with respect to the bregma point). A ground electrode was implanted on the cerebellum dorsal to the point. A small amount of dental cement (Ketac Cem Easymix, 3M ESPE Worldwide) was applied to secure the electrodes on the skull. In order to drive seizures, we administered intraperiotoneally -butyrolactone [(GBL), body weight, Sigma, St. Louis, Missouri] and 4-aminopyridine [(4-AP), body weight, Sigma] to six mice in each group. The GBL and 4-AP are two of the frequently used seizure inducing drugs for absence seizure and tonic-clonic seizure, respectively. The applied dosages of GBL and 4-AP were selected based on similar protocols used to generate seizures in other in vivo mouse studies.9 In our study, we increased administration of GBL to enhance the electrical and hemodynamic responses, and the dosage of the 4-AP was reduced because unexplained sudden deaths were observed in mice pretreated with Avertin in our preliminary tests. 2.2.NIRS SetupA two-wavelength eight-channel frequency-domain NIRS (Imagent, ISS, Champaign, Illinois) was applied to monitor the cerebral hemodynamic responses. The light sources of Imagent are modulated at high frequency of , and the modulation amplitude (AC) is provided in addition to the intensity. Each channel contains two wavelengths (690 and ), and each laser diode was turned on and off sequentially under time-based multiplexing. Two optical fibers with a core diameter and 0.39 numerical aperture (NA) (FT-400EMT, Thorlabs, Newton, New Jersey) carrying different wavelengths were carefully colocated on each source point by using a homemade manipulating arm. To collect diffuse photons, two detector fibers were tied and placed at the midpoint between the bregma and points, each of which were relayed to two photomultiplier tubes. We used two detectors to enhance the signal-to-noise ratio (SNR). Eight source optical fibers were arranged in a circle around the mouse skull, as described in Fig. 1 , and the source-detector distances were maintained at from the detector. Modulation of light, which is the ac signal in Imagent system, was collected at a sampling rate of . Phase shifts between each source-detector pair were monitored continuously during the measurement, and the channel-to-channel variance was not significant. All experiments were performed in a dark and quiet room. 2.3.EEG SetupA bipolar, one-channel EEG was used in this study. The raw signals from the skull EEG were amplified 10,000 times using an ac preamplifier (Model QP511, Grass Technologies, West Warwick, Rhode Island) and collected with a data-acquisition device (Digidata 1440A, Axon Instruments Inc., Union City, California) at a sampling rate of . Total recording time was for all cases. Additionally, to reduce ambient noise, we connected the stereotaxic frame and EEG system to a common ground. We recorded the NIRS and the EEG signals simultaneously and coregistered a marker for each signal so that direct temporal comparison would be possible. 2.4.Signal Processing of EEG DataEEG signals were bandpass filtered with a 10th-order zero-phase Butterworth filter with a cutoff frequency of 0.1 and . Epileptic episodes were identified by detecting epileptiform discharges.10 The most common epileptiform discharges induced by GBL and 4-AP are known to be spike-and-wave discharge complexes and spike train, respectively.11 In our study, other epileptiform discharges, such as polyspike or polyspike-and-slow-wave complexes, were also observed. The EEG signals with a repetitive high-amplitude activity were judged as epileptic events. To avoid the false positive, we did not count any patterns that were found in the predrug state. 2.5.Signal Processing of NIRS DataTwo detector signals were averaged to increase the SNR, and the changes of ac signal amplitudes were used in our analysis. The temporal patterns of ac and dc were almost identical, but ac has much less irregular movement compared to dc. The concentration of hemoglobin was calculated based on the modified Beer–Lambert law12 where is the optical density at and , is the ac amplitude of the transmitted light, and are the extinction coefficients for oxy- and deoxyhemoglobin molecules at each wavelength, respectively, and is the differential pathlength factor. In our study, is the baseline signal and was obtained by averaging the signal during before administration of the seizure-inducing drugs. The relative changes of hemoglobin concentrations, and are derived from Eq. 1 as follows:The rhythmical activities of and were analyzed using various spectral analysis methods, such as fast Fourier transform. The phase relationship between oxy- and deoxyhemoglobin was further analyzed by evaluating instantaneous phase using Hilbert transform,13 which is defined by The phase difference between and was obtained by subtracting from , where and are instantaneous phases of and , respectively. We particularly observed the phase relationship of low-frequency oscillation of oxy- and deoxyhemoglobin concentrations, which corresponds to Mayer wave at the frequency of . A symmetric bandpass filter (23th-order zero-phase Butterworth with and ) was applied to extract the low-frequency oscillation.Spatial correlation between hemodynamic signals from eight NIRS channels was evaluated using a cross-correlation function called “xcorr” in Matlab, which is defined by where and are ’th and ’th NIRS signals. is the correlation function of time delay between ’th and ’th channels.3.Results3.1.Drug-Induced Seizures in Mouse EEGAs the first step in isolating the epileptic moments in vivo in mice, we performed cortical EEG recordings of mice, simultaneously with NIRS recordings. In general, the epileptic activities in GBL-treated mice were episodic lasting a few seconds, whereas the ictal activities of 4-AP-treated mice were successive, and even after the cessation of ictal activities, intermittent pulses were observed in the EEG. In terms of spectral properties, it was found that the EEGs of GBL-treated mice had a reduced power in all frequency-bands-compared to the anesthetic baseline state [Fig. 2 ]. On the other hand, the EEGs of 4-AP-treated mice were slightly enhanced after drug administration for all frequency bands [Fig. 2]. Therefore, it is clear that the electrical activities in brain caused by those two drugs differed; from this we infer that the seizure-inducing mechanism was also different. The epileptiform episodes were successfully identified in five out of six GBL-treated mice and in four out of six 4-AP-treated mice. Fig. 2(a) Histogram of the mean relative power spectrum of EEGs before (black bar) and after administration of GBL (gray bar). Error bars represent the standard deviation. Note the significant decrease in all the EEG bands ( , ; , , Kruskal-Wallis nonparametric one-way ANOVA test). The EEG data were normalized in all mice. The total power between 0.1 and during baseline measurements was used as the normalization factor. (b) The same histogram for the mice administered with 4-AP. Note a significant increase in the band. The power spectrum tends to increase in , , and bands also, but not significantly.  Various EEG patterns of GBL-treated mice infrequently appeared during seizure events. Figure 3 show the frequently appearing epileptiform discharge in GBL-treated mice. The onset and termination of ictal periods were recognized as abrupt changes in the amplitude and frequency, mostly with the appearance of spikes or sharp waves or a combination of the two. The epileptiform discharge started to appear about after the administration of GBL and appeared irregularly, as summarized in Table 1 . The morphological feature of epileptiform discharge, and frequency, were different between each mouse. The duration between onset and termination of the ictal discharges was and the peak-to-peak amplitude during ictal discharge was two to five times higher than those during the interictal period. Fig. 3Typical patterns of epileptiform discharges observed in (a) GBL-treated mice. Various signals such as sharp wave, spike-and-wave complexes, polyspike complex, and polyspike-and-wave complex were observed. (b) Baseline (left) and ictal tonic activity (right) in 4-AP-treated mice.  Table 1Summary of epileptic responses recorded by EEGs for GBL-treated mice.
bThe total duration of ictal events was obtained by adding the duration of ictal events in every mouse. The EEG of mouse 1 did not show any epileptic features during recording. In other five mice, sharp waves were observed, as shown in Fig. 3. Two mice showed spike-and-wave discharge [Fig. 3] in their EEGs, which is a typical pattern of absence seizure. The EEG activities after the 4-AP injection were characterized by a long period of repetitive spikes, initially low in amplitude but increasing as time passed [Fig. 3] three out of six mice showed convulsive EEG within after the dose. One mouse experienced epileptiform discharges after the dose. The repetition rate of spikes was approximately 0.5 or . The interictal periods could not be clearly defined on the EEGs of 4-AP-treated mice because of the intermittent appearance of paroxysmal discharge. In the case of 4-AP, the peak-to-peak amplitudes during a seizure ranged from 13 to 25 times higher than the standard baseline signals, as summarized in Table 2 . Sometimes, strongly synchronized spikes with amplitudes of nearly 50 times higher than other spikes were observed. Table 2Summary of epileptic responses in the EEGs of 4-AP-treated mice.
3.2.Systemic Hemodynamic Responses to Seizure Measured by NIRSFigure 4 illustrates the systemic changes in and after the administration of seizure-inducing drugs. The long-term responses in hemodynamic concentrations were notably different for each drug applied: in general, mice treated with GBL had a slow but large increase in ; on the other hand, mice treated with 4-AP had multiple sharp inflows without long-term drifts. Fig. 4Systematic hemodynamic responses after administration of (a) GBL and (b) 4-AP. The vertical line represents the time of i.p. injection. and are given in solid and dotted lines, respectively. The scale bar in -axis is . All data were obtained by averaging hemodynamic responses from eight regions of the brain. Note the apparently different hemodynamic patterns with time between these two drug groups. 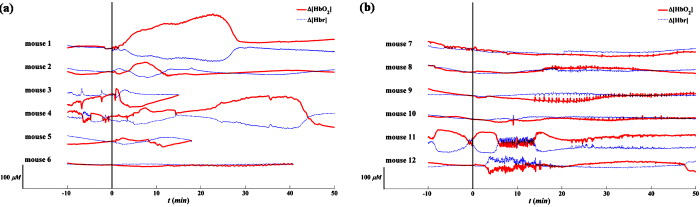 The systemic hemodynamic response records show diverse patterns between each mouse even when treated with the same drug. For example, four out of six GBL-treated mice experienced global increases in (mouse 1, 2, 4, and 5): Mouse 3 died after dose and the increase was observed only during the first several minutes. Mouse 6 did not show any significant systemic responses. In 4-AP-treated mice, fast and sporadic blood inflow was observed in four out of six mice (mice 7–10). 3.3.Spatial Correlation of Hemodynamic Signals during SeizureThe hemodynamic data obtained in different regions of the mouse brain were analyzed to extract information on the dynamical correlation between two regions. The degree of spatial correlation during epileptic events was compared to the values during baseline. The level of spatial correlation was obtained by calculating the cross-correlation coefficient of at different positions. For eight NIRS channels, the cross-correlation coefficients for 28 pairs were calculated every minute. The mean and standard deviation of the spatial correlation are plotted with respect to time for each mouse along with the seizure occurrence caused by GBL and 4-AP in Figs. 5 and 5 , respectively. Neither significant change of spatial correlation nor correlation to the epileptic events was observed in GBL-injected mice [Fig. 5]. The spatial correlation of hemodynamics increased significantly after injection of drug compared to the baseline in the 4-AP group, except mouse 7 (paired -test, ). In addition, it was observed that the synchronized behavior of hemodynamic flow precedes the cease of epileptic episodes [mouse 8 and 9 in Fig. 5]. Fig. 5Mean (black, thick solid lines) and standard deviation (black, thin solid lines) of the spatial correlation for each mouse plotted with seizure activity (red, dotted line) in (a) GBL and (b) 4-AP groups. The ictal ratio is the period of ictal activity per minute. The spatial correlation was obtained by calculating the cross-correlation coefficient of time series at different two positions. Prior to cross-correlation calculation, each was detrended by removing the systemic signals. No significant responses observed in scalp EEG in mouse 1, 7, and 12. The spatial correlation coefficients significantly increased in 4-AP group ; however, no significant change was observed in the GBL group. (Color online only.)  3.4.Hemodynamic Responses to GBL-Induced SeizureThe durations of GBL-induced seizure were in most of the cases. We analyzed each hemodynamic change for each epileptic event. In regard to hemodynamic response to seizure, five distinct patterns can be classified: “no response,” “wash-out” ( and ), “joint-decrease” ( and ), “joint-increase” ( and ), and deactivation ( and ), as schematically shown in the inner box in Fig. 6 . Sample traces of each case were shown in Supplements 1–4. Prior to categorizing hemodynamic responses, a zero-phase Butterworth high-pass filter with a cutoff frequency of was applied to eliminate any drift. 40–70% of epileptic responses were not accompanied by any hemodynamic responses. After each epileptic event, the subsequent hemodynamic signals were averaged. Mouse 1 was excluded in this process because the epileptic episodes were hardly to be distinguishable in the EEG recording. It was observed that the joint decrease was the dominant hemodynamic response (37–52%), and the wash-out responses were observed (0–17%) third. The opposite pattern of wash-out, i.e., the de-activation response was observed only in mouse 6 with a significant ratio (37.5%). We have not noted any single case of joint increase. Fig. 6(a) Number of various hemodynamic responses counted for only when epileptic episodes appear in the GBL group. The small box inside of the graph illustrates how we defined the type of hemodynamic responses. In the early period after the dose, no response or joint decrease was dominant. Wash-out response was observed additionally in after the dose. A simultaneous decrease in oxyhemoglobin and increase in deoxyhemoglobin responses appeared at after the dose and became a dominant response in the late period after after the dose. (b) The averaged temporal phase relationship between and of the GBL-treated (solid line) and 4-AP-treated (dashed line) mice groups. Their standard deviation for each data point is represented by a dotted line. The raw data were filtered by the zero-phase Butterworth bandpass filter to evaluate the LFO range, and the Hilbert transform was applied. Then, the phase difference between and was obtained by subtracting from as described in Eq. 4. The ninth polynomial fitting was performed for all data. Note that the in-phase relationship is observed in GBL-treated mice while an out-of-phase relationship is maintained in 4-AP-treated mice.  Figure 6 shows a summary of hemodynamic responses of all GBL-treated mice with respect to time. For the first after the dose, neither epileptiform discharge nor hemodynamic response was observed for all cases. Afterward, various hemodynamic responses were recorded, such as “no response,” “joint-decrease,” “wash-out,” and “de-activation.” 3.5.Phase Relationship between andThe relative phase changes between oxy- and deoxyhemoglobin concentrations in the frequency band of low-frequency oscillation (LFO) were investigated. out-of-phase oscillations in and are typically recorded8 and in-phase changes are associated with modifications to the total hemoglobin concentration or blood partial volume.14 The instantaneous phase was obtained by calculating the Hilbert phase after filtering by a zero-phase bandpass filter (Butterworth, ). The temporal development of the phase shift in both drug groups is shown in Fig. 6. Because we are only interested in the relative phase relationship between oxy- and deoxyhemoglobin, phases between 180 and were converted to those between 180 and . We observed that the phase relationship between oxy- and deoxyhemoglobin during baseline recording in the mouse was are almost out of phase, and its mean value was . In the 4-AP group, no statistically different phase shifts between oxy- and deoxyhemoglobin were observed after drug administration. In the GBL group, the out-of-phase relationship moved to the in-phase state approximately after the dose and then returned to the out-of-phase state after the dose. 4.DiscussionArranging multiple sensors on a mouse brain is extremely challenging due to the size of the brain. For successful installation of multiple sensors on the mouse brain, construction of fiber holders and application of dental cement to the sensors for fixation were critical factors. Because NIRS requires two different wavelengths of light focused on the same spot, aligning fibers usually takes most of the preparation time and using the fiber holder with manipulation function dramatically reduced the installation time. Additionally, the dental cement fixated the fiber tips and maintained the consistent interface to the skull. The main difference between GBL- and 4-AP–induced seizure was in the duration of the epileptic periods. In the case of GBL, the epilepsy was episodic and its duration was short , whereas the ictal activity induced by 4-AP was successive and intermittent sharp pulses were observed even after the cessation of the ictal activity. These EEG patterns with respect to the convulsive drugs were consistent with previous reports.15, 16 Because the ictal activity by 4-AP was not periodical, the temporal variation with respect to individual epileptic episodes could be resolved only in the case of GBL-induced absence seizure. The long-term hemodynamic responses to the convulsive drugs were described as a systemic response and compared to the predrug states. In general, the GBL increases the oxygenation level [Fig. 4], whereas the 4-AP did not influence the oxygenation level [Fig. 4]. However, unstable changes during the predrug state were found in some of the mice (3, 4, and 11 in Fig. 4). The mice were anesthetized by Avertin. The direct influence of Avertin to the brain is not fully understood, but it was known that Avertin can induce a certain fall in blood pressure; hence, we consider that these fluctuations during the baseline represent the disrupt changes in blood pressure. Interestingly, we observed huge inflows of oxyhemoglobin frequently in 4-AP-treated mice [Fig. 4], but no distinguishable high-voltage activations followed in the EEG were observed. 4-AP, known to be a potassium channel blocker, generates tonic-clonic seizures by increasing the seizure susceptibility caused by an increase in the extracellular potassium concentrations. Considering these ictal activities occur persistently over the whole brain, one might expect to see hypoxia followed by hyperoxia due to the substantial demand for oxygen. Instead of a systemic increase, sporadic inflows of oxyhemoglobin were found to meet the oxygen demand. One major difference between two drugs is that mostly pyramidal neurons in cortical layers are involved in 4-AP–induced seizure,17 whereas the whole thalamocortical network is involved in GBL-induced seizure.11 The difference in the epileptogetic mechanism underlies being able to generate the different physiological response. The huge inflows in 4-AP–induced mice had of event duration, which is hard to be originated from movement. Typically, mice have strong and continuous convulsion in the later phase of the postdose period, no convulsion-related changes in neither hemodynamic nor EEG signals were found. Moreover, if it is induced by the change in the optical interface, the direction of two wavelengths must be the same, which they were not in our case. No coincidental epileptic signal in EEG implies that either the oxygen inflow may not be related to epilepsy or one-channel EEG was insufficient to monitor regional activities in the brain. To clarify this issue, simultaneous monitoring of blood pressure or arterial oxygenation of the mouse may allow a better explanation of the physiological origin of the inflows. In regard to EEG, multichannel mouse EEG with a high number of electrodes may locate the epileptic sources. More importantly, any residual or accumulated influence of drugs may contribute the uncorrelated hemodynamic changes to the epileptic activities in the brain. We expect that employing a transgenic mouse model with spontaneous epilepsy will assort the hemodynamic responses. In human studies, simultaneous measurements of EEG and NIRS showed a decrease in hemoglobin oxygenation during absence seizure18 and an increase in cerebral blood volume in a patient’s focal seizure.19 In our measurement, we observed various hemodynamic responses including joint decrease, wash out, and deactivation, but mostly the epileptic events trigger the decrease in the deoxyhemoglobin concentration. These results are more consistent with functional magnetic resonance imaging (fMRI)-EEG studies in humans; in essence, these studies reported patient-specific hemodynamic responses,20 high inter- and intrasubject variability,21 and concurrence between hemodynamic and brain activation.22 A dynamic fMRI-EEG study on rats showed that absence seizure concurrently induced bold signal increases in the thalamus and somatosensory cortex.23 The same study also showed that a general increase in the bold level was observed in rats experiencing tonic-clonic seizure. These results are consistent with our observations of a decrease in deoxyhemoglobin accompanied by GBL-induced seizure and a sudden decrease monitored in 4-AP–injected mice. The simultaneous decrease of oxy- and deoxyhemoglobin observed in mice 2–5 can be speculated as either vasoconstriction or simultaneous flow and metabolism decrease. It has been reported that astrocytic calcium is an important determinant of the regulation of vasodilation and vasoconstriction in the cerebral microvasculature.24 Vascular constriction occurs when the astrocytic calcium level increases due to the propagation of calcium in the astrocyte end feet.25 However, the influence of GBL on the astrocytic calcium level is unknown. A further study on transgenic mice with an altered calcium current in the astrocytes may be crucial in determining the condition in which vasoconstriction occurs. In the predrug state, the phase shifts between oxy- and deoxyhemoglobin were , which is comparable to the values in the human brain.8, 26 Our observation showed that 4-AP did not alter the phase shift, whereas GBL reduced the phase shift in an impressive manner [Fig. 6]. It has been reported that the out-of-phase relationship of oxy- and deoxyhemoglobin has been described in previous studies as a spin-off phenomenon of the wash-out effect.27 In conclusion, the experimental setup presented in this study successively monitored the cerebral hemodynamics in the mouse brain in conjunction with electrophysiological recording under pharmacological manipulation. Recent innovative techniques in genetic engineering have produced mechanically controllable mice in the molecular, cellular, or circuit level. Our multimodal setup will be a good screening technology along with prevalent neurophysiological techniques. Moreover, simultaneous assessment of cerebral hemodynamics and electrical activity in transgenic mice will support the study of the molecular or cellular origin of neurovascular coupling in vivo. AcknowledgmentsThe authors thank Dr. Ursula Wolf at University Hospital Zurich for her helpful discussions, and Juno Park at the specific-pathogen-free (SPF) facility of the KIST for his preparation of the animals required. This work was supported by the Young Scientist Excellence Award from the Korea Research Council of Fundamental Science & Technology, the Center-of-Excellence Program of the KIST, and the Brain Research Center of the 21st Century Frontier Research Program funded by the Ministry of Education, Science and Technology. ReferencesM. Bucan and T. Abel,
“The mouse: genetics meets behaviour,”
Nat. Rev. Genet., 3
(2), 114
–123
(2002). https://doi.org/10.1038/nrg728 1471-0056 Google Scholar
T. Misgeld and M. Kerschensteiner,
“In vivo imaging of the diseased nervous system,”
Nat. Rev. Neurosci., 7
(6), 449
–463
(2006). https://doi.org/10.1038/nrn1905 1471-003X Google Scholar
F. F. Jobsis,
“Noninvasive, infrared monitoring of cerebral and myocardial oxygen sufficiency and circulatory parameters,”
Science, 198
(4323), 1264
–1267
(1977). https://doi.org/10.1126/science.929199 0036-8075 Google Scholar
H. Shibasaki,
“Human brain mapping: hemodynamic response and electrophysiology,”
Clin. Neurophysiol., 119
(4), 731
–743
(2008). https://doi.org/10.1016/j.clinph.2007.10.026 1388-2457 Google Scholar
Y. Hoshi,
“Functional near-infrared spectroscopy: current status and future prospects,”
J. Biomed. Opt., 12
(6), 062106
(2007). https://doi.org/10.1117/1.2804911 1083-3668 Google Scholar
R. Mukamel, H. Gelbard, A. Arieli, U. Hasson, I. Fried, and R. Malach,
“Coupling between neuronal firing, field potentials, and FMRI in human auditory cortex,”
Science, 309
(5736), 951
–954
(2005). https://doi.org/10.1126/science.1110913 0036-8075 Google Scholar
S. Boden, H. Obrig, C. Kohncke, H. Benav, S. P. Koch, and J. Steinbrink,
“The oxygenation response to functional stimulation: is there a physiological meaning to the lag between parameters?,”
Neuroimage, 36
(1), 100
–107
(2007). https://doi.org/10.1016/j.neuroimage.2007.01.045 1053-8119 Google Scholar
H. Obrig, M. Neufang, R. Wenzel, M. Kohl, J. Steinbrink, K. Einhaupl, and A. Villringer,
“Spontaneous low frequency oscillations of cerebral hemodynamics and metabolism in human adults,”
Neuroimage, 12
(6), 623
–639
(2000). https://doi.org/10.1006/nimg.2000.0657 1053-8119 Google Scholar
M. Gasior, A. French, M. T. Joy, R. S. Tang, A. L. Hartman, and M. A. Rogawski,
“The anticonvulsant activity of acetone, the major ketone body in the ketogenic diet, is not dependent on its metabolites acetol, 1,2-propanediol, methylglyoxal, or pyruvic acid,”
Epilepsia, 48
(4), 793
–800
(2007). https://doi.org/10.1111/j.1528-1167.2007.01026.x 0013-9580 Google Scholar
B. Abou-Khalil and K. E. Misulis, Atlas of EEG & seizure semiology, Butterworth-Heinemann/Elsevier, Philadelphia
(2006). Google Scholar
P. K. Banerjee, M. Burnham, and D. Hampson,
“Modulation of absence seizures by the GABA(A) receptor: a critical role for metabotropic glutamate receptor 4 (mGluR4),”
J. Neurosci., 20
(16), 6218
–6224
(2000). 0270-6474 Google Scholar
D. T. Delpy, M. Cope, P. van der Zee, S. Arridge, S. Wray, and J. Wyatt,
“Estimation of optical pathlength through tissue from direct time of flight measurement,”
Phys. Med. Biol., 33
(12), 1433
–1442
(1988). https://doi.org/10.1088/0031-9155/33/12/008 0031-9155 Google Scholar
A. V. Oppenheim, R. W. Schafer, and J. R. Buck, Discrete-time signal processing, Prentice Hall, Englewood Cliffs, NJ
(1999). Google Scholar
S. Fantini,
“A haemodynamic model for the physiological interpretation of in vivo measurements of the concentration and oxygen saturation of haemoglobin,”
Phys. Med. Biol., 47
(18), N249
–257
(2002). https://doi.org/10.1088/0031-9155/47/18/402 0031-9155 Google Scholar
M. Weiergräber, M. Henry, M. S. Ho, H. Struck, J. Hescheler, and T. Schneider,
“Altered thalamocortical rhythmicity in Ca(v)2.3-deficient mice,”
Mol. Cell. Neurosci., 39
(4), 605
–618
(2008). https://doi.org/10.1016/j.mcn.2008.08.007 1044-7431 Google Scholar
P. Baracskay, Z. Szepesi, G. Orban, G. Juhasz, and A. Czurko,
“Generalization of seizures parallels the formation of “dark” neurons in the hippocampus and pontine reticular formation after focal-cortical application of 4-aminopyridine (4-AP) in the rat,”
Brain Res., 1228 217
–228
(2008). https://doi.org/10.1016/j.brainres.2008.06.044 0006-8993 Google Scholar
S. Rheims, A. Represa, Y. Ben-Ari, and Y. Zilberter,
“Layer-specific generation and propagation of seizures in slices of developing neocortex: role of excitatory GABAergic synapses,”
J. Neurophysiol., 100
(2), 620
–628
(2008). https://doi.org/10.1152/jn.90403.2008 0022-3077 Google Scholar
K. Buchheim, H. Obrig, W. v Pannwitz, A. Muller, H. Heekeren, A. Villringer, and H. Meierkord,
“Decrease in haemoglobin oxygenation during absence seizures in adult humans,”
Neurosci. Lett., 354
(2), 119
–122
(2004). https://doi.org/10.1016/j.neulet.2003.10.001 0304-3940 Google Scholar
E. Watanabe, A. Maki, F. Kawaguchi, Y. Yamashita, H. Koizumi, and Y. Mayanagi,
“Noninvasive cerebral blood volume measurement during seizures using multichannel near infrared spectroscopic topography,”
J. Biomed. Opt., 5
(3), 287
–290
(2000). https://doi.org/10.1117/1.429998 1083-3668 Google Scholar
J. K. Kang, C. Benar, A. Al-Asmi, Y. A. Khani, G. B. Pike, F. Dubeau, and J. Gotman,
“Using patient-specific hemodynamic response functions in combined EEG-fMRI studies in epilepsy,”
Neuroimage, 20
(2), 1162
–1170
(2003). https://doi.org/10.1016/S1053-8119(03)00290-8 1053-8119 Google Scholar
J. Jacobs, C. Hawco, E. Kobayashi, R. Boor, P. LeVan, U. Stephani, M. Siniatchkin, and J. Gotman,
“Variability of the hemodynamic response as a function of age and frequency of epileptic discharge in children with epilepsy,”
Neuroimage, 40
(2), 601
–614
(2008). https://doi.org/10.1016/j.neuroimage.2007.11.056 1053-8119 Google Scholar
A. Salek-Haddadi, B. Diehl, K. Hamandi, M. Merschhemke, A. Liston, K. Friston, J. S. Duncan, D. R. Fish, and L. Lemieux,
“Hemodynamic correlates of epileptiform discharges: an EEG-fMRI study of 63 patients with focal epilepsy,”
Brain Res., 1088
(1), 148
–166
(2006). https://doi.org/10.1016/j.brainres.2006.02.098 0006-8993 Google Scholar
H. Nersesyan, F. Hyder, D. L. Rothman, and H. Blumenfeld,
“Dynamic fMRI and EEG recordings during spike-wave seizures and generalized tonic-clonic seizures in WAG/Rij rats,”
J. Cereb. Blood Flow Metab., 24
(6), 589
–599
(2004). https://doi.org/10.1097/01.WCB.0000117688.98763.23 0271-678X Google Scholar
C. Iadecola and M. Nedergaard,
“Glial regulation of the cerebral microvasculature,”
Nat. Neurosci., 10
(11), 1369
–1376
(2007). https://doi.org/10.1038/nn2003 1097-6256 Google Scholar
S. J. Mulligan and B. A. MacVicar,
“Calcium transients in astrocyte endfeet cause cerebrovascular constrictions,”
Nature, 431
(7005), 195
–199
(2004). https://doi.org/10.1038/nature02827 0028-0836 Google Scholar
G. Taga, Y. Konishi, A. Maki, T. Tachibana, M. Fujiwara, and H. Koizumi,
“Spontaneous oscillation of oxy- and deoxy- hemoglobin changes with a phase difference throughout the occipital cortex of newborn infants observed using non-invasive optical topography,”
Neurosci. Lett., 282
(1–2), 101
–104
(2000). https://doi.org/10.1016/S0304-3940(00)00874-0 0304-3940 Google Scholar
V. Toronov, S. Walker, R. Gupta, J. H. Choi, E. Gratton, D. Hueber, and A. Webb,
“The roles of changes in deoxyhemoglobin concentration and regional cerebral blood volume in the fMRI BOLD signal,”
Neuroimage, 19
(4), 1521
–1531
(2003). https://doi.org/10.1016/S1053-8119(03)00152-6 1053-8119 Google Scholar
|