
|
|
1.IntroductionLight propagation in biological tissue and light-tissue interaction are commonly studied in relatively large volumes, for example, in a few cubic millimeters. In diffusion approximations for tissue optics, the radial distance distribution with distance are commonly described by a function of . In this respect, there have been numerous methods to measure macroscopic optical properties such as the transport mean free path of light in biological media to obtain information about physiological conditions and disease status.1, 2, 3, 4, 5 Such measurements are ideal to study the profiles of when as intended to capture the behavior of diffusive light in biological media. On the other hand, it is challenging to obtain information about when , in part because it is extremely difficult to generate a pencil-like illumination of in diameter due to the diffraction. There can be instances in which a subtle alteration in may not be sensitively captured by the diffusion-approximation-based methods. To easily obtain for tissue characterizations, we can use enhanced backscattering of light (EBS, otherwise known as coherent backscattering of light, CBS). EBS is a robust manifestation of self-interference effects in elastic light scattering, which gives rise to an enhanced scattered intensity in the backward direction.6, 7, 8 For a plane wave incident on a semi-infinite random medium, every wave scattered from the medium in the backward direction has its counterpart time-reversed wave traveling along the same path in the opposite direction. These waves have consistent phase differences at the exit points and thus interfere constructively with each other. Consequently, the angular profile of the EBS peak can be considered a Fourier transform of . The width of the EBS peak is inversely proportional to the product of the wave number and the transport mean free path of light in the medium . In principle, the EBS peak amplitude can be as high as 2, compared with the incoherent baseline. In particular, to detect a variation in when , we can use the enhancement factor [i.e., the ratio of the exact backscattering intensity to the incoherent baseline intensity] in EBS measurements under low-spatial-coherence illumination (hereafter it is referred to as low-coherence enhanced backscattering, LEBS). The angular profile of LEBS can be expressed as , where , is the first-order Bessel function, is spatial coherence length, and is the backscattering angle.9, 10, 11 Thus, the LEBS enhancement factor . In other words, the LEBS enhancement factor is a measure of the intensity within the spatial coherence area, which is also normalized by the incoherent background intensity. Any changes in the LEBS enhancement factor are directly related to changes in . In our previous studies,11, 12, 13, 14, 15, 16 low-spatial-coherence illumination was implemented in EBS to isolate low-order scattering by dephasing the conjugated time-reversed paths outside its spatially coherent area when . In this case, the coherent area (or the transverse modes) can be as small as , while is of the order of a few millimeters in biological tissue. In general, a change in could be originated from variations in the macroscopic optical properties such as . On the other hand, when , there can be a case in which a subtle alteration in may not be sensitively captured by the macroscopic optical property. Figure 1 illustrates the instance in which the LEBS enhancement factor measurements can be distinct from conventional EBS measurements. In conventional EBS, the probing volume of the time-reversed interference waves is similar with those of the incoherent waves, while low-spatial-coherence illumination generates a discrepancy between the coherent and incoherent volumes. The LEBS enhancement factor provides averaged information of the local optical properties that are determined by the multiple individual coherence volumes. This averaging effect partially preserves the local optical properties as compared with the averaging over the entire area. Collectively, the LEBS enhancement factor can be sensitive to subtle alterations in light propagation, in particular, when . Fig. 1Schematic illustration of the instance in which the LEBS enhancement factor can be distinct from the EBS enhancement factor under spatially coherent illumination. The two media [sketched in (a) and (d)] consist of scatterers of different relative refractive indices , different diameters , and different numbers of particles (per milliliter), while the transport mean free path and the anisotropic factor are identical. In this case, (b) and (e) show the identical angular profiles with the enhancement factor of 2 because of the same . On the other hand, the LEBS enhancement factors in the two media can be different, because the relative small coherent volumes determined by low-spatial-coherence illumination partially preserves the local optical properties as compared with the conventional measurement in the large volume.  In this paper, to study the LEBS enhancement factor [i.e., ] in weakly scattering media including early cancerous tissue, we implement (1) low-spatial-coherence illumination using a finite size of an illumination source and (2) multiple spatially independent detections using a microlens array under spatially coherent illumination. We investigate the enhancement factor in these configurations from various optical properties of scattering media. In particular, a microlens array in the detection arm under spatially coherent illumination enables us to experimentally study the angular distribution of coherent light propagation within each independent localized area. Each microlens can serve as a spatial filter, which provides a unique configuration to study scattering properties of the media in a localized area as similarly as low-spatial-coherence illumination. Finally, we report a pilot animal study of nonmelanoma skin cancer using two-stage carcinogen treatments to investigate changes in the LEBS enhancement factor during early skin carcinogenesis. 2.Methods2.1.Experimental SetupsOur first experimental setup for LEBS measurements is described in Fig. 2 . In brief, a beam of broadband cw light was linearly polarized and delivered onto a sample with the illumination diameter of . By changing aperture size of A1 in the lens system, we obtained two values of of the incident light ( and ). An interference filter was placed in the delivery part to select the central wavelength of with the spectral width of . The value of was confirmed by the Young’s double-pinhole interference experiments.17 The light backscattered by the sample was collected by a sequence of a lens, a linear analyzer parallel to the incident polarization direction, and a CCD camera. We analyzed angular intensity profiles with the polarization direction parallel to that of the incident light. As shown in Fig. 2, we further demonstrated that the multiple localized volume detections played a key role in LEBS measurements as follows. We placed a microlens array between the lens system and the relay lens system using spatially coherent illumination from a He-Ne laser. The microlens array (pitch, , and area, ) was placed exactly on the imaging plane of the sample so that each microlens at different spatial locations additionally served as a spatial filter for the time-reversed interference signals. The relay lens system was used to map the focal plane of the microlens array onto the CCD camera. More importantly, this configuration can be used to study angular dependency of light scattered from the sample over different spatial locations. Thus, our two complementary experimental setups enabled us to investigate EBS formation in the regime of by altering either the illumination property or the detection configuration. For the animal studies, as shown in Fig. 2, the lens in the detection arm directly projected the angular distribution of the backscattered light onto the slit of the spectrograph, which dispersed the light according to its wavelength in the direction perpendicular to the slit of the spectrograph. Thus, angular distribution of backscattering light in a certain wavelength range can be selected. In particular, we can avoid the spectral range that is affected by the hemoglobin absorption band. For the pilot animal study, we used the values of to study carcinogenesis in the superficial skin. Fig. 2Complementary experimental setups using (a) EBS measurements under low-spatial-coherence illumination (i.e., LEBS), (b) multiple spatially independent detections using a microlens array, and (c) LEBS spectroscopy instrument. (a) The aperture A1 determines the spatial coherence length of illumination. A single lens L projects the angular distribution of the backscattering light onto the CCD camera. (b) The microlens array in the detection arm offers multiple mutually independent spatial filters under spatially coherent illumination. (c) The lens in the detection arm projects the angular distribution of the backscattered light onto the slit of the spectrograph, which disperses the light according to its wavelength in the direction perpendicular to the slit. The CCD records an intensity matrix as a function of the wavelength and the backscattering angle. P1 and P2 are polarizers. A1 and A2 are apertures. F is an interference filter.  2.2.Phantom PreparationsWe studied that the LEBS enhancement factor can be sensitive to subtle alterations in resulted from changes in either the macroscopic scattering properties such as , or the internal structures such as the relative refractive indices and the scatterer sizes. We mixed microspheres with different amounts of the solvents, and varied the relative refractive index ( , where and are the refractive indices of the particle and the medium, respectively) and the particle size . In particular, to study the effect of a minute perturbation by and alone, we must keep the macroscopic scattering properties identical. In this case, we used polystyrene microspheres ( , Ref. 18) and silica microspheres ( , Ref. 19) as the scatterers and distilled water or glucose solution as the media. Table 1 illustrates representative sample preparations when and at . To accurately measure of the mixed medium of glucose and water, we obtained elastic backscattering spectral data ranging from from the glucose suspension containing polystyrene microspheres of . We fitted the experimental spectra with Mie theory simulations using the known particle diameter and the known of the large particles. Because the ripple spectral pattern from the glucose suspension of the large particles was highly dependent on , we could accurately estimate when the correlation coefficient between the simulation and the experimental spectra was the maximum. For the glucose suspension with the concentration of , we obtained its at at room temperature. Using this procedure, we also confirmed of water at room temperature.20 In the main study, we varied from and fixed of 0.91 to mimic most biological tissue.21 The macroscopic scattering properties were calculated using Mie theory.22 The dimension of the samples was approximately . Table 1Representative sample preparations of the scattering media of ls*=400μm and g=0.91 .
3.Results of the Phantom StudiesSince is an additional length scale in LEBS, we first experimentally confirmed that the ratio of to can serve as a unitless length scale, which was also used in previous theoretical studies.9, 10 Note that is related to the ratio of the interference portion contributed by the coherent volume to the incoherent baseline. We tested that the unitless length scale can determine the enhancement factor of LEBS. In this experiment, we prepared two different scattering media of and and measured the EBS angular profiles under and , respectively. Figure 3 shows the angular profiles from the two typical scattering media when . The enhancement factors of the two cases were statistically the same with , supporting the utility of . Using the unitless parameter, we further studied the LEBS enhancement factors in the range of from 0.2 to 6.25 using water suspension of polystyrene microsphere ( and ), as shown in Fig. 4 . When , the enhancement factor was high and then decreased rapidly as decreased. Even in the case of , there were significant dephasing effects manifested as the reduction in the enhancement factor, indicating that long scattering paths can be substantially destroyed in this regime. Our experimental results are also in good agreement with the theoretical studies.9, 10 Fig. 3Angular profiles obtained from the water suspension of polystyrene microspheres of and under two different values of and . Because in the both cases, the enhancement factors are statistically the same. 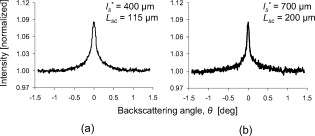 Fig. 4(a) Enhancement factor as a function of the unitless length scale measured from the water suspension of polystyrene microspheres and (b) enhancement factor over the unitless length scale for three different and . The LEBS enhancement factor depends on subtle perturbations of , , or .  To explore the unique instance in which a subtle alteration in may not be sensitively captured by the macroscopic scattering properties, we investigated the effect of and on the enhancement factor when . The regime of covers most biological cases where is generally less than and is greater than . Figure 4 shows that under the same macroscopic optical properties, the higher gives rise to a higher enhancement factor under low-spatial-coherence illumination. Indeed, when , the enhancement factor can be sensitive to subtle changes in and . As shown in Fig. 4, the gradual increase in the enhancement factor over at a given represents the increase in the local scattering power, which cannot be assessed using conventional EBS measurements. This is because the LEBS averages the multiple measurements of the local optical properties when . This effect cannot be manifested if the optical properties are averaged in the entire area (e.g., ). From the perspective of conventional EBS, when the macroscopic optical properties of the scattering medium are kept the same, the EBS profile should remain the same with the enhancement factor of 2. Overall, the LEBS enhancement factor is directly related to a change in , which can be originated from variations either in the macroscopic optical properties (e.g., ) or the sample structure details (e.g., relative refractive indices and sizes of scatterers). This characteristic of LEBS over a large range of further supports the utility of the LEBS enhancement factor for tissue characterizations. We also used the microlens array under spatially coherent illumination, as shown in Fig. 2. The microlens can serve as a spatial filter so that time-conjugate waves outside its finite aperture cannot interfere with each other. Similarly to EBS measurements under low-spatial-coherence illumination, Fig. 5 shows that the enhancement factor of each EBS cone is significantly reduced, because each microlens determines the coherent volume. The medium in Fig. 5 was a uniform suspension of polystyrene microspheres. The nonuniform peak profiles were due to the inconsistent focal lengths of each microlens and imaging aberrations. Overall, this configuration enabled us to calculate a matrix of the enhanced factors. We prepared two different media of different and with the same macroscopic scattering properties of and at . The values of of both samples were confirmed to be the same by the identical angular profiles using the conventional EBS measurements. The enhancement factor was calculated by averaging the intensity from all the azimuthal angles. Figure 5 illustrates typical multiple EBS cones formed by each aperture of the microlens array when was much greater than the pitch size. We compared the two enhancement factor matrices pairwise, as shown in Fig. 6 . Using paired tests, the two enhancement factor matrices were statistically different with , although the macroscopic scattering properties were identical. This result was in good agreement with the previous LEBS enhancement factor measurements under low-spatial-coherence illumination. We note that the overall enhancement factors using the microlens array were lower than that of the single LEBS reading, probably due to low angular resolution through the series of the lenses. This result from the second experimental setup [Fig. 2] shows that each EBS peak in the matrix is mainly determined by the localized traveling waves, supporting the previous result that a single LEBS reading (i.e., the averaged value of many unit EBS cones) can detect the subtle changes in . In addition, this configuration helps us to further understand the working principles of LEBS. Fig. 5Typical angular profiles measured under spatially coherent illumination (i.e., He–Ne laser) using the microlens array that allows multiple spatially independent detections. The angular range of each EBS cone is from . The EBS cones are normalized by the intensity at a large scattering angle. The pitch of each microlens is .  Fig. 6Enhancement factor matrix measured using the microlens array under spatially coherent illumination (i.e., ). Although the two media have the identical macroscopic scattering property ( and at ), the multiple spatially independent detections reveal the influence of and on the enhancement factor matrix.  4.Feasibility Study for the Detection of Early Carcinogenic Alterations Using LEBS4.1.Pilot Animal Study Using Cutaneous Two-Stage Chemical Carcinogenesis of Skin CancerTo evaluate the utility of the LEBS enhancement factor for characterizing early carcinogenic alterations, we conducted a pilot animal study using an established animal model of nonmelanoma skin cancer (NMSC). Our animal study was approved by the Purdue Animal Care and Use Committee. Multistep models of carcinogenesis have been intensively studied23 in the mouse model of NMSC and the skin is the ideal organ to study carcinogenic alterations in vivo over time. We employed 7,12-dimethylbenz[a]anthracene (DMBA) + phorbol ester 12-O-tetradecanoylphorbol 13-acetate (TPA)-treated mice as a model system for NMSC (Ref. 24) In our DMBA/TPA-treated mice, cancer initiation was accomplished by a single dose of DMBA on the dorsal skin, and cancer promotion was triggered by repeated applications of TPA, producing multiple papillomas. Because of strong similarities with human skin carcinogenesis, this highly reproducible animal model has been widely used in basic and clinical cancer research.23 Indeed, this is among the most intensively studied murine models of epithelial cancers and several ongoing human clinical trials are based on results generated by this animal model. In addition, in the previous LEBS studies,14, 25 different animals or patients harboring different carcinogenesis stages were used without monitoring carcinogenesis over time. Because of the easy accessibility to the skin, our animal model enabled us to monitor each animal through several stages of carcinogenesis without sacrificing them at different time points, and to analyze the data specifically from the animals eventually harboring invasive tumors. We used eight female FVB/n mice for this pilot study (three control mice and five treated mice). This strain is known to be particularly sensitive to two-stage chemical skin carcinogenesis.26 We had four mice for the DMBA/TPA-treated group and three mice for the age-matched control group. One mouse among the treated mice was used for histologic confirmation at after the carcinogenesis initiation. At of age, we shaved the dorsal skin of the mice using an electric hair shaver and completely removed hairs with a depilatory cream. One week after hair removal, we started the topical carcinogen administration as follows. The experimental group of the mice was treated with a single topical drop of acetone containing DMBA to the shaved dorsal skin. After , acetone containing TPA was applied once a week for . We used acetone as a vehicle to dissolve DMBA or TPA and to enhance the topical administrations. The control mice were similarly treated with the equal volume of acetone. The animals were lightly sedated using an intraperitoneal injection of ketamine/xylazine to immobilize the mice immediately before LEBS measurements. The measurement area was shaved using a clipper and a depilatory cream. We used the experimental setup shown in Fig. 2, in which the illumination beam size was in diameter. To calculate the LEBS enhancement factor without being affected by the hemoglobin absorption, we averaged the spectral signals from . In each mouse, we obtained four LEBS readings from different dorsal areas covering an area of We calculated a mean value of the LEBS enhancement factors from the four different readings in each mouse. We obtained sequential LEBS readings in vivo at 6 and after the carcinogenesis initiation (i.e., DMBA treatment). 4.2.Result and Discussion of the Pilot Animal StudyWe first evaluated all the mice in our pilot study by visual inspection. We confirmed that all carcinogen-treated mice used in this pilot study formed palpable papillomas of in diameter at after the DMBA treatment (except the mouse used for histological evaluation), and the papillomas eventually progressed to invasive tumors. There were no papilloma formations at after the first DMBA treatment. The histologic evaluations from one treated mouse at showed dermal inflammation with overlying epidermal erosions or mild epidermal hyperplasia as a preneoplastic stage. Figure 7 shows that the LEBS enhancement factor at is associated with cancer progression. On the other hand, at , there was no significant difference in the LEBS enhancement factor between the carcinogen-treated and control mice. After (i.e., at ), the LEBS enhancement factor revealed a statistically significant difference with the two-tailed . The LEBS enhancement factor in the control group increased as the mice aged, while the carcinogen-treatment suppressed its increase. The distinct reduction in the LEBS enhancement factor of the treated mice at suggests an alteration in the possibly due to changes in either or structure details of the mice skin. Since the in vivo studies enabled us to monitor each animal at several different time points and to analyze the data specifically from the animals eventually harboring papillomas, our result was directly correlated with cancer progression. Fig. 7LEBS enhancement factor obtained from the precancerous skin tissue at 6 and after the initiation of skin carcinogenesis as compared with the age-matched control mice. The LEBS enhancement factors do not show a significant difference between the carcinogen-treated mice and the control mice at . However, the LEBS enhancement factors at are statistically distinct. We confirmed that all the treated mice in this cohort formed palpable papillomas at after the DMBA treatment.  The reduction in the LEBS enhancement factor in the carcinogen-treated group can be understood as follows. The mouse skin consists of three major layers: the epidermis, the dermis, and the hypodermis.27 The thickness of the mouse epidermis is only around , while the thickness of the female mouse dermis is approximately (Ref. 27). Because the LEBS enhancement factor contains light scattering signals mainly originating14 from tissue depth of , the LEBS enhancement factor should contain the coherent partial waves that travel to the upper layer of the dermis. Recent studies about skin cancer also suggest that squamous cell carcinoma leads to decreased scattering power in the dermis probably due to degradation of collagen crosslinks.28, 29 Similar findings were observed in other types of epithelia cancers such as oral and cervical cancers.30, 31, 32 Our result is consistent with these studies, although our study time points are at a stage of preneoplasia. Furthermore, our finding that the local scattering power increased with age in the control mice is also in agreement with the studies in cervical cancer.33 The previous animal studies12, 14, 15 of precancerous alterations in colon cancer focused on the utility of the spectral properties of LEBS. On the other hand, our current study reports that a different quantification of LEBS (i.e., the enhancement factor) has the potential as an easily measurable robust biomarker, not dependent on the illumination intensity. Overall, our result supports the idea that the alterations in the LEBS enhancement factor can precede the development of papillomas (i.e., the classical early marker of skin carcinogenesis), and that the LEBS measurements potentially enable a better understanding of early carcinogenesis and prediction of cancer progression. A drawback of our studies is that the exact physical origin of the change in the LEBS enhancement factor in our animal study was not clearly elucidated by the tissue phantom studies. This is mainly because measuring in biological media is not trivial. For example, EBS measurements under coherent illumination are commonly used for measuring in nonbiological tissue such as strongly scattering materials, given that the full width at half maximum (FWHM) of the EBS peak . However, in the mouse skin, (Refs. 1, 5) and thus the FWHM of the EBS peak is at . Measuring such an extremely narrow peak is not experimentally simple. As a result, EBS measurements are not commonly used to estimate in biological tissue. We also attempted to measure in the mice skin using conventional EBS measurements. However, due to this experimental challenge, the multiple EBS measurements from the same animal skin sample showed a 30% standard deviation in the EBS peak width. Thus, it was impossible for us to draw any solid conclusion that the change in the LEBS enhancement factor was originated from a change in . Indeed, other methods such as integrating sphere measurements only permit rough estimation of with large experimental deviations.1 In this respect, it is beyond the scope of our current study to report the exact physical origin that determines the LEBS enhancement factor in our animal study. Another limitation of our study is that we did not include any mathematical models that can describe the relationship between the LEBS enhancement factor and the sample optical properties. 5.SummaryWe experimentally studied the properties of the LEBS enhancement factor using two complementary methods: (1) low-spatial-coherence illumination and (2) multiple spatially independent detections. The second configuration can be useful for studying angular dependency of light scattered from the sample over different spatial locations. We demonstrated that the intensity within the spatial coherence area can slightly change due to changes in either the macroscopic optical properties, or the detailed subtle structural features such as the relative refractive indices and the scatterer sizes. In particular, when , which is valid for most biological tissue, the LEBS enhancement factor can capture such alterations. Thus, the LEBS enhancement factor has potential as an easily measurable biomarker in skin carcinogenesis. AcknowledgmentThis project was supported in part by an American Cancer Society Institutional Research Grant No. IRG-58-006-47 to the Purdue Cancer Center, the ITRAC internal pilot grant mechanism of the Indiana University Simon Cancer Center, and a grant from Purdue Research Foundation. We thank Prof. Prabhakar Pradhan for the valuable discussion about our manuscript. We also thank Prof. Curtis Ashendel for helpful discussion about our animal study. ReferencesV. V. Tuchin, Tissue Optics: Light Scattering Methods and Instruments for Medical Diagnosis, 2ndSPIE Publications, Bellingham, WA
(2007). Google Scholar
T. Vo-Dinh, Biomedical Photonics Handbook, CRC, Boca Raton, FL
(2003). Google Scholar
S. L. Jacques, D. G. Oelberg, and I. Saidi,
“Method and apparatus for optical measurement of bilirubin in tissue,”
(1994). Google Scholar
J. M. Schmitt and G. Kumar,
“Optical scattering properties of soft tissue: a discrete particle model,”
Appl. Opt., 37
(13), 2788
–2797
(1998). https://doi.org/10.1364/AO.37.002788 0003-6935 Google Scholar
R. Samatham, S. L. Jacques, and P. Campagnola,
“Optical properties of mutant versus wild-type mouse skin measured by reflectance-mode confocal scanning laser microscopy (rcslm),”
J. Biomed. Opt., 13
(4), 041309
(2008). https://doi.org/10.1117/1.2953195 1083-3668 Google Scholar
M. I. Mishchenko, L. D. Travis, and A. A. Lacis, Multiple Scattering of Light by Particles: Radiative Transfer and Coherent Backscattering, Cambridge University Press, New York (2006). Google Scholar
E. Akkermans and G. Montambaux, Mesoscopic Physics of Electrons and Photons, Cambridge University Press, New York (2007). Google Scholar
P. Sheng, Introduction to Wave Scattering, Localization, and Mesoscopic Phenomena, 2nd ed.Springer(2006). Google Scholar
T. Okamoto and T. Asakura,
“Enhanced backscattering of partially coherent light,”
Opt. Lett., 21
(6), 369
–371
(1996). https://doi.org/10.1364/OL.21.000369 0146-9592 Google Scholar
M. Xu,
“Low-coherence enhanced backscattering beyond diffusion,”
Opt. Lett., 33
(11), 1246
–1248
(2008). https://doi.org/10.1364/OL.33.001246 0146-9592 Google Scholar
Y. L. Kim, P. Pradhan, H. Subramanian, M. H. Kim, and V. Backman,
“Circular polarization memory effect in low-coherence enhanced backscattering of light,”
Opt. Lett., 31
(18), 2744
–2746
(2006). https://doi.org/10.1364/OL.31.002744 0146-9592 Google Scholar
Y. L. Kim, Y. Liu, V. M. Turzhitsky, H. K. Roy, R. K. Wali, and V. Backman,
“Coherent backscattering spectroscopy,”
Opt. Lett., 29
(16), 1906
–1908
(2004). https://doi.org/10.1364/OL.29.001906 0146-9592 Google Scholar
Y. L. Kim, P. Pradhan, H. Subramanian, Y. Liu, M. H. Kim, and V. Backman,
“Origin of low-coherence enhanced backscattering,”
Opt. Lett., 31
(10), 1459
–1461
(2006). https://doi.org/10.1364/OL.31.001459 0146-9592 Google Scholar
Y. L. Kim, Y. Liu, V. M. Turzhitsky, R. K. Wali, H. K. Roy, and V. Backman,
“Depth-resolved low-coherence enhanced backscattering,”
Opt. Lett., 30
(7), 741
–743
(2005). https://doi.org/10.1364/OL.30.000741 0146-9592 Google Scholar
Y. L. Kim, V. M. Turzhitsky, Y. Liu, H. K. Roy, R. K. Wali, H. Subramanian, P. Pradhan, and V. Backman,
“Low-coherence enhanced backscattering: review of principles and applications for colon cancer screening,”
J. Biomed. Opt., 11
(4), 041125
(2006). https://doi.org/10.1117/1.2236292 1083-3668 Google Scholar
J. Liu, Z. Xu, and Y. L. Kim,
“Virtual pinhole scanning spectroscopic imaging platform using low-coherence enhanced backscattering,”
Opt. Lett., 34
(16), 2387
–2389
(2009). https://doi.org/10.1364/OL.34.002387 0146-9592 Google Scholar
M. Born and E. Wolf, Principles of Optics: Electromagnetic Theory of Propagation, Interference and Diffraction of Light, 7th ed.Cambridge University Press, New York (1999). Google Scholar
C. Chen, J. Q. Lu, H. F. Ding, K. M. Jacobs, Y. Du, and X. H. Hu,
“A primary method for determination of optical parameters of turbid samples and application to intralipid between 550 and ,”
Opt. Express, 14
(16), 7420
–7435
(2006). https://doi.org/10.1364/OE.14.007420 1094-4087 Google Scholar
N. Suzuki and Y. Tomita,
“Silica-nanoparticle-dispersed methacrylate photopolymers with net diffraction efficiency near 100%,”
Appl. Opt., 43
(10), 2125
–2129
(2004). https://doi.org/10.1364/AO.43.002125 0003-6935 Google Scholar
P. D. T. Huibers,
“Models for the wavelength dependence of the index of refraction of water,”
Appl. Opt., 36
(16), 3785
–3787
(1997). https://doi.org/10.1364/AO.36.003785 0003-6935 Google Scholar
W. F. Cheong, S. A. Prahl, and A. J. Welch,
“A review of the optical-properties of biological tissues,”
IEEE J. Quantum Electron., 26
(12), 2166
–2185
(1990). https://doi.org/10.1109/3.64354 0018-9197 Google Scholar
H. C. van de Hulst, Light Scattering by Small Particles, Dover Publications(1981). Google Scholar
C. J. Kemp,
“Multistep skin cancer in mice as a model to study the evolution of cancer cells,”
Semin Cancer Biol., 15
(6), 460
–473
(2005). https://doi.org/10.1016/j.semcancer.2005.06.003 1044-579X Google Scholar
R. B. Filler, S. J. Roberts, and M. Girardi,
“Cutaneous two-stage chemical carcinogenesis,”
Cold Spring Harb. Protoc., 2007
(18),
(2007). https://doi.org/10.1101/pdb.prot.4837 Google Scholar
Y. Liu, R. E. Brand, V. Turzhitsky, Y. L. Kim, H. K. Roy, N. Hasabou, C. Sturgis, D. Shah, C. Hall, and V. Backman,
“Optical markers in duodenal mucosa predict the presence of pancreatic cancer,”
Clin. Cancer Res., 13 4392
–4399
(2007). https://doi.org/10.1158/1078-0432.CCR-06-1648 1078-0432 Google Scholar
C. D. Woodworth, E. Michael, L. Smith, K. Vijayachandra, A. Glick, H. Hennings, and S. H. Yuspa,
“Strain-dependent differences in malignant conversion of mouse skin tumors is an inherent property of the epidermal keratinocyte,”
Carcinogenesis, 25
(9), 1771
–1778
(2004). https://doi.org/10.1093/carcin/bgh170 0143-3334 Google Scholar
L. Azzi, M. El-Alfy, C. Martel, and F. Labrie,
“Gender differences in mouse skin morphology and specific effects of sex steroids and dehydroepiandrosterone,”
J. Invest. Dermatol., 124
(1), 22
–27
(2005). https://doi.org/10.1111/j.0022-202X.2004.23545.x 0022-202X Google Scholar
E. Salomatina, B. Jiang, J. Novak, and A. N. Yaroslavsky,
“Optical properties of normal and cancerous human skin in the visible and near-infrared spectral range,”
J. Biomed. Opt., 11
(6), 064026
(2006). https://doi.org/10.1117/1.2398928 1083-3668 Google Scholar
L. Brancaleon, A. J. Durkin, J. H. Tu, G. Menaker, J. D. Fallon, and N. Kollias,
“In vivo fluorescence spectroscopy of nonmelanoma skin cancer,”
Photochem. Photobiol., 73
(2), 178
–183
(2001). https://doi.org/10.1562/0031-8655(2001)073<0178:IVFSON>2.0.CO;2 0031-8655 Google Scholar
I. Pavlova, K. Sokolov, R. Drezek, A. Malpica, M. Follen, and R. Richards-Kortum,
“Microanatomical and biochemical origins of normal and precancerous cervical autofluorescence using laser-scanning fluorescence confocal microscopy,”
Photochem. Photobiol., 77
(5), 550
–555
(2003). https://doi.org/10.1562/0031-8655(2003)077<0550:MABOON>2.0.CO;2 0031-8655 Google Scholar
T. Collier, D. Arifler, A. Malpica, M. Follen, and R. Richards-Kortum,
“Determination of epithelial tissue scattering coefficient using confocal microscopy,”
IEEE J. Sel. Top. Quantum Electron., 9
(2), 307
–313
(2003). https://doi.org/10.1109/JSTQE.2003.814413 1077-260X Google Scholar
P. Wilder-Smith, K. Osann, N. Hanna, N. El Abbadi, M. Brenner, D. Messadi, and T. Krasieva,
“In vivo multiphoton fluorescence imaging: A novel approach to oral malignancy,”
Lasers Surg. Med., 35
(2), 96
–103
(2004). https://doi.org/10.1002/lsm.20079 0196-8092 Google Scholar
C. K. Brookner, M. Follen, I. Boiko, J. Galvan, S. Thomsen, A. Malpica, S. Suzuki, R. Lotan, and R. Richards-Kortum,
“Autofluorescence patterns in short-term cultures of normal cervical tissue,”
Photochem. Photobiol., 71
(6), 730
–736
(2000). https://doi.org/10.1562/0031-8655(2000)071<0730:APISTC>2.0.CO;2 0031-8655 Google Scholar
|


