|
|
|
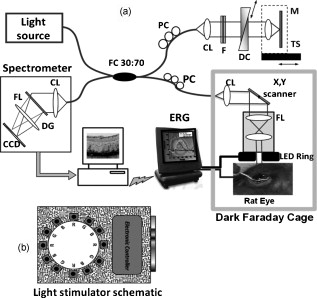
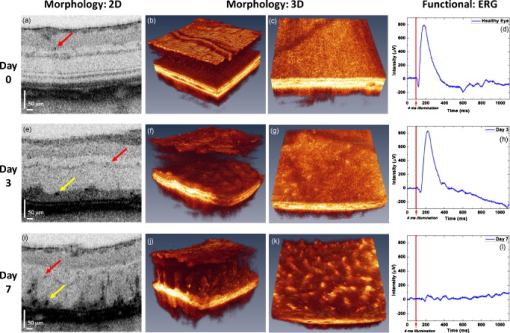
Neurodegenerative retinal diseases, such as age-related macular degeneration (AMD), diabetic retinopathy, and glaucoma, cause both morphological and physiological changes in the retina at different stages of their development. The dynamic relationship between structural and functional abnormalities in diseased retinas is still not well understood. Rodent (normal and transgenic mice, and rat) models of retinal diseases are well established research tools for studying the origins and stages of the progression of retinal diseases.1, 2 Technologies such as confocal scanning laser ophthalmoscopy3 (CSLO) and optical coherence tomography4 (OCT) are currently used for in vivo morphological imaging of the rodent retina. Full-field electroretinography (ERG) recordings5 are used for in vivo assessment of impaired physiological response of the retina to light stimulation in rodents. When multiple measurement modalities are applied sequentially to the same animal in a longitudinal study, direct correlation between the changes in retinal structure and physiological response in terms of their spatial location and time evolution is very challenging. Furthermore, sequential measurements increase the overall measurement time and require relocation and repositioning of the animal, which can interfere with the anesthesia. Here we present the first (to our knowledge) combined ultrahigh resolution optical coherence tomography system, designed for simultaneous probing of retina structure and function in the rodent eye. The results presented here demonstrate the potential of the combined system to enable improved understanding of the dynamic relationship between structure, physiology and metabolism of healthy and diseased rodent retinas. A schematic of the combined imaging system is presented in Fig. 1 . The UHROCT system is based on a fiber optic Michelson interferometer connected to a superluminescent diode (SLD, Superlum Limited, County Cork, Ireland, , ). A system operating in the spectral region is chosen to insure that the imaging beam will not visually stimulate the retinal photoreceptors. Details about the UHROCT system core design and performance have been published previously.6 With a imaging beam incident on the cornea, the resolution in the rat retina is . The UHROCT system sensitivity is for power at the rat cornea. The interference signal is detected with an InGaAs camera (SUI, Goodrich, Princeton, New Jersey) with a readout rate. Fig. 1(a) Schematic of the combined UHROCT and ERG system: (CL) collimating lenses, (DC) dispersion compensation unit, (NDF) neutral-density filters, (FOI) fiber optic isolator, (M) mirror, (PC) polarization controllers, (SLD) superluminescent diode, and (TS) translation stage. The spectrometer consists of a collimating lens (CL), a volumetric diffraction grating (DG), a focusing lens (FL), and a high speed InGaAs camera. (b) Schematic of the light stimulator consisting of 12 single color LEDs (B blue, G green, and R red).  A light stimulator designed in the shape of a ring [Fig. 1] containing 12 LEDs (red, blue, and green) and covered with a diffuser is used to provide uniform, full-field illumination of the rat retina. A center hole in the ring provides a clear path of the imaging beam. The stimulator is mounted coaxially to the distal end of the UHROCT imaging probe (a pair of lenses, Edmund Optics, Barrington, New Jersey, , ), to ensure full overlap between the illuminated and imaged areas in the rat retina. A commercial ERG system (Diagnosys LLC, Littleton, Massachusetts) is combined with the UHROCT system, and both the light stimulus onset and the acquisition of the optical and electrical data are synchronized. A solid, grounded Faraday cage provides a dark environment for the optical and ERG recordings and reduction of the ambient electromagnetic noise. Healthy female Long Evans rats were used in this study, which was approved by the Animal Research Ethics review board of the University of Waterloo. The animals were anaesthetized with intraperitoneal injections of ketamine and xylazine , and dark adapted for prior to the experiments. Pupil dilation was achieved by using 1 to 2 drops of Tropicamide (1% Mydriacyl) per eye. An ERG electrode in the shape of a loop was placed gently on the rat’s cornea, while ground and reference electrodes were inserted in the animal’s mouth and behind the ear, respectively. Subsequently, the rats were placed on the holder inside the dark Faraday cage. During the imaging procedure, the rat corneas were hydrated by frequent administration of artificial tear drops. Outer retinal degeneration was induced by intravenous injection of , administered on day 0 (baseline). Three-dimensional UHROCT tomograms (1000 A- B- ) were acquired from the rat retina on days 0 (baseline), 3, and 7 of the study. These were followed by 2-D images acquired synchronously with a single white light flash ( intensity and duration) and simultaneous ERG recordings. A fixed gain of 100 was applied to the ERG data. Multiple recordings were acquired from the same eye with pause in-between to allow for recovery of the retina. The UHROCT tomograms were processed with Matlab (Natick, Massachusetts) and Amira (San Diego, California). UHROCT and ERG recordings were acquired simultaneously from healthy (day 0) and damaged (days 3 and 7 post- injection) rat retinas, and representative results from this study are summarized in Fig. 2 . A cross sectional image of a healthy rat retina acquired away from the optic disk [Fig. 2] demonstrates the ability of the UHROCT system to visualize clearly all retinal layers and small capillaries (red arrow) in the inner and outer plexiform layers. Note that the photoreceptor layer consists of two pairs of light and dark bands, corresponding to the photoreceptor inner (IS) and outer (OS) segments, respectively. Figure 2 shows the healthy retina structure in 3-D ( area), while Fig. 2 shows a cross section of the 3-D image stack at a plane, corresponding to the photoreceptor IS/OS junction. Figure 2 shows an en-face image of the IS/OS photoreceptor junction, which closely resembles the photoreceptor mosaic. Figure 2 shows a representative ERG trace acquired from the healthy rat retina (day 0). The red line marks the timing and duration of the light flash. Fig. 2Summary of the UHROCT morphological and ERG physiological data. Representative 2-D cross sectional [(a), (e), and (i)], 3-D [(b), (f), and (j)], and 2-D en-face [(c), (g), and (k)] images of area of the rat retina acquired on days 0, 3, and 7 of the study. Red arrows indicate capillaries in the inner and outer plexiform layers, while the highly reflective cellular debris in the IPL and OPL are indicated with yellow arrows. Representative ERG traces were acquired on days 0 (d), 3 (h) and 7 (l) of the study. The red line indicates the timing of the light flash. (Color online only.)  Figure 2 shows a representative 2-D tomogram of the rat retina after injection of . The tomogram shows loss of the external limiting membrane (ELM), disruption of the multilayered structure of the photoreceptor IS and OS, which were both clearly visible on day 0 of the study, and highly reflective spots in the photoreceptor layer (yellow arrow). The morphological changes corresponding to partial degeneration of the outer retina are better observed in three dimensions, which show modulations at the photoreceptor layer [Fig. 2] as well as bright and dark spots at the plane corresponding to the photoreceptor IS/OS junction [Fig. 2]. Although the UHROCT tomograms clearly show changes in the structural integrity of the outer rat retina, the ERG traces acquired on day 3 show distinct a- and b-waves [Fig. 2], indicating that at least some of the photoreceptors and bipolar cells are still functioning. Figure 2 shows a representative 2-D tomogram of the rat retina after injection of . The tomogram shows almost complete loss of the photoreceptor layer, highly reflective spots (yellow arrow), as well as disruption in the structural integrity of the outer nuclear (ONL) and inner plexiform (IPL) layers. The 3-D images show columns of highly reflective material in the ONL and photoreceptor layers [Fig. 2]. These structural changes appear as bright and dark spots at the photoreceptor IS/OS junction [Fig. 2]. The corresponding ERG trace shows complete loss of the a- and b-waves [Fig. 2], indicating that the rat retina is no longer responsive to light stimulation. Results from day 0 of the study show excellent correlation between the structural integrity and the light-induced physiological response of the healthy rat retina. The magnitude and timing of the a- and b-waves in the ERG recording [Fig. 2] are typical and similar to previously published results.7 The UHROCT images show fine details of the healthy retina structure similar to those published at 6 and .8 Results from day 3 of the study show loss of the ELM and the layered structure of the photoreceptors; the pairs of bright and dark bands, corresponding to the IS and OS, are no longer visible. This suggests that the IS and OS of most of the photoreceptor cells have been disrupted on a subcellular level. The highly reflective spots observed in the photoreceptor layer [Fig. 2, yellow arrow] are potentially disrupted retinal pigment epithelial (RPE) or inflammatory cells. Similar changes were observed in hematoxylin and eosin (HE) histological cross sections in previously published studies7 of -induced outer retinal degeneration in the rat retina. The ERG recordings at day 3 of the study show a- and b-waves; however, the decreased peak magnitude, as well as the latency of the a- and b-wave peaks as compared to day 0, suggests damage to the remaining photoreceptor population. The UHROCT tomograms from day 7 of the study show complete disintegration of the photoreceptor layer, gaps in the RPE, larger clusters of highly reflective material that extend to the inner retinal layers, as well as disruption of the structural integrity of the ONL and IPL. These observations correlate very well with HE histological findings published previously.7 The ERG recordings show no electrical activity in the retina, suggesting complete loss of photoreceptor functionality, which correlates well with the structural changes presented in this work, as well as with previously published ERG studies.7 We have developed the first combined UHROCT and ERG system designed for simultaneous probing of the rodent retina structure and functional response to light stimulation. Results obtained in vivo from healthy and degenerated rat retinas show correlation between the structural integrity and the normal/abnormal light-induced physiological response of the retina. AcknowledgmentThe authors would like to acknowledge the in-kind support provided by Diagnosys LLC. This work was supported in part by research grants from the Natural Sciences and Engineering Research Council (NSERC) and the Ontario Centers of Excellence (OCE). ReferencesJ. M. Barnett, S. E. Yanni, and J. S. Penn,
“The development of the rat model of retinopathy of prematurity,”
Doc. Ophthalmol., 120
(1), 3
–12
(2010). https://doi.org/10.1007/s10633-009-9180-y 0012-4486 Google Scholar
C. J. Zeiss,
“Animals as models of age-related macular degeneration; an imperfect measure of the truth,”
Vet. Pathol., 47
(3), 396
–413
(2010). https://doi.org/10.1177/0300985809359598 0300-9858 Google Scholar
C. Leung, J. Lindsey, L. Chen, Q. Liu, and R. Weinreb,
“Longitudinal profile of retinal ganglion cell damage assessed with blue-light confocal scanning laser ophthalmoscopy after ischaemic reperfusion injury,”
Br. J. Ophthamol., 93 964
–968
(2009). https://doi.org/10.1136/bjo.2008.150482 0007-1161 Google Scholar
M. D. Fischer,
“Noninvasive, in vivo assessment of mouse retinal structure using optical coherence tomography,”
PLoS ONE, 4
(10), 1
–7
(2009). https://doi.org/10.1371/journal.pone.0005361 1932-6203 Google Scholar
B. Xie,
“A novel middle-wavelength opsin (M-opsin) null-mutation in the retinal cone dysfunction rat,”
Exp. Eye Res., 91 26
–33
(2010). https://doi.org/10.1016/j.exer.2010.03.017 0014-4835 Google Scholar
S. Hariri, A. A. Moayed, A. Dracopoulos, C. Hyun, S. Boyd, and K. Bizheva,
“Limiting factors to the OCT axial resolution for in vivo imaging of human and rodent retina in the wavelength range,”
Opt. Express, 17
(26), 24304
–24316
(2009). https://doi.org/10.1364/OE.17.024304 1094-4087 Google Scholar
K. Ohtaka, S. Machida, T. Ohzeki, M. Tanaka, and D. Kurosaka,
“Protective effect of hepatocyte growth factor against degeneration of the retinal pigment epithelium and photoreceptor in sodium iodate—injected rats,”
Curr. Eye Res., 31 347
–355
(2006). https://doi.org/10.1080/02713680600629797 0271-3683 Google Scholar
V. J. Srinivasan,
“Noninvasive volumetric imaging and morphometry of the rodent retina with high-speed, ultrahigh-resolution optical coherence tomography,”
Invest. Ophthalmol. Visual Sci., 47
(12), 5522
–5528
(2006). https://doi.org/10.1167/iovs.06-0195 0146-0404 Google Scholar
|

