
|
|
1.IntroductionThe use of optical tweezers to carry out contactless manipulation of biological matter under physiological conditions has widespread implications and, as a result, optical trapping technology has been extensively used for manipulation of cells and quantitative studies of the cell membrane.1 Elasticity of red blood cells (RBCs) is mainly related to membrane properties that have long been of interest to both biologists and physicists. The ability to undergo shape deformation under shear flow conditions constitutes an important attribute of RBCs in circulatory dynamics2 as it is intricately related to the cell’s oxygen-carrying capability. The biomechanical properties of RBCs are also interesting and important from the standpoint of rheological and fundamental behavior in the cardiovascular system.3, 4 The relatively recent development of dual-beam optical tweezers5, 6, 7, 8, 9 and combinations of trap technology with fluorescence and liquid flow methods10 has further enhanced the use of optical methods in this emerging area of importance in contemporary cell biology. It is known that the normal biconcave shape of an RBC changes with physiochemical conditions, including those that are optically induced.11 This applies to normal (healthy) cells as well as those that are infected by parasites. In previous work on healthy and malaria-infected RBCs, it was established that optical trapping is accompanied by shape distortion (buckling), such that the original disklike cell folds into a rodlike shape.12 This folding action was rationalized in terms of Euler buckling13 related to the elastic properties of the cell membrane. Quantification of the membrane shear modulus of a single, fluorescently labeled RBC has now been shown to be possible.10 Alterations in the shape of microscopic objects can affect their dynamic behavior in an optical trap, with propeller-type shapes resulting in rotational motion. In earlier work reported from our laboratory,12 we showed that malaria-infected cells rotated with linearly polarized light but normal cells did not. We attributed this to the malarial parasite inducing changes in cell membrane elasticity that lead to changes in cell morphology. The latter results in folding accompanied by twisting on irradiation of the cell by laser light in a trap, leading to rotational motion.12 We now show that the malarial parasite is not the only agent that can induce appropriate morphological changes in the cell: these can also be induced by altering the properties of the medium in which the cells are floating. And this is precisely what this work demonstrates. Rotational motion can be achieved with morphologically distorted healthy cells by appropriate “engineering” of the osmolarity of the medium in such a fashion that the rotational motion of malarial cells can be mimicked by healthy cells. The key to achieving rotational motion of trapped RBCs is the shape distortion: it does not seem to matter if the distortion is induced by a parasite or by medium properties. We achieve shape engineering either by altering the hyperosmotic stress the cells are subjected to or by introducing different ions in the suspension medium. The results that we report here show that hyperosmotic stress induces shape anisotropies that, in turn, induce the rotational motion. What effect hyperosmotic stress has on the shape of a cell has been a source of some ambiguity in recent literature, with claims being made that under different osmolarities the trapped RBC maintains its shape,14 and counterclaims that osmolarity does, indeed, lead to changes in shape of the cell.15 Data that we present in this paper lends support to the latter and not the former. Additionally, we probe the effect of the medium’s viscosity on cell rotation. We model the observed rotations using a Langevin-type equation of motion that takes into account frictional forces that are generated as RBCs rotate in the medium. We observe good correlation between our measured data and calculated results. The experiments that we report in this paper were conducted using both human RBCs and those obtained from mice. The latter enable us to access higher values of parasitemia than is possible with human RBCs, thereby enabling higher levels of accuracy in the data that we report in this paper. 2.Experimental Details2.1.Sample Preparation of Human RBCsBlood samples from humans were collected in a sterile tube containing the anticoagulant ACD (anticoagulant citrate dextrose; glucose, citric acid monohydrate, and sodium citrate) and centrifuged at for . The plasma and buffy coat containing white blood cells were aspirated out, and purified erythrocytes were washed with sterile RPMI (Roswell Park Memorial Institute; Life Technologies, Inc.) medium with , HEPES, and gentamycin sulphate. The erythrocytes were resuspended in sterile RPMI medium containing 0.5% albumax (Life Technologies, Inc.) as a 50% v/v suspension, and stored at . Before imaging, RBCs were pelleted at for , resuspended in solution at a dilution of about , from which was used on a microscope slide with a coverslip for imaging. Before loading the RBCs, the coverslip was coated with a thin layer of 10% BSA (bovine serum albumin; in doubly distilled water), which prevented any RBC from adhering to the glass surface. To create solutions of different viscosities, blood cells were resuspended in PBS (phosphate-buffered saline) solution composed of NaCl , KCl , , and with increasing concentrations of BSA from 0 to 10%. To create different osmolarities, PBS solution was diluted with dd/w (double distilled water). To check the effect of different ions, stock solutions of PBS, HEPES, NaCl, and were diluted with doubly distilled water to an osmolarity of . 2.2.Sample Preparation of Mouse-Plasmodium-Infected RBCsP.yoelli 17XL strain was maintained by passaging asexual stages through BALB/c mice. Tail bleeds were collected from mice showing approximately 20 to 40% peripheral blood parasitemia (typical parasitemia in human RBCs is ), and diluted 1:10 in incomplete RPMI. About of this dilution was injected intraperitoneally into naive BALB/c mice for the expansion of parasites. Parasitemia was monitored by microscopic examination of blood smears stained with Giemsa. Blood samples from mice were collected in a sterile tube containing the anticoagulant ACD ( glucose, citric acid monohydrate, and sodium citrate) and centrifuged at for . The plasma and buffy coat containing white blood cells were aspirated out and purified erythrocytes were washed with sterile RPMI (Life Technologies, Inc.) medium with , HEPES, and gentamicin sulphate. The erythrocytes were resuspended in sterile RPMI medium containing 0.5% albumax (Life Technologies, Inc.) as a 50% v/v suspension, and diluted for use. NRBCs were obtained from uninfected and IRBCs from infected mice. Before carrying out experiments, the RBCs were diluted to and stained with DAPI for nuclear labeling ( in RBC suspension for , wash twice with RPMI). 2.3.Optical Tweezers SetupThe single-beam optical trap used in these studies was described earlier.16 In brief, the optical trap is formed using a diode-pumped Nd-YAG laser beam (at a wavelength) with a mode profile. The laser beam is focused with a [numerical aperture ] oil-immersed objective onto a sample which is placed on an inverted microscope (Nikon TE2000-U). The laser power was limited to to avoid possible damage to the trapped RBCs. At these power levels, typical values of trap stiffness achieved in our apparatus were along the direction and along the orthogonal direction. Direct imaging of the trapped cells enabled us to make real-time measurement of rotational speed and cell folding time. We considered the possibility that the medium’s absorbance of laser light might induce thermal effects that, in turn, might affect the trapping and rotational dynamics of RBCs. We made careful measurements of the extinction coefficient of the medium at over a range of osmolarities and found that there is negligible absorption of light by the medium. 2.4.Assessment of Perturbed Cells, Percentage of Rotating Cells, and Rotation SpeedAbout of suspension was placed on a coverslip. Typically, an RBC placed in the trap moves toward the trap focus and folds into a rodlike shape under the influence of the trap. The RBC was allowed to remain in the trap for several seconds to record any rotation that occurred. These events were recorded for several RBCs using a CCD camera interfaced with a computer. Several fields of RBCs were also scanned to look at any shape changes in the RBCs. Subsequent analysis was performed by analyzing the movies in real time to measure percentage of rotation in total trapped cells. The rotation speed was calculated for each individual rotating RBC by taking the average of several rotation periods and converting it to rotation per minute (rpm). RBC populations were visually analyzed to identify different subsets of perturbed cells. 2.5.Statistical AnalysisAnalysis was performed using standard statistical techniques and Graphpad Instat software. The data sets were first checked for normality by the standard Kolmogorov-Smirnov method. Data sets that passed the normality test were further tested using a one-way analysis of variance (ANOVA) followed by Tukey-Kramer’s multiple comparison tests. If the data sets failed the normality test, further testing was done using a Kruskal-Wallis test followed by Dunn’s nonparametric test. All tests were two-tailed. 3.Results and DiscussionWe have conducted measurements to probe the effect of changes in osmolarity on the shape of the RBC. The trapped cell’s rotation was used as a diagnostic of shape change. Figure 1 summarizes how RBC shapes alter as the osmolarity of the suspension medium changes over the range . It is clearly seen that under hypotonic conditions there is considerable lysis, and the cells swell to a spherical shape (S). In case of cells experiencing isotonic conditions , most maintain their biconcave shape (D), with a small percentage of cells (1 to 5%) adopting flattened and blebbed morphology. Under hypertonic conditions, the RBCs show mixed shapes, which can be slightly perturbed (P1), moderately perturbed (P2), or highly perturbed (P3). At even higher osmolarities (900 and ) mostly perturbed forms were observed. We studied the effect of different morphologies or shape changes on the folding as well as the rotational behavior of the RBCs when they were subjected to optical forces within the focal volume of our trap. Fig. 1(a) Images of different healthy human RBCs (untrapped) observed under different osmolar conditions. With increase in osmolarity RBCs become increasingly deformed/disrupted (see text): S, spherocyte; D, discocyte; P1, mildly perturbed; P2, moderately perturbed; P3, highly perturbed. Most perturbed cells represent different stages of echinocytes. (b) Distribution of cell shapes at various osmolarities.  We first considered the folding behavior of both the normal RBCs and shape-deformed RBCs. At , the cells neither fold nor rotate in the trap. We observed that under isotonic conditions , most of the cells have biconcave shape and on trapping, they fold into a rodlike shape (see Fig. 2 ), which then aligns along the direction of the optical field vector. On the other hand, under hypertonic conditions , cells become flattened and blebbed; they fold and acquire a twisted shape (Fig. 2). Fig. 2Images of trapped healthy and disrupted/deformed (rotating) human RBCs before and after folding. The healthy cells were kept in isotonic conditions , while the deformed cells were kept in hypertonic conditions .  Considerable evidence, particularly in the form of real-time movie clips, now exists to show that normal (healthy) RBCs kept under physiological conditions undergo folding action on being exposed to the focal volume of an optical trap; a theoretical model based on Euler buckling13 was developed that succeeds in accounting for cell folding that has been experimentally observed. Over and above the folding action, note that RBCs are also known to undergo flipping and rolling action but only under fluid flow conditions; indeed, it was demonstrated in earlier work17 that the propensity of RBCs to undergo flipping and rolling under flow conditions is enhanced in the case of malaria-infected cells. In the context of our static optical trap under appropriate conditions, the trapped cells undergo folding and twisting (see Fig. 3 ); these twisted cells start rotating about the polarization direction of the optical field, either in clockwise or anticlockwise fashion. Occasionally we observe cells that can be made to rotate in a controlled fashion in either direction by changing the focus of the trap. In Fig. 4 we quantify the percentage of cells that (1) are shape deformed (perturbed) and (2) rotate in the trap. We also quantify [in Fig. 4] the rotation speeds at different osmolarities. Note that none of the RBCs rotate under isotonic conditions , irrespective of their morphology. As the osmolarity increases from , the percentage of rotating cells increases linearly (from 20 to 90%). The percentage of perturbed cells shows a similar trend (36 to 100%). Note that not all of perturbed cells rotate [Fig 4]. This observation contradicts earlier claims15, 18 regarding the relationship between cell rotation and the morphology of RBCs. Our data show that rotation speed increases with osmolarity over the range [Fig. 4]. Fig. 4Behavior of human RBCs at different osmolarities in PBS (data for hypotonic not shown due to lysis and absence of folding/rotation; rotation is also entirely absent in isotonic condition): (a) percentage of cells with shape deformation (perturbed cells) and percentage of cells rotating and (b) rotation speed (in rotations per minute) at different values of osmolarity. Note that the increase in percentage of perturbed cells correlates with increase in rotating cells. ( value: .)  We also studied the role played by different ions in the suspension medium on RBC shapes and rotation dynamics. Our experiments are carried out at using different solutions (PBS, NaCl, , , and HEPES). The results are summarized in Fig. 5 . As is seen in Fig. 5, the percentage of perturbed cells at different stages of malarial infection changes drastically in different solutions. From PBS to NaCl to the percentage of highly perturbed cells increases steadily. However, in the presence of both NaCl and , the total percentage of perturbed cells drops drastically, with highly perturbed cells almost completely disappearing. HEPES also shows a very low percentage of perturbed cells. Percentages of rotating cells remain more or less constant for PBS, NaCl and [Fig. 5]. Surprisingly, the percentage of rotating cells decreases only marginally in the presence of both NaCl and . Thus, almost 50% of rotating cells have a normal morphology. However, in the presence of HEPES, rotation percentage decreases drastically. Rotation speed remains constant for PBS and NaCl but decreases sharply for [Fig. 5]. In the presence of both NaCl and rotation speed shows a partial recovery but decreases very drastically in HEPES. Fig. 5(a) Percentage of deformed (perturbed) human RBCs for different buffer solutions. Cells suspended in PBS at (isotonic) were used as control. (b) Percentage of rotating cells and (c) rotation speed for different buffer solutions. (d) Variation of rotation speed with BSA viscosity; rotation speed seems to be inversely proportional to viscosity. ( value: .) 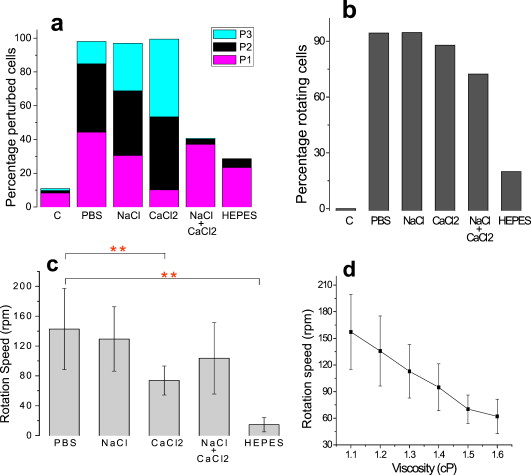 These results imply that rotation and the underlying changes in RBCs are highly dependent on ions present in the external medium. It is especially known that influx in RBCs leads to shape changes. This might explain the increase in highly perturbed cells in the presence of . The decrease in rotation speed implies that highly perturbed cells have a poor propensity for rotation. However, we do not know the reason for the contradictory behavior observed in the presence of both NaCl and . Observations in HEPES could be due to its zwitterionic nature. Thus, the presence of ions with a net charge is essential for osmolarity-induced rotation and the underlying RBC changes, implying that increase in osmolarity alone cannot account for the rotational behavior of RBCs. We believe that ionic flux in RBCs is crucial in the rotational dynamics. Further experiments are being performed in this direction. We also looked at the functional relationship between viscosity of the surrounding medium and the rotational speed of RBCs [Fig. 5]. The viscosity of PBS was altered by adding different concentrations of BSA (2 to 12%), which did not alter the osmolarity in any way. We observed that as the medium viscosity increases, rotational speed decreases. In earlier studies on malaria-infected RBCs reported from our laboratory12 it was inferred that malarial infected RBCs could rotate in the optical trap. Such an inference was based on the observation that normal RBCs do not rotate, while a small subset of infected population of RBCs rotate. Furthermore, these experiments were carried out under physiologically relevant isotonic osmolarity. To ascertain the identity of rotating cells we combined use of fluorescence microscopy and optical trapping,10 and assessed the population of malarial infected cells (IRBCs) as well as normal (healthy) RBCs for rotational properties. Once again we note that uninfected RBCs do not rotate, while a subset of the IRBCs rotate. We present here data from IRBCs collected from malaria-infected mice, which were fluorescence labeled in our combination setup of fluorescence microscope and optical tweezer (Fig. 6 ). This enabled us to distinguish between parasitized (PRBCs) and unparasitized RBCs (URBCs) within the set of rotating IRBCs [Fig. 6]. PRBCs are cells labeled with fluorescence (DAPI nuclear dye) due to presence of the intracellular parasite, while URBCs are cells present in the IRBC population but not having any fluorescence signal indicative of intracellular parasites. We observed that both URBCs and PRBCs can rotate in the trap, provided their membranes are visibly perturbed. The rotation speed of the cells [Fig. 6] was observed to be stage dependent, with the maximum speed for URBCs and early stage PRBCs and decreases drastically for mature stage PRBCs. The proportion of different cells among total cells observed to rotate is plotted as percentage of cells rotating [Fig. 6]. It is observed that URBCs and PRBCs contribute equally to the rotating cells, and that the different stages of maturity of the parasite does not affect the propensity of the PRBC to rotate. Normal RBCs from uninfected mice did not exhibit rotation (data not shown). Fig. 6Rotation of mouse RBCs in a P. yoelli 17XL infected population ( parasitemia): (a) images of RBCs in the bright field (i) and under UV fluorescence (ii), (b) rotation speed of different RBCs, and (c) proportion of different RBCs of total number of RBCs that rotate. ( value: .) URBC, uninfected RBCs; R-PRBC, ring (early stage of PRBCs); T-PRBC, trophozoite (later stage of PRBCs); S-PRBC, schizont stage (mature PRBCs). 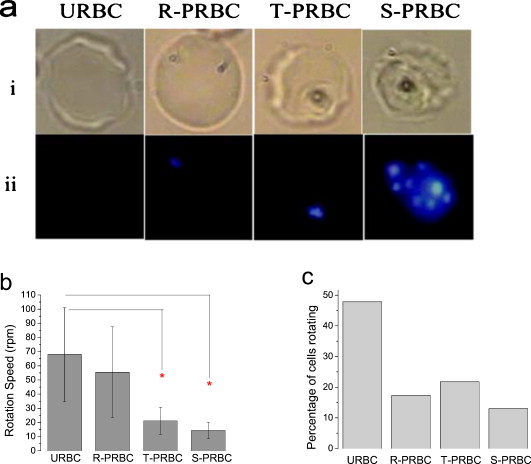 We attempted to develop theoretical insight into the observed RBC rotational dynamics by an analysis that utilizes a Langevin-type equation. We extracted the rotation angle of a red blood cell from the individual frames of a typical movie. As indicated in Fig. 7 , is the angle between the polarization direction of the optical field (red solid line) and the long-axis of the folded red blood cell (purple dotted line). Experimental data on the time-dependent rotational angle are shown in Fig. 7: the rotational motion of RBCs appears to be slightly modulated. In addition to an overall linear increase in (linear trend), modulation occurs regularly twice per rotation, indicating that the rotation is accelerated and then decelerated, and this process of acceleration and deceleration is repeated twice per single rotation, as shown by the existence of two humps per single rotation in Fig. 7 (three blue arrows). Fig. 7(a) Definition of the rotational angle of an optically trapped RBC, (b) experimental data showing RBC rotation in a linearly polarized light field, and (c) a rigid-rod model of a deformed RBC. Note that if is different from , the model system is birefringent. 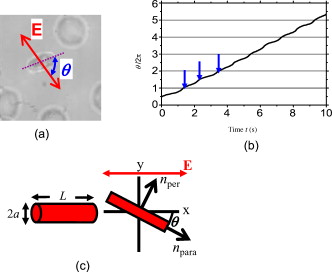 We modeled a deformed rodlike RBC as a rigid birefringent substance [Fig. 7], with radius , length , and mass . The values for and are typical of RBCs. We assumed that the diameter of the deformed (twisted) RBC was twice as large as the thickness of the biconcave-shaped RBC. An equation of rotational motion of RBCs with a frictional force can be expressed as where the moment of inertia is taken to beThe first term on the right of Eq. 1 describes frictional dissipation of rotation due to inelastic interactions with solvents in the suspension medium. The friction coefficient denoted as is given for the rod model bywhere is the viscosity of the suspension medium, for which we simply used the value of water at , . For the present model, .The second term on the right of Eq. 1 represents an alignment (orientation) force; this is the driving term that originates from interactions between RBCs and the linearly polarized laser beam, as discussed in earlier papers.12 The interaction energy is estimated by taking the average of the induced polarization energy over one optical cycle and is shown to be proportional to . We can also evaluate the angular momentum of the transmitted light under the assumption that each RBC is a rigid, transparent, birefringent substance. The reactive torque exerted on the rigid rod is proportional to , which is equivalent to the presence of an interaction energy that is proportional to . We denote the proportionality constant of torque by . The third term in Eq. 1 is due to a torque that drives continuous rotations and controls the rotational direction of RBCs. Without the third term, RBCs can be oriented only by applying linearly polarized laser beams, but not rotated. By changing its sign the rotational vector can be reversed. The term originates from the twisted structure of a deformed RBC; detailed discussions on will be presented elsewhere. Figure 8 shows the time-dependent rotational angle obtained by using a linear fitting procedure omitting the modulation-like behavior, that is, . Here is the global, rotational speed of RBCs. In Fig. 8, the red straight line denotes the fitted values within the linear approximation and the black line shows the global experimental ones [Fig. 7]. From the best fitting procedure, the speed of rotation of the RBCs is estimated to be . Fig. 8(a) Linear drift (red line) and experimental data (black line) for RBC rotation and (b) oscillatory part in the RBC rotation in units of (the amplitude corresponds to ): experimental data, blue line; best-fitted data, red line. (Color online only.) 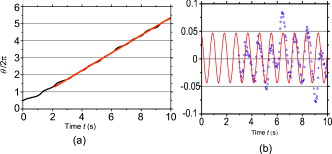 We now take into account the modulation behavior seen in Fig. 7. In Fig. 8, circles show differences in rotational angles between the measured and simulated values within the linear approximation. The solid line in Fig. 8 denotes the fitting values by assuming that the difference is proportional to a cosine function with amplitude , The following approximate relations are obtained by inserting Eq. 4 into Eq. 1:From the results of fitting, we obtain and . For these parameters, the condition that holds. Under this condition, Eq. 4 satisfies Eq. 1 and the relations in Eqs. 5, 6, 7 hold; the rotational dynamics is independent of the value of . Note that Eq. 5 with Eq. 3 clearly indicates that the RBC rotation speed is inversely proportional to viscosity. This prediction qualitatively agrees with the results of measurements that we report in Fig. 4. The relation in Eq. 6 means that modulation occurs regularly twice per rotation. We derived the following formula for on the basis of the birefringent rod model: Here is the permittivity of the RBC, is the wavelength of the laser field , is the electric field strength, and is defined as , where and are the refractive indices defined in Fig. 7. We used the following values to estimate the birefringence by utilizing Eq. 8. The relative permittivity of the RBC is approximated by , where is the averaged refractive index of the RBC . The light intensity is , which is equivalent to in the RBC. For the obtained value , we estimated to be . This value is of the same order as quartz ( of calcite ; quartz ; ice ).From a comparison between the experimental results and those that we calculated using our model, the following observations can be made. The deviation of the fit from the experimental data in Fig. 8 is due to a fluctuation in the rotational period. In the range between and , the average period is ; in the range between and , the period is . This fluctuation is unavoidable in a medium. If these values are used for the individual ranges, the phases of the fit and measured data are found to agree with each other. Equation 1 indicates that there exist two types of torque that are experienced by the trapped RBC: alignment torque associated with the second term on the right-hand side of Eq. 1 and torque that generates continuous rotation, represented by the third term of Eq. 1. We assumed that the alignment torque originates from birefringence (which just steers the axis of the larger refractive index toward the potential minimum of the optical trap) and the continuous torque originates mainly from the deformed shape of RBC (with optical pressure or local flow). The ratio between the two torques [Eq. 7] can be obtained by the present fitting procedure, as shown in Fig. 8. The model that we present is also applicable to RBC rotation induced by shape changes via a reengineered suspension medium. Our model specifically takes account of the experimentally observed acceleration before, and deceleration after, the long axis of the shape-distorted RBC turns to the direction of the polarization vector of the optical field in the case of noninfected but shape-distorted cells. Birefringence and friction are treated as parameters in our theoretical model. We already noted that Eq. 5, taken together with Eq. 3, clearly indicates that the RBC rotation speed is inversely proportional to viscosity of the suspension medium, as demonstrated experimentally [Fig. 5]. 4.SummaryWe probed the rotation of healthy RBCs under hyperosmotic stress and studied the effect of different ions and viscosity of the suspension medium on the rotational dynamics. The key finding to emerge from our studies is the following: our experimental data suggest that hyperosmotic stress induces shape anisotropies in normal RBCs that, in turn, lead to rotational motion of trapped cells. We modeled such rotational motion within a Langevin approach, using an equation of motion that takes into account frictional forces that are exerted on the rotating RBCs in the fluid; good correlation was obtained between experimental and calculated results. This paper extends and complements earlier observations reported from our laboratory12 that malaria-infected RBCs underwent rotation in an optical trap when linearly polarized light was used. In these earlier experiments, it was the malarial parasite that was the agent for causing shape changes in the RBCs. In this study, we have further dissected out the rotation properties of parasite-infected RBCs, as well as unparasitized RBCs, and we now document the observation that changes in cell shape also contribute to rotation of trapped RBCs. We were able to engineer such shape changes by altering the physical conditions, namely, osmolarity, of the medium containing the cells. It would clearly be of interest to carry out further work to separate the relative contribution of parasite-induced shape alterations and osmolarity-driven shape changes in the rotational dynamics of malaria-infected RBCs. AcknowledgmentsWe acknowledge the assistance of Sunando Roy in the early stages of this work and Himanish Basu for making absorption measurements. ReferencesA. Ashkin, J. M. Dziedzic, J. E. Bjorkholm, and S. Chu,
“Observation of a single-beam gradient force optical trap for dielectric particles,”
Opt. Lett., 11 288
–290
(1986). https://doi.org/10.1364/OL.11.000288 0146-9592 Google Scholar
N. Watanabe, H. Kataoka, T. Yasuda, and S. Takatani,
“Dynamic deformation and recovery response of red blood cells to a cyclically reversing shear flow: effects of frequency of cyclically reversing shear flow and shear stress level,”
Biophys. J., 91 1984
–1998
(2006). https://doi.org/10.1529/biophysj.105.060236 0006-3495 Google Scholar
M. Bessis, N. Mohandas, and C. Feo,
“Automated ektacytometry: a new method of measuring red cell deformability and red cell indices,”
Blood Cells, 6 315
–327
(1980). 0340-4684 Google Scholar
A. Bransky, N. Korin, A. Leshansky, N. Lanir, Y. Nemirovski, and U. Dinnar,
“The rheologic properties of erythrocytes: a study using an automated rheoscope,”
Rheol. Acta, 46 621
–627
(2007). https://doi.org/10.1007/s00397-006-0146-7 0035-4511 Google Scholar
K. Visscher, S. P. Gross, and S. Block,
“Construction of multiplebeam optical traps with nanometer-resolution position sensing,”
IEEE J. Sel. Top. Quantum Electron., 2 1066
–1076
(1996). https://doi.org/10.1109/2944.577338 1077-260X Google Scholar
L. P. Faucheux, L. S. Bourdieu, P. D. Kaplan, and A. Libchaber,
“Optical thermal ratchet,”
Phys. Rev. Lett., 74 1504
–1507
(1995). https://doi.org/10.1103/PhysRevLett.74.1504 0031-9007 Google Scholar
J. E. Curtis, B. A. Koss, and D. G. Grier,
“Dynamic holographic optical tweezers,”
Opt. Commun., 207 169
–175
(2002). https://doi.org/10.1016/S0030-4018(02)01524-9 0030-4018 Google Scholar
D. G. Grier,
“A revolution in optical manipulation,”
Nature, 424 810
–816
(2003). https://doi.org/10.1038/nature01935 0028-0836 Google Scholar
J. A. Dharmadhikari, A. K. Dharmadhikari, V. S. Makhija, and D. Mathur,
“Multiple optical traps with a single laser beam,”
Curr. Sci., 93 1265
–1270
(2007). 0011-3891 Google Scholar
K. Bambardekar, A. K. Dharmadhikari, J. A. Dharmadhikari, D. Mathur, and S. Sharma,
“Measuring erythrocyte deformability with fluorescence, fluid forces, and optical trapping,”
J. Biomed. Opt., 13 064021
–7
(2008). https://doi.org/10.1117/1.3037342 1083-3668 Google Scholar
S. Henon, G. Le Normand, A. Richert, and F. Gallet,
“A new determination of the shear modulus of the human erythrocyte membrane using optical tweezers,”
Biophys. J., 76 1145
–1151
(1999). https://doi.org/10.1016/S0006-3495(99)77279-6 0006-3495 Google Scholar
J. A. Dharmadhikari, S. Roy, A. K. Dharmadhikari, S. Sharma, and D. Mathur,
“Torque-generating malaria-infected red blood cells in an optical trap,”
Opt. Express, 12 117
–123
(2004). https://doi.org/10.1364/OPEX.12.000117 1094-4087 Google Scholar
A. Ghosh, S. Sinha, J. A. Dharmadhikari, S. Roy, A. K. Dharmadhikari, J. Samuel, S. Sharma, and D. Mathur,
“Euler buckling-induced folding and rotation of red blood cells in an optical trap,”
Phys. Biol., 3 67
–73
(2006). https://doi.org/10.1088/1478-3975/3/1/007 1478-3975 Google Scholar
K. Mohanty, S. Mohanty, S. Monajembashi, and K. O. Greulich,
“Orientation of erythroytes in optical trap revealed by confocal fluorescence microscopy,”
J. Biomed. Opt., 12 060506
–3
(2007). https://doi.org/10.1117/1.2822365 1083-3668 Google Scholar
S. K. Mohanty, K. S. Mohanty, and P. K. Gupta,
“Dynamics of interaction of RBC with optical tweezers,”
Opt. Express, 13 4745
–4751
(2005). https://doi.org/10.1364/OPEX.13.004745 1094-4087 Google Scholar
J. A. Dharmadhikari and D. Mathur,
“Using an optical trap to fold and align single red blood cells,”
Curr. Sci., 86 1432
–1437
(2004). 0011-3891 Google Scholar
S. Roy, J. A. Dharmadhikari, A. K. Dharmadhikari, D. Mathur, and S. Sharma,
“Plasmodium-infected red cells roll under fluid forces due to intrinsic structural anisotropy and membrane rigidity,”
Curr. Sci., 89 1563
–1570
(2005). 0011-3891 Google Scholar
M. Khan, S. K. Mohanty, and A. K. Sood,
“Optically-driven red blood cell rotor in linearly polarized laser tweezers,”
Pramana, J. Phys., 65 777
–786
(2005). https://doi.org/10.1007/BF02704075 0304-4289 Google Scholar
|


