|
|
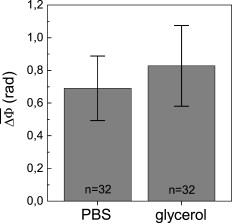
1.IntroductionThe understanding of biological reactions in a cellular system exceedingly depends on the ability to visualize and quantify the response inside a living cell. It is therefore one of the most important but also most difficult tasks in life sciences to image fast dynamic 3-D intracellular processes. A powerful and widely used technique is the subcellular labeling of structures with fluorescent dyes. In particular, immunofluorescence staining has developed rapidly since specific antibodies have been available.1 Great efforts have been made to improve fluorescent dye stability and diminish bleaching effects.2 Immunofluorescence staining indeed is mainly restricted to fixated samples due to the need of membrane permeabilization for intracellular target detection. Although new insights into 3-D cell structures are provided, fluorescence labeling is currently restricted to specific cellular components and to rather slow processes due to time-consuming image acquisition.3 Improvements like the engineering of green fluorescent protein (GFP) fusion proteins allow an investigation in living cells,4 but the generation of modified cells may fail and the effects of protein overexpression are only partially predictable. To overcome drawbacks of fluorescence dyes, label-free methods for the application of quantitative phase contrast imaging have also been developed. Here the approach of digital holographic microscopy (DHM) enables high resolution quantitative phase contrast imaging and minimally invasive quantitative live cell analysis.5, 6, 7, 8, 9, 10, 11 In comparison to other phase contrast methods,12, 13 interferometry-based techniques,14, 15, 16, 17, 18 optical coherence tomography, or optical coherence microscopy,19, 20, 21, 22, 23, 24 DHM provides quantitative phase contrast with subsequent numerical focus correction (multifocus imaging) from a single hologram. In combination with algorithms for the quantification of image sharpness, numerical autofocusing without mechanical focus realignment is possible.25 These DHM features are of particular advantage for measurements on cellular specimens with high-magnification optics and for the detection of fast cellular processes. Furthermore, long-term measurements, where focus tracking is required due to mechanical instability or thermal effects,26 and 3-D tracking of living cells27 are enabled. However, like all quantitative phase contrast methods, imaging of subcellular components requires a spatial inhomogeneous distribution of the cellular refractive index. Thus, a rather homogeneous distribution limits the analysis of intracellular structures and processes. Moreover, the influence of sample preparation on the cellular refractive index has to be implicated when interpreting results from fixated cells. The manipulation of the extracellular refractive index indeed has a long history and was initially used to reduce the turbidity of liquid caused by light scattering.28 This technique, known as the immersion method, is based on surrounding the cells by a protein containing solution matching the refractive index of the cytosol. By adjusting the extracellular refractive index to the cellular value, the content of intracellular pigments could be identified due to optical density.29 A similar procedure was used recently in optical coherence tomography (OCT) to enhance the contrast for imaging biological samples.30, 31 This approach of optical clearing is based on the principle of matching the refractive indices of scatterers and ground material. The application of optical clearing agents (OCAs) with high refractive indices and hyperosmolarity32, 33 results in an improved imaging depth and contrast for different tissues and cells.34, 35, 36 Various substances like glycerol, glucose, polyethylenglycol, and x-ray contrasting reagents have been used as OCAs to control the optical properties of tissue, whereas glycerol is the most commonly used.32 In this study we investigated the impact of the directed alteration of the cytoplasm refractive index with the aim to enhance the intracellular phase contrast in living cells. Therefore glycerol, a prevalently applied mounting medium in histology and substrate for transport studies,37, 38 is used as a medium with a high refractive index compared to phosphate buffered saline. First, the effects of extracellularly offered glycerol and the impact of the substance injected directly into the cytoplasm were examined. Afterward, we analyzed the influence of glycerol on the intracellular contrast in chemically fixated cells. 2.Materials and Methods2.1.Cell Culture and Sample PreparationThe investigated human pancreatic ductal adenocarcinoma cell line PaTu 8988T was obtained from the German Collection of Microorganisms and Cell Cultures (DSMZ, Braunschweig, Germany). It is one of two cell lines established from a liver metastasis of a primary pancreatic adenocarcinoma from a old woman in 1985, representing a poorly differentiated adenocarcinoma with high metastatic potential.39 Pancreatic tumor cells were cultured in Dulbecco’s modified Eagle’s Medium (DMEM) supplemented with 5% fetal calf serum, 5% horse serum, and L-glutamine under standard cell culture conditions ( and 5% ). For digital holographic cell imaging, cells were trypsinized and were seeded on petri dishes ( -dishes Grid-500, ibidi GmbH, Munich, Germany). Cells were cultured for and rinsed twice with Dulbecco’s phosphate buffered saline (PBS) (DPBS, Lonza, Verviers, Belgium). Live cell imaging experiments were conducted using petri dishes filled with either PBS or a mixture of glycerol/PBS (50%, v/v) and a climate chamber (ibidi GmbH, Munich, Germany), allowing for temperature-stabilized analysis at and normal atmospheric conditions. Chemically fixated cells ( at room temperature) using 4% neutral buffered formalin were analyzed after mounting with PBS and glycerol, respectively. The refractive indices of PBS ( : 1.337), glycerol ( : 1.474), and the 50% (v/v) mixture of glycerol/PBS ( : 1.408) were measured with a digital Abbe refractometer (WYA-2S, Ningbo Hinotek Technology Company, Limited, Ningbo, China). 2.2.Digital Holographic Imaging and Experimental SetupLive cell imaging experiments as well as analysis of fixated cells were performed using an inverse fluorescence microscope Olympus IX81 (Olympus Deutschland GmbH, Hamburg, Germany) with attached DHM module based on a principle described in Ref. 40. The coherent light source is a frequency-doubled Nd:YAG laser (Compass 315M-100, Coherent, Luebeck, Germany, ). Figure 1 illustrates the general concept for the integration of DHM into the microscopy system. Microinjection was performed using an Eppendorf InjectMan NI 2 and FemtoJet system (both Eppendorf GmbH, Hamburg, Germany) and an injection needle of approximately inner and outer diameter, respectively. An overview of the experimental setup is shown in Fig. 1, whereas Fig. 1 presents the microscope condenser with DHM unit, the opened climate chamber, and the micromanipulator under operating conditions in detail. Fig. 1General setup of a digital holographic microscopy system with an inverse microscope arrangement and microinjection unit: (a) schematic setup, (b) inversed Olympus IX81 fluorescence microscope with DHM module in transmission mode, (c) condenser with the DHM unit for coherent illumination, opened climate chamber (ibidi GmbH, Munich, Germany) and micromanipulator InjectMan NI2 (Eppendorf GmbH, Hamburg, Germany).  2.2.1.Intracellular microinjectionFor imaging, a oil immersion microscope objective (Olympus UPlanSApo, Olympus Deutschland GmbH, Hamburg, Germany) was used. Bright field images ( , exposure time ) were captured directly prior to and after microinjection of PaTu 8988T cells. In time-laps series ( , exposure time ), digital off-axis holograms of selected cells were captured throughout the microinjection process (injection pressure , injection time , and compensation pressure ) with a mixture of glycerol/PBS (50%, v/v) with a charge-coupled device (CCD) sensor ( , The Imaging Source, DMK 41BF02, Bremen, Germany). Numerical evaluation of the resulting digital holograms was performed by spatial phase shifting reconstruction as described in detail in Refs. 6, 41 using dcHolo and PhaseIllustrator software (both developed at the Center for Biomedical Optics and Photonics, Muenster, Germany, based on the PV-Wave programming environment, Visual Numerics, Stuttgart, Germany). In the case of intracellular injection of 2,7-dichlorofluorescein (DCF), images were taken directly after microinjection ( , , and ) with DCF in a mixture of glycerol/PBS (50%, v/v) with the CCD sensor F-View II and processed using the cell∧p software (both Olympus Deutschland GmbH, Hamburg, Germany). 2.2.2.Extracellular buffer replacementIn analogy to the microinjection experiments, bright field images ( , exposure time ) and digital off-axis holograms (exposure time ) of selected cells were captured prior to and in definite intervals after the exchange of the extracellular buffer from PBS to a mixture of glycerol/PBS (50%, v/v). 3.Results3.1.Cell Injection Process MonitoringFirst, the microinjection process is analyzed to assure the applicability of DHM in combination with the injection unit. In general, the microinjection process of a liquid into a living cell has to be performed fast to minimize cell membrane injury. Also, the applied injection pressure should be as low as possible to avoid a high flow stream inside the cell. This results in special demands for the experimental conditions. Thus, in an initial experiment, we performed a cell free approach to optimize our setup in respect to the acquisition rate of holograms, bright field images, and fluorescence images, as well as in respect of the presentability of the injection process and data processing. Due to high viscosity and refractive index of the pure substance, glycerol has been diluted with PBS (50%, v/v), leading to a refractive index of : 1.408. Figure 2 shows bright field images (first row), the quantitative DHM phase contrast images (second row), and the corresponding false color plots (third row) that result from the injection process into pure PBS. Figures 2, 2, 2 depict the micrographs before the injection with the tip of the injection needle extending into the section. To avoid a buffer influx into the needle due to capillary effects, the compensation pressure was set to . The images in Figs. 2, 2, 2 indicate no efflux of liquid into the buffer solution at the same time. After triggering the efflux ( , ), the glycerol/PBS mixture was injected into the buffer [Figs. 2, 2, 2]. The effectively released amount of liquid depends on injection pressure, duration (time), viscosity of the injected substance, and the actual inner diameter of the needle. Thus, the injected volume cannot be absolutely controlled and quantified. However, the different gray levels (256) in the DHM phase contrast images [Figs. 2, 2, 2, 2] represent the local change refractive index distribution. High gray values correlate with a high refractive index, while the lowest values display a refractive index of the pure PBS ( : 1.337). Obviously, the injection of the glycerol/PBS dilution leads to a maximum concentration of the mixture at the tip of the needle, which is indicated by the brightest gray levels and highest refractive index, respectively [Figs. 2 and 2]. The false color-coded representation of the phase contrast images in Figs. 2 and 2 illustrate these findings. The gentle transition from the tip to distant areas demonstrate the fast mixing process of both liquids to a finally homogeneous mixture [Figs. 2 and 2] within three seconds. Fig. 2(a)-(l) Injection of a glycerol/PBS mixture 50%, v/v in pure PBS. The injection pressure was set to with an injection time of . (a)-(d) Bright field images, (e)-(h) DHM phase contrast images, and (i)-(l) corresponding false color plot; (m) and (n) microinjection of a PaTu 8988T cell ( , ) with DCF 2,7-dichlorofluorescein in a glycerol/PBS mixture (50% v/v). (m) Bright field image of a PaTu 8988T cell after microinjection. (n) Corresponding fluorescence image (exposure time ) after microinjection.  To analyze the characteristics of the injected material flow inside a cell, we injected the fluorescent dye DCF [2,7-dichlorofluorescein in glycerol/PBS (50%, v/v)] into PaTu 8988T cells ( , ). Figure 2 shows a bright field image of a single cell prior to the injection. The fluorescence micrograph immediately after the injection is depicted in Fig. 2. The results demonstrated that cell membrane integrity is not affected by the microinjection. Furthermore, the homogeneous distribution of the fluorescent emission throughout the cytoplasm supports the proposed concept that the entire cytosol can be passed through by the injected mixture. 3.2.Impact of the Intracellular Injection of Glycerol/Phosphate Buffered Saline on the Quantitative Phase ContrastIn the next experimental step, the influence of the intracellular contrast on quantitative phase contrast images of a living cell was investigated by injection of a glycerol/PBS mixture. It is expected that the injection causes changes in the cytosolic composition, either directly by the injected liquid or indirectly by the triggered cellular reaction. For the experiment, digital holograms were recorded before, during, and after the injection process. In addition, micrographs in the bright field mode were captured as a reference. Due to the experimental setup, the minimum delay between image acquisition in the two different modes amounted in the range of . Following the settings of the cell free approach in Sec. 3.1, the compensation pressure was set to and the injection pressure was adjusted to for . Considering the results of Sec. 3.1, a very gentle influx into the cell can be expected. Figure 3 shows an exemplarily bright field image of a PaTu 8988T cell after seeding. Flat membrane extension and lamellipodia are typical for healthy cells under cell culture conditions. The corresponding DHM phase contrast image in Fig. 3 displays the cell in different gray levels . The gray level map represents the optical path length changes that are affected by the cell in comparison to the surrounding medium due to its thickness and inner refractive index distribution. Thin membrane extensions are resolved and the cell borders can be identified. However, due to a rather homogeneous intracellular refractive index, the phase contrast inside the cell is low. Only a few intracellular structures are visible, and a correlation to specific intracellular compartments is not possible. Figure 3 represents a DHM phase contrast image immediately after the injection of a glycerol/PBS mixture in the perinuclear region. Lamellipodia at the cell border are defined with almost similar details in comparison to the situation before the injection. However, the central part of the cell around the nucleus appears with enhanced phase contrast, and areas of brighter gray levels become visible. These structures are surrounded by an area with only smooth gray value changes and with a partly visible border to the ambient cell body [arrow, Fig. 3]. Comparisons with the bright field image [captured after the hologram, Fig. 3] allow the identification of these structures as the nucleus with nucleoli. Moreover, this image verifies the successful injection of the glycerol/PBS mixture, as a fluid-filled membrane bleb occurs in the right part of the cell. Additionally, small blebs at the distal parts of the membrane extensions are visible, revealing a direct connection to the main part of the cytosol. After one minute [Figs. 3 and 3], the cellular reaction appears increased and the membrane curled. Because of the rather low local differences of the refractive index inside the blebs and the cytosol, the injected liquid can be assumed to have immediately mixed with the intracellular compounds. Eight minutes after the microinjection, blebs have degenerated and the cell surface appears a little rougher in the bright field image [Fig. 3] compared to the unaffected cell in Fig. 3. Fine, long membrane extensions are still visible and indicate a living cell. In the corresponding DHM phase images [Fig. 3], the contrast of the cytosol to the surrounding buffer is low compared to the results of the prior measurements. Fig. 3Injection of a glycerol/PBS mixture (50%, v/v) into a PaTu 8988T cell. (a)-(d) Bright field images and (e)-(h) corresponding DHM phase contrast images showing a PaTu 8988T cell (a) and (e) before, (b) and (f) directly after, (c) and (g) after, and (d) and (h) after injection ( , ). (e) through (h) Black arrowheads indicate the positions of two cross sections to quantify the relative phase contrast of two different nucleoli (1 and 2) at each time step. The black arrow in (f) marks the nuclear envelope. (i) The plots for cross section 1 and (j) cross section 2 illustrate the alteration of the relative phase contrast per pixel, with the solid line representing the nucleolus prior to injection, the triangle line representing the nucleolus directly after injection, the circle line representing the nucleolus after injection, and the asterisk line representing the nucleolus after injection. The phase range of is coded to 256 gray levels. Scale bar: .  To quantify the enhanced intracellular contrast, the DHM phase contrast images were analyzed by cross sections through the nucleoli and surrounding parts of the nucleus [cross sections between the arrowheads in Figs. 3, 3, 3, 3]. Figures 3 and 3 depict the relative phase contrast differences [ (rad)] for the cross sections before and after microinjection. The solid line in Fig. 3 represents the situation before the injection, and the relative phase contrast of nucleolus 1 is about higher than the surrounding area. Directly after the injection of the glycerol/PBS mixture, raises to in maximum, one minute later to , and eight minutes after the injection process to . The results for the second analyzed nucleolus confirm this measurement. Here, before the injection, the relative phase contrast amounts to in maximum, and eight minutes after the injection it shows an increase to . These results of quantitative phase contrast analysis support the effect of contrast enhancement for the nucleoli inside the living cell after injection of a glycerol/PBS mixture. Figure 4 represents another exemplarily pancreatic tumor cell before and after the injection process under the same experimental conditions described before and confirms the results. Similar to the results in Fig. 3, the cell body with its lamellipodia and membrane extensions is silhouetted against the environmental buffer, but on the contrary, the phase contrast of intracellular structures of the unaffected cell is low [Fig. 4]. After the injection of the glycerol/PBS mixture, two individual structures can be distinguished in the central part of the cell [Fig. 4]. One minute after the injection, a small bleb occurs in the lower cell extension [Fig. 4], but disappears within the next few minutes [Fig. 4]. The reconstructed phase images documented the cellular reactions as well, and in contrast to the first cell (Fig. 3), even thin membrane extensions at the cell borders stay visible. The differences of the phase contrast between the two nucleoli and the surrounding area were analyzed quantitatively and are depicted in Figs. 4 and 4. The findings are in good agreement with the results for the described first cell, and show an increasing difference in the phase contrast for the nucleoli and the environmental area after the injection of a glycerol/PBS mixture into the cell. Fig. 4Injection of a PaTu 8988T cell with a mixture of glycerol/PBS (50%, v/v). (a)-(d) Bright field images and (e)-(h) corresponding DHM phase contrast images showing a PaTu 8988T cell (a) and (e) before, (b) and (f) directly after, (c) and (g) after, and (d) and (h) after injection ( , ). Indication of the two cross sections [black arrowheads in (e)-(h)] plot lines [solid, triangle, circle, and asterisk in (i) and (j)] is conformed to Fig. 3. The phase range of is coded to 256 gray levels. Scale bar: .  3.3.Influence of the Extracellular Buffer Composition on the Quantitative Phase ContrastAs shown in Sec. 3.2, the direct injection of a glycerol/PBS mixture into a living cell increased the intracellular contrast. In the next experimental step, the influence of an extracellularly offered mixture on the DHM phase contrast was investigated. Pancreatic tumor cells were first incubated in PBS, and bright field images as well as digital holograms were captured with a delay of . Figure 5 illustrates the results for an exemplarily selected PaTu 8988T cell. Flat lamellipodia and membrane extensions documented the healthy status of the cell. Two nucleoli can be identified in the central part of the nucleus [Fig. 5]. Particularly, the DHM phase contrast image allows the identification of these structures despite a weak contrast [Fig. 5]. After the initial bright field and DHM imaging, the complete buffer medium was changed from PBS to a glycerol/PBS mixture (50%, v/v). The cellular reaction was rapid (within seconds) and resulted in a distinct shrinkage of the cell body [Fig. 5]. In the bright field micrograph, lamellipodia could still be identified, but especially in the central part of the cell a correlation to specific cellular compartments was not possible. In the corresponding DHM phase contrast image [Fig. 5], cell boundaries and wide parts of lamellipodia are not displayed properly. The central part of the cell was silhouetted against the background, but a homogeneous refractive index inhibited the identification of subcellular structures. Fig. 5Influence of the surrounding buffer conditions on the intracellular contrast. (a) and (b) Bright field images and (c) and (d) corresponding DHM phase contrast images showing (a) and (c) a PaTu 8988T cell in PBS, and (b) and (d) after change to a mixture (50%, v/v) of glycerol/PBS as the surrounding media. (c) and (d) Black arrowheads indicate the positions of two cross sections to quantify the relative phase contrast of two different nucleoli (1 and 2) before and after buffer exchange. (e) The plots for cross section 1 and (f) cross section 2 illustrate the alteration of the relative phase contrast per pixel, with the solid line representing the nucleolus before and the triangle line representing the nucleolus after change of buffer. The phase range of is coded to 256 gray levels. Scale bar: . 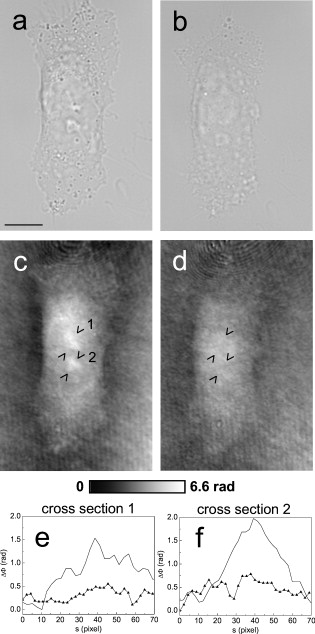 The decreased intracellular contrast was analyzed quantitatively following the same protocol as described in Sec. 3.2. The cross sections were selected to cut the nucleoli but also the ambient area (sections marked with arrowheads). Figures 5 and 5 show the relative phase contrast for the two cross sections before and after the buffer exchange. In PBS, in both cases was increased at the site of the nucleoli and can be defined to and to , respectively. After external buffer exchange, these differences of relative phase contrast decreased to a maximum of and . Although in general those differences should be sufficient to identify a cellular component, the irregular curve profile clarifies that the maximum differences are caused by local unspecific peaks and not by a solid nucleoli. Figure 6 exemplifies another pancreatic tumor cell before and after the change of the surrounding medium, demonstrating the reproducibility of the experiment. Before external buffer change, the cell has pronounced flat membrane extensions and lamellipodia, which were visible in both bright field [Fig. 6] and DHM mode [Fig. 6]. The intracellular contrast allowed the identification of nucleoli, although the contrast was low. Again, the change of the extracellular buffer to the glycerol/PBS mixture started a rapid shrinking process of the cell, leading to a reduced cell size displayed in Fig. 6. Moreover, the central part of the cell appeared unstructured and irregular. In the corresponding phase contrast image, the contrast is quite low, the membrane extensions are displayed only partly in front of the background, and the nucleoli cannot be allocated [Fig. 6]. The analysis of the relative phase contrast by cross sections is depicted in Figs. 6 and 6. Solid lines show the status of the development of the relative phase contrast before buffer exchange. Although the contrast is low, the progression of the curve allows a correlation of the high values to nucleoli and the lower ones to ambient areas of the nucleus. After the cell shrinkage, however, the correlation of the relative phase contrast to visible cellular compartments is difficult. Fig. 6The surrounding buffer conditions influence the intracellular contrast. (a) and (b) Bright field images and (c) and (d) corresponding DHM phase contrast images showing (a) and (c) a PaTu 8988T cell in PBS, and (b) and (d) after change to a mixture (50%, v/v) of glycerol/PBS as the surrounding media. Indication of the two cross sections [black arrowheads in (c) and (d)] and plot lines in [solid and triangle in (e) and (f)] conform to Fig. 5. The phase range of is coded to 256 gray levels. Scale bar: . 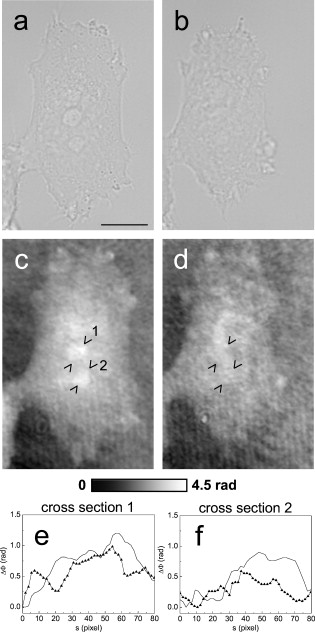 The findings in Figs. 5 and 6 indicate that the change of the extracellular PBS buffer to a mixture of glycerol/PBS leads to cell shrinkage and to a decrease of the intracellular DHM phase contrast. 3.4.Impact of the Mounting Medium on the Intracellular Quantitative Phase Contrast of Chemically Fixated CellsIn the last part of this study, the effect of the mounting reagent on the intracellular contrast of chemically fixated cells was analyzed. Therefore, PaTu 8988T cells were grown on a petri dish ( -dish, ibidi, Munich, Germany) and after inoculation the cells were fixated by an unspecific chemical protein crosslink by formalin. This prevalently used method has been chosen to provide stable samples for histological investigations, and in contrast to the incubation with methanol (e.g.), the cell membranes are not completely eliminated.42 DHM phase contrast images of the same cells were recorded in PBS and in pure glycerol. In analogy to the previous sections, the visibility of the nucleoli was used as a marker for the intracellular contrast that was quantified by the difference between the phase contrast of the nucleolus and the phase contrast of the surrounding area. Figure 7 shows the results for the mean relative phase contrast obtained from individual fixated cells that were subsequently embedded in PBS and glycerol. The values of the relative phase contrast for PBS and for glycerol both indicate that the nucleoli could be identified in the reconstructed images. Moreover, the data revealed that within the standard deviation of the measurement, there was no definite influence of the two different mounting media on the intracellular contrast in the case of fixated pancreatic tumor cells. 4.DiscussionDigital holographic microscopy enables a label-free analysis of living and fixed cellular specimens. The contrast of the captured holograms and reconstructed images rely on optical path length changes that are affected by the cell due to its thickness and the integral refractive index. This physical background provides the opportunity to analyze living cells quantitatively, and the rather homogeneous intracellular refractive index allows the 3-D analysis of outer geometries of adherent and suspended cells.43, 44 At the same time, the slight variations of the index limits the technique, since the intracellular contrast is low and cell structures are hard to distinguish. The results in Sec. 3 describe our approach to enhance the intracellular contrast by the injection of a liquid directly into the cell. The microinjection technique in general is an established tool and has been successfully applied to bring exogenous proteins, drugs, or oligomers into a cell.45, 46 The results in Figs. 2, 3, 4 showed that injected cells appeared morphologically healthy after the process, and cellular volume changes were low and only temporal, which is a prerequisite for the successful injection and long-term cell viability.47, 48, 49 The injected liquid seemed to disperse over the whole cell, as the entire cytosol is passed through by the injected fluorescent dye [Fig. 2]. Because of the rapid mixing of the glycerol/PBS composite with the surrounding buffer [Fig. 2], we conclude that the injected material, and in particular the glycerol, mixed immediately with the cytosol. Figures 3 and 4 showed that the injection of a glycerol/PBS mixture into a pancreatic tumor cell leads to an increase of intracellular contrast. Besides the nuclear envelope, the nucleoli are visible and the quantitative analysis of the nucleoli revealed an increase of the DHM relative phase contrast. In general, there are two possible reasons for this contrast enhancement: 1. the injection leads to an increase of the refractive index of the nucleoli, and 2. the refractive index of the ambient nucleoplasm or of the cytosol, respectively, is decreased. Nucleoli are the most dense and prominent structures in the nucleus and, unlike other organelles in the cell, they are not bound by a membrane. Owing to the difference in the density between the nucleolus and the nucleoplasm, nucleoli are often visible in conventional phase contrast micrographs. There is still little knowledge about the forces that keep nucleoli together and organized, but it is known these structures play a central role in the ribosome subunit biogenesis. This is confirmed by the presence of many proteins involved in different steps in rRNA transcription, rRNA processing, and modification.50, 51 In regard to a possible interaction of the nucleoli and glycerol, there are no indications of a preferential accumulation in the nucleoli of living cells that could explain the observed increase of the refractive index. Therefore, we assume that glycerol causes a decrease of the refractive index of the environmental cytoplasm. However, the injected glycerol/PBS mixture has a higher refractive index ( : 1.408) than the cytosol ( : 1.375).41 Due to that apparent contradiction, a direct effect seems rather implausible. Glycerol is a prevalently used mounting medium in histology due to its high refractive index. Furthermore, glycerol has been reported to be an efficient OCA for the reduction of light scattering in OCT and akin techniques that enhances the depth resolution and the contrast in imaging of biological tissue.30, 31, 33, 34, 35, 36, 52 Beyond that and in a more physiological context, glycerol is found in the blood and in the interstitial fluid,53 and therefore is recognized as a natural cell metabolite. Regarding the permeability of lipid bilayers, glycerol is considered a small uncharged polar molecule. Like a water molecule, it is able to diffuse across membranes, but its permeability coefficient for the passage through a synthetic lipid bilayer is much smaller than for water .50 This imbalance is potentiated in a living cell due to the presence of aquaporins (AQP) in the cellular membranes.54 Some proteins of the AQP family have a very high specificity to water, whereas few also allow the passage of glycerol.55 Even though we do not know the exact expression in PaTu 8988T, aquaporins are considered as a preserved instrument of living cells to deal with the osmotic and hydrostatic pressure changes in their environment.56 As a consequence of these basic biochemical principles, we assume the following explanation for the intracellular contrast enhancement after the injection of the glycerol/PBS mixture: the injection of the liquid directly into the cell leads to a swelling of the cell, first, because of the injected amount of liquid, and second, due to an influx of water from the external buffer into the cell. The influx is driven by the osmotic disequilibrium of glycerol and the preferred passage of water into the cell compared to an efflux of glycerol. In addition to the cell swelling, the influx of water causes a dilution of the cytoplasm. The cytoplasm consists of the cytosol and the cytoplasmic organelles suspended in it. An estimation of the protein concentration of the cytoplasm of mammalian tissue culture cells indicates a value of 20 to 30%.57, 58 As the refractive index of a protein solution is directly proportional to its concentration,59, 60 a dilution leads to a decrease of the refractive index. Changes in the osmolarity of a solution in contrast appear to have a negligible impact on its refractive index.61 Barer and Tkaczyk show the linear correlation of the refractive index and the concentration for the bovine serum albumin; a dilution by 5% leads to a decrease of the refractive index by about 0.01.62 In our case, the refractive index decrease seems to overcompensate the effect of the injected glycerol into the cytosol. Beyond that, the dense package and the molecular interaction of the proteins in the nucleoli appear to protect the structure and conserve the local high refractive index. Our suggestion that osmotic swelling of the cells is the reason for an enhanced intracellular contrast is supported by the results of the induction of cellular shrinkage (Figs. 5 and 6). The rapid efflux of water out of the cell when the glycerol concentration in the surrounding buffer is increased leads to visible shrinkage and to a strong rise of the protein concentration inside the cell. As a consequence, the refractive index increases and the intracellular contrast breaks down. Moreover, the loss of the contrast in the domains of the lamellipodia reveal that the intracellular refractive index has approached the value of the glycerol/PBS mixture outside the cell. Our approach created an osmotic pressure by injecting glycerol in cells, followed by an influx of water. Water influx was identified to be responsible for the enhanced intracellular contrast, and thus the process showed similarities to optical clearing strategies.36, 63 In OCT, the diffusion of agents like glycerol into the interstitial space of tissue leads to an increased refractive index of the interstitial fluid and causes a refractive index matching with extracellular scatterers (e.g., collagen and other tissue components), resulting in an enhanced tissue contrast and imaging of deeper layers.52 In contrast, the method presented here intends not to match the surrounding structure’s refractive index but to amplify the intracellular contrast for subcellular structure imaging, and scattering effects like in tissue or cell suspensions are not critical in cases of the used flat adherent cells. For subcellular imaging, we needed to alter directly the cytosolic refractive index to potentiate or even create small intracellular refractive index differences originated by cellular components. As mentioned, DHM was already used to analyze the outer geometries of cells, and we therefore expected to investigate the cell swelling and shrinkage concerning the cell height. However, as we alter the intracellular refractive index, the correlation of the optical path length changes the integral refractive index and the thickness cannot be used directly. A further verification of our results by decoupling of the cell thickness and the integral cellular refractive index can be achieved by DHM-based decoupling procedures,64, 65 but requires more complex experimental equipment or measurements with different light wavelengths and a suitable dispersive dye. Rather simple approaches like the addition of an extracellular dye and determination of the cell heights by confocal microscopy,66 on the contrary, seem to be inapplicable in the case of flat single cell analysis. The integrity of the cell membrane and therefore the unbalanced permeability for water and glycerol is assumed to be one of the key steps of our concept. Therefore, we performed comparative experiments with formalin-fixated cells. The fixation by formalin predominantly leads to a cross-link of the proteins, whereas the membrane integrity is conserved only partly.42 As a result, the quantification of the mean relative phase contrast showed no impact of the mounting medium on the intracellular contrast (Fig. 7). We assume that this is due to the free influx of the media into all domains of the cell, which inhibits the constitution of concentration dependent refractive index differences. We conclude that the microinjection of small amounts of glycerol leads to significant enhancement of the intracellular phase contrast of living cells in DHM. We assume an underlying process of gentle cell swelling due to a glycerol-induced osmotic disequilibrium, resulting in a decrease of the refractive index of the cytosol. These changes of the refractive index are reproducible and controllable. In view of the achieved results, we further assume the possibility to induce a contrast enhancement by osmotic swelling of the cells in hypotonic buffer, but this has to be proofed in further experiments. However, the injection of a glycerol mixture directly into the cell might be preferred, because of the advantage to work with established cell culture conditions in the extracellular medium. Moreover, the swelling is a transient and reversible process, as glycerol can diffuse slowly out of the cell and intracellular pathways can be used to metabolize remaining material. Finally, due to the principles of our contrast enhancement approach, the method can be applied with other quantitative phase contrast methods and interferometry-based techniques, and thus prospects enhance application fields in label-free live cell imaging. AcknowledgmentsThis work was supported by grants from the German Federal Ministry of Education and Research (BMBF), within the research focus program “Biophotonics,” as well as NanoCare and Cell@NanO. ReferencesE. Lazarides and K. Weber,
“Actin antibody: the specific visualization of actin filaments in non-muscle cells,”
Proc. Natl. Acad. Sci. U.S.A., 71
(6), 2268
–2272
(1974). https://doi.org/10.1073/pnas.71.6.2268 0027-8424 Google Scholar
J. C. Waters,
“Live-cell fluorescence imaging,”
Digital Microscopy, 81 115
–140 3rd ed.2007). Google Scholar
D. J. Stephens and V. J. Allan,
“Light microscopy techniques for live cell imaging,”
Science, 300
(5616), 82
–86
(2003). https://doi.org/10.1126/science.1082160 0036-8075 Google Scholar
J. Zhang, R. E. Campbell, A. Y. Ting, and R. Y. Tsien,
“Creating new fluorescent probes for cell biology,”
Nat. Rev. Mol. Cell Biol., 3
(12), 906
–918
(2002). https://doi.org/10.1038/nrm976 1471-0072 Google Scholar
E. Cuche, P. Marquet, and C. Depeursinge,
“Simultaneous amplitude-contrast and quantitative phase-contrast microscopy by numerical reconstruction of Fresnel off-axis holograms,”
Appl. Opt., 38
(34), 6994
–7001
(1999). https://doi.org/10.1364/AO.38.006994 0003-6935 Google Scholar
D. Carl, B. Kemper, G. Wernicke, and G. von Bally,
“Parameter-optimized digital holographic microscope for high-resolution living-cell analysis,”
Appl. Opt., 43
(36), 6536
–6544
(2004). https://doi.org/10.1364/AO.43.006536 0003-6935 Google Scholar
P. Marquet, B. Rappaz, P. J. Magistretti, E. Cuche, Y. Emery, T. Colomb, and C. Depeursinge,
“Digital holographic microscopy: a noninvasive contrast imaging technique allowing quantitative visualization of living cells with subwavelength axial accuracy,”
Opt. Lett., 30
(5), 468
–470
(2005). https://doi.org/10.1364/OL.30.000468 0146-9592 Google Scholar
C. J. Mann, L. F. Yu, C. M. Lo, and M. K. Kim,
“High-resolution quantitative phase-contrast microscopy by digital holography,”
Opt. Express, 13
(22), 8693
–8698
(2005). https://doi.org/10.1364/OPEX.13.008693 1094-4087 Google Scholar
F. Charriere, J. Kuhn, T. Colomb, F. Montfort, E. Cuche, Y. Emery, K. Weible, P. Marquet, and C. Depeursinge,
“Characterization of microlenses by digital holographic microscopy,”
Appl. Opt., 45
(5), 829
–835
(2006). https://doi.org/10.1364/AO.45.000829 0003-6935 Google Scholar
B. Kemper and G. von Bally,
“Digital holographic microscopy for live cell applications and technical inspection,”
Appl. Opt., 47
(4), A52
–A61
(2008). https://doi.org/10.1364/AO.47.000A52 0003-6935 Google Scholar
G. von Bally, B. Kemper, D. Carl, S. Knoche, M. Kempe, C. Dietrich, M. Stutz, R. Wolleschensky, K. Schütze, M. Stich, A. Buchstaller, K. Irion, J. Beuthan, I. Gersonde, and J. Schnekenbuger,
“New methods for marker-free live cell and tumor analyis,”
Biophotonics: Vision for Better HealthcareWiley, 301
–360 New York(2006). Google Scholar
L. G. Alexopoulos, G. R. Erickson, and F. Guilak,
“A method for quantifying cell size from differential interference contrast images: validation and application to osmotically stressed chondrocytes,”
J. Microsc., 205 125
–135
(2002). https://doi.org/10.1046/j.0022-2720.2001.00976.x 0022-2720 Google Scholar
A. Barty, K. A. Nugent, D. Paganin, and A. Roberts,
“Quantitative optical phase microscopy,”
Opt. Lett., 23
(11), 817
–819
(1998). https://doi.org/10.1364/OL.23.000817 0146-9592 Google Scholar
G. Popescu, L. P. Deflores, J. C. Vaughan, K. Badizadegan, H. Iwai, R. R. Dasari, and M. S. Feld,
“Fourier phase microscopy for investigation of biological structures and dynamics,”
Opt. Lett., 29
(21), 2503
–2505
(2004). https://doi.org/10.1364/OL.29.002503 0146-9592 Google Scholar
T. Ikeda, G. Popescu, R. R. Dasari, and M. S. Feld,
“Hilbert phase microscopy for investigating fast dynamics in transparent systems,”
Opt. Lett., 30
(10), 1165
–1167
(2005). https://doi.org/10.1364/OL.30.001165 0146-9592 Google Scholar
J. Farinas and A. S. Verkman,
“Cell volume and plasma membrane osmotic water permeability in epithelial cell layers measured by interferometry,”
Biophys. J., 71
(6), 3511
–3522
(1996). https://doi.org/10.1016/S0006-3495(96)79546-2 0006-3495 Google Scholar
P. Tychinskii,
“Dynamic phase microscopy: is a dialogue with the cell possible?,”
Phys. Usp., 50 513
–528
(2007). https://doi.org/10.1070/PU2007v050n05ABEH006222 1063-7869 Google Scholar
V. P. Tychinskii,
“Coherent phase microscopy of intracellular processes,”
Phys. Usp., 44 617
–629
(2001). https://doi.org/10.1070/PU2001v044n06ABEH000841 1063-7869 Google Scholar
A. D. Aguirre, P. Hsiung, T. H. Ko, I. Hartl, and J. G. Fujimoto,
“High-resolution optical coherence microscopy for high-speed, in vivo cellular imaging,”
Opt. Lett., 28
(21), 2064
–2066
(2003). https://doi.org/10.1364/OL.28.002064 0146-9592 Google Scholar
E. A. Swanson, J. A. Izatt, M. R. Hee, D. Huang, C. P. Lin, J. S. Schuman, C. A. Puliafito, and J. G. Fujimoto,
“In vivo retinal imaging by optical coherence tomography,”
Opt. Lett., 18 1864
–1866
(1993). https://doi.org/10.1364/OL.18.001864 0146-9592 Google Scholar
Y. Zhao, Z. Chen, Z. Ding, H. Ren, and J. S. Nelson,
“Real-time phase-resolved functional optical coherence tomography by use of optical Hilbert transformation,”
Opt. Lett., 27
(2), 98
–100
(2002). https://doi.org/10.1364/OL.27.000098 0146-9592 Google Scholar
C. G. Rylander, D. P. Dave, T. Akkin, T. E. Milner, K. R. Diller, and A. J. Welch,
“Quantitative phase-contrast imaging of cells with phase-sensitive optical coherence microscopy,”
Opt. Lett., 29
(13), 1509
–1511
(2004). https://doi.org/10.1364/OL.29.001509 0146-9592 Google Scholar
A. K. Ellerbee, T. L. Creazzo, and J. A. Izatt,
“Investigating nanoscale cellular dynamics with cross-sectional spectral domain phase microscopy,”
Opt. Express, 15
(13), 8115
–8124
(2007). https://doi.org/10.1364/OE.15.008115 1094-4087 Google Scholar
C. Joo, K. H. Kim, and J. F. de Boer,
“Spectral-domain optical coherence phase and multiphoton microscopy,”
Opt. Lett., 32
(6), 623
–625
(2007). https://doi.org/10.1364/OL.32.000623 0146-9592 Google Scholar
P. Langehanenberg, B. Kemper, D. Dirksen, and G. von Bally,
“Autofocusing in digital holographic phase contrast microscopy on pure phase objects for live cell imaging,”
Appl. Opt., 47
(19), D176
–182
(2008). https://doi.org/10.1364/AO.47.00D176 0003-6935 Google Scholar
P. Langehanenberg, B. Kemper, and G. von Bally,
“Autofocus algorithims for digital holographic microscopy,”
Proc. SPIE, 6633 66330E
(2007). https://doi.org/10.1117/12.727784 0277-786X Google Scholar
P. Langehanenberg, L. Ivanova, I. Bernhardt, S. Ketelhut, A. Vollmer, D. Dirksen, G. Georgiev, G. von Bally, and B. Kemper,
“Automated three-dimensional tracking of living cells by digital holographic microscopy,”
J. Biomed. Opt., 14
(1), 014018
(2009). https://doi.org/10.1117/1.3080133 1083-3668 Google Scholar
R. Barer, K. F. Ross, and S. Tkaczyk,
“Refractometry of living cells,”
Nature, 171
(4356), 720
–724
(1953). https://doi.org/10.1038/171720a0 0028-0836 Google Scholar
R. Barer,
“Spectrophotometry of clarified cell suspensions,”
Science, 121
(3151), 709
–715
(1955). https://doi.org/10.1126/science.121.3151.709 0036-8075 Google Scholar
V. V. Tuchin,
“Optical clearing of tissues and blood using the immersion method,”
J. Phys. D, 38
(15), 2497
–2518
(2005). https://doi.org/10.1088/0022-3727/38/15/001 0022-3727 Google Scholar
V. V. Tuchin, Optical Clearing of Tissues and Blood, SPIE Press, Bellingham, WA
(2006). Google Scholar
X. Wen, Z. Mao, Z. Han, V. V. Tuchin, and D. Zhu,
“In vivo skin optical clearing by glycerol solutions: mechanism,”
J. Biophoton., 3
(1–2), 44
–52
(2010). https://doi.org/10.1002/jbio.200910080 Google Scholar
R. Cicchi, D. Sampson, D. Massi, and F. Pavone,
“Contrast and depth enhancement in two-photon microscopy of human skin ex vivo by use of optical clearing agents,”
Opt. Express, 13
(7), 2337
–2344
(2005). https://doi.org/10.1364/OPEX.13.002337 1094-4087 Google Scholar
I. V. Larina, E. F. Carbajal, V. V. Tuchin, M. E. Dickinson, and K. V. Larin,
“Enhanced OCT imaging of embryonic tissue with optical clearing,”
Laser Phys. Lett., 5
(6), 476
–479
(2008). https://doi.org/10.1002/lapl.200810019 1612-2011 Google Scholar
S. G. Proskurin and I. V. Meglinski,
“Optical coherence tomography imaging depth enhancement by superficial skin optical clearing,”
Laser Phys. Lett., 4
(11), 824
–826
(2007). https://doi.org/10.1002/lapl.200710056 1612-2011 Google Scholar
E. A. Genina, A. N. Bashkatov, A. A. Korobko, E. A. Zubkova, V. V. Tuchin, I. Yaroslavsky, and G. B. Altshuler,
“Optical clearing of human skin: comparative study of permeability and dehydration of intact and photothermally perforated skin,”
J. Biomed. Opt., 13
(2), 021102
(2008). https://doi.org/10.1117/1.2899149 1083-3668 Google Scholar
A. S. Verkman and A. K. Mitra,
“Structure and function of aquaporin water channels,”
Am. J. Physiol. Renal Physiol., 278
(1), F13
–28
(2000). Google Scholar
Y. Wang and E. Tajkhorshid,
“Molecular mechanisms of conduction and selectivity in aquaporin water channels,”
J. Nutr., 137
(6), 1509S
–1515S
(2007). 0022-3166 Google Scholar
H. P. Elsasser, U. Lehr, B. Agricola, and H. F. Kern,
“Establishment and characterisation of two cell lines with different grade of differentiation derived from one primary human pancreatic adenocarcinoma,”
Virchows Arch. B, 61
(5), 295
–306
(1992). https://doi.org/10.1007/BF02890431 0340-6075 Google Scholar
B. Kemper, D. Carl, A. Höink, G. von Bally, I. Bredebusch, and J. Schnekenburger,
“Modular digital holographic microscopy system for marker free quantitative phase contrast imaging of living cells,”
Proc. SPIE, 6191 61910T
(2006). https://doi.org/10.1117/12.662781 0277-786X Google Scholar
B. Kemper, D. Carl, J. Schnekenburger, I. Bredebusch, M. Schafer, W. Domschke, and G. von Bally,
“Investigation of living pancreas tumor cells by digital holographic microscopy,”
J. Biomed. Opt., 11
(3), 034005
(2006). https://doi.org/10.1117/1.2204609 1083-3668 Google Scholar
R. W. Hoetelmans, F. A. Prins, I. Cornelese-ten Velde, J. van der Meer, C. J. van de Velde, and J. H. van Dierendonck,
“Effects of acetone, methanol, or paraformaldehyde on cellular structure, visualized by reflection contrast microscopy and transmission and scanning electron microscopy,”
Appl. Immunohistochem. Mol. Morphol., 9
(4), 346
–351
(2001). https://doi.org/10.1097/00022744-200112000-00010 Google Scholar
J. Klokkers, P. Langehanenberg, B. Kemper, S. Kosmeier, G. von Bally, C. Riethmuller, F. Wunder, A. Sindic, H. Pavenstadt, E. Schlatter, and B. Edemir,
“Atrial natriuretic peptide and nitric oxide signaling antagonizes vasopressin-mediated water permeability in inner medullary collecting duct cells,”
Am. J. Physiol. Renal. Physiol., 297
(3), F693
–703
(2009). https://doi.org/10.1152/ajprenal.00136.2009 Google Scholar
B. Kemper, S. Kosmeier, P. Langehanenberg, G. von Bally, I. Bredebusch, W. Domschke, and J. Schnekenburger,
“Integral refractive index determination of living suspension cells by multifocus digital holographic phase contrast microscopy,”
J. Biomed. Opt., 12
(5), 054009
(2007). https://doi.org/10.1117/1.2798639 1083-3668 Google Scholar
Y. Zhang and L. C. Yu,
“Microinjection as a tool of mechanical delivery,”
Curr. Opin. Biotechnol., 19
(5), 506
–510
(2008). https://doi.org/10.1016/j.copbio.2008.07.005 0958-1669 Google Scholar
J. P. Leonetti, N. Mechti, G. Degols, C. Gagnor, and B. Lebleu,
“Intracellular distribution of microinjected antisense oligonucleotides,”
Proc. Natl. Acad. Sci. U.S.A., 88
(7), 2702
–2706
(1991). https://doi.org/10.1073/pnas.88.7.2702 0027-8424 Google Scholar
, FemtoJet Operating Manual,
(2000) Google Scholar
Y. Zhang,
“Microinjection technique and protocol to single cells,”
Nature Protocols,
(2007) Google Scholar
M. Green, A. Thorburn, R. Kern, and P. M. Loewenstein,
“The use of cell microinjection for the in vivo analysis of viral transcriptional regulatory protein domains,”
Methods Mol. Med., 131 157
–186
(2007). https://doi.org/10.1007/978-1-59745-277-9_12 1543-1894 Google Scholar
B. Alberts, Molecular Biology of the Cell, Garland Science, New York
(2002). Google Scholar
Y. W. Lam, L. Trinkle-Mulcahy, and A. I. Lamond,
“The nucleolus,”
J. Cell. Sci., 118 1335
–1337
(2005). https://doi.org/10.1242/jcs.01736 0021-9533 Google Scholar
J. Hirshburg, B. Choi, J. S. Nelson, and A. T. Yeh,
“Collagen solubility correlates with skin optical clearing,”
J. Biomed. Opt., 11
(4), 040501
(2006). https://doi.org/10.1117/1.2220527 1083-3668 Google Scholar
E. Hagstrom-Toft, S. Enoksson, E. Moberg, J. Bolinder, and P. Arner,
“Absolute concentrations of glycerol and lactate in human skeletal muscle, adipose tissue, and blood,”
Am. J. Physiol., 273
(3), E584
–592
(1997). 0002-9513 Google Scholar
A. S. Verkman, A. N. van Hoek, T. Ma, A. Frigeri, W. R. Skach, A. Mitra, B. K. Tamarappoo, and J. Farinas,
“Water transport across mammalian cell membranes,”
Am. J. Physiol., 270
(1), C12
–30
(1996). 0002-9513 Google Scholar
J. B. Heymann and A. Engel,
“Aquaporins: phylogeny, structure, and physiology of water channels,”
News Physiol. Sci., 14 187
–193
(1999). 0886-1714 Google Scholar
A. S. Verkman,
“More than just water channels: unexpected cellular roles of aquaporins,”
J. Cell. Sci., 118 3225
–3232
(2005). https://doi.org/10.1242/jcs.02519 0021-9533 Google Scholar
K. Luby-Phelps,
“Cytoarchitecture and physical properties of cytoplasm: volume, viscosity, diffusion, intracellular surface area,”
Int. Rev. Cytol., 192 189
–221
(2000). https://doi.org/10.1016/S0074-7696(08)60527-6 0074-7696 Google Scholar
F. Lanni, A. S. Waggoner, and D. L. Taylor,
“Structural organization of interphase 3T3 fibroblasts studied by total internal reflection fluorescence microscopy,”
J. Cell Biol., 100
(4), 1091
–1102
(1985). https://doi.org/10.1083/jcb.100.4.1091 0021-9525 Google Scholar
E. Reiss,
“Eine neue Methode der quantitativen Eiweissbestimmung,”
Naunyn-Schmiedeberg's Arch. Pharmacol., 51
(1), 18
–29
(1903). https://doi.org/10.1007/BF01840738 0028-1298 Google Scholar
D. B. Hand,
“The refractivity of protein solutions,”
J. Biol. Chem., 108
(3), 703
–707
(1934). 0021-9258 Google Scholar
J. P. Craig, P. A. Simmons, S. Patel, and A. Tomlinson,
“Refractive index and osmolality of human tears,”
Optom. Vision Sci., 72
(10), 718
–724
(1995). https://doi.org/10.1097/00006324-199510000-00004 1040-5488 Google Scholar
R. Barer and S. Tkaczyk,
“Refractive index of concentrated protein solutions,”
Nature, 173
(4409), 821
–822
(1954). https://doi.org/10.1038/173821b0 0028-0836 Google Scholar
M. G. Ghosn, V. V. Tuchin, and K. V. Larin,
“Nondestructive quantification of analyte diffusion in cornea and sclera using optical coherence tomography,”
Invest. Ophthalmol. Visual Sci., 48
(6), 2726
–2733
(2007). https://doi.org/10.1167/iovs.06-1331 0146-0404 Google Scholar
B. Rappaz, P. Marquet, E. Cuche, Y. Emery, C. Depeursinge, and P. Magistretti,
“Measurement of the integral refractive index and dynamic cell morphometry of living cells with digital holographic microscopy,”
Opt. Express, 13
(23), 9361
–9373
(2005). https://doi.org/10.1364/OPEX.13.009361 1094-4087 Google Scholar
B. Rappaz, F. Charriere, C. Depeursinge, P. J. Magistretti, and P. Marquet,
“Simultaneous cell morphometry and refractive index measurement with dual-wavelength digital holographic microscopy and dye-enhanced dispersion of perfusion medium,”
Opt. Lett., 33
(7), 744
–746
(2008). https://doi.org/10.1364/OL.33.000744 0146-9592 Google Scholar
S. Steltenkamp, C. Rommel, J. Wegener, and A. Janshoff,
“Membrane stiffness of animal cells challenged by osmotic stress,”
Small, 2
(8–9), 1016
–1020
(2006). https://doi.org/10.1002/smll.200600018 1613-6810 Google Scholar
|