
|
|
1.IntroductionCardiac arrhythmias afflict millions of patients in the United States, resulting in frequent hospitalizations and high medical costs.1 Radiofrequency ablation (RFA) is the standard of care to cure many arrhythmias. The goal of RFA is to target and eradicate the critical component of an abnormal reentrant circuit or abnormal ectopic site, while minimizing or avoiding damage to normal areas of the heart. RFA has revolutionized the treatment of arrhythmias with over 80,000 procedures performed in the United States each year.2 Termination of an arrhythmia by RFA is typically targeted from the endocardium. However, it is estimated that 10 to 20% of arrhythmia circuits are in the deep myocardium or epicardium.3 These rates are higher for ventricular tachycardia (VT). Within a study of 257 consecutive patients, 28, 37, and 24% of patients with postmyocardial infarction, Chagas disease, and idiopathic dialated cardiomyopathy, respectively, had epicardial substrates for VT.4 1.1.Epicardial AblationCurrent treatment methods for ventricular tachycardia include antiarrhythmic drugs, implantable defibrillators, and catheter ablation.5 Implantable defibrillators and antiarrhytmic drugs palliate arrhythmia symptoms, whereas ablation therapy is a curative method. Because of the large percentage of epicardial circuits for VT, percutaneous epicardial ablation is an attractive method. Pericardial access is obtained through a subxyphoid approach, where a 17-gauge needle is introduced under fluroscopic guidance. A small amount of contrast medium is injected, and the needle is advanced into the pericardial space. Next, a guide wire is passed over the needle, and a sheath is advanced in which the ablation catheter can be introduced and maneuvered within the pericardial space for mapping and ablation.6 Acute success of epicardial ablation for VT is between 60 and 75% using standard rf catheters.6 In a study of 112 patients with Chagas’ VT, the recurrence rate of patients that received simultaneous epicardial ablation and endocardial ablation was 30%.7 One factor limiting success rates is attributed to rf energy delivery in the presence of epicardial fat. Fat attenuates rf energy, resulting in limiting lesion depth4 and may mimic infarction during electroanatomical mapping.8 In addition, complications can arise, requiring early termination of the procedure. A major complication that has been encountered in epicardial RFA is vascular injury and thrombosis due to energy delivery in close proximity to a coronary vessel. A previous study by d’Avila showed that the susceptibility of damage of coronary vessels is inversely proportional to vessel diameter, where it is hypothesized that larger vessels are protected due to increased blood flow.9 For coronaries within of an ablation lesion, small vessels showed severe injury, the presence of thrombosis, and intimal hyperplasia.10 One of the most important criteria for a successful RFA lesion is good and continuous catheter-tissue contact. However, this is difficult to assess during rf delivery. 1.2.Preprocedural ImagingCurrently, procedures are guided by real-time fluoroscopy, electrograms, electrode temperature, and tissue-electrode impedance. However, a real-time view of the epicardial surface is not available for procedural guidance and identification of critical structures. The use of preprocedural imaging has been demonstrated to be valuable for planning complex RFA procedures, obtaining a detailed anatomy of the heart, identifying areas of infarction using MRI11, 12 and echocardiography,13 and epicardial fat using computed tomography.14, 15 Three-dimensional volumes of the heart structure and segmented volumes of fat and infarction can be integrated with 3-D voltage mapping for improved procedural planning. These volumes are obtained hours to a day before the procedure, are low resolution, and static. This results in displacement errors once correlated with 3-D voltage maps5 or real-time fluoroscopy, limiting the utility of merged images. Directly before the start of ablation therapy, coronary angiography can be conducted to provide a visual of coronary vessels. If the site of arrhythmia focus is near a coronary, a risk stratification analysis is conducted before the start of rf energy delivery. There is a clinical need to assess epicardial substrates with high resolution and in real time, to reduce procedural complications by avoiding coronary vessels and increasing efficacy, by titrating rf energy dosage in the presence of epicardial fat, validating lesion formation, and assessing rf catheter-tissue contact. 1.3.Optical Coherence TomographyOptical coherence tomography (OCT) is a real-time, high-resolution imaging tool that provides cross sectional images of tissue microstructure16 with resolution and imaging depth into cardiac tissue.17 OCT can address unmet clinical needs of epicardial radiofrequency ablation therapy by assessing the contact and contact angle of the rf catheter with the tissue, confirming that a lesion has been formed after energy delivery, detecting early damage and identifying structures for procedural guidance. We have previously demonstrated the ability to monitor thermal ablation of the myocardium by radiofrequency ablation (RFA) using OCT.18 Viable tissue is characterized by a polarization artifact dark band within conventional OCT images18 due to the birefringence property of the highly organized myocardial tissue. Previous studies have also been conducted to evaluate laser ablation of porcine myocardium19 and thermal heating of porcine skin20 with polarization-sensitive OCT (PSOCT), observing changes in birefringence properties. OCT has been demonstrated to visualize critical structures related to electrical conduction, including the Purkinje network,17 and imaging the fast and slow pathways in the atrial-ventricular (AV) node,21, 22 myofiber organization22, 23 in animal models, and in vitro preparations of human tissue.24 In addition, OCT has been used extensively for intravascular applications,25, 26 analyzing blood flow and detecting small blood vessels in ophthalmology,27 and characterizing adipose tissue in breast cancer.28, 29 We hypothesize that OCT can be used for monitoring and guidance of epicardial ablation procedures. Providing a cross sectional view of coronary vessels will allow evaluation of vessel lumen size. With this information, the clinician will have more information to assess if energy can be delivered safely. Assessing tissue contact, validating lesion formation, and visualization of epicardial fat will reduce ambiguity in interpreting electrograms and enable titration of rf energy dosage to ensure effective energy delivery. Here we report the results of OCT imaging of normal untreated myocardium, ablation lesions, epicardial fat, and coronary vessels, and describe the distinguishing characteristics, including differences in optical properties and tissue architecture, and assessment of tissue contact with catheter-based imaging. This sets the foundation for developing OCT as a guidance tool for epicardial RFA. Real-time imaging of epicardial RFA therapy with OCT can potentially provide a direct visual of the epicardial surface, assess contact, provide visual confirmation of energy delivery and feedback to reduce complications, and titrate dosage by visualizing critical structures of interest. 2.Methods2.1.Sample PreparationFreshly excised ventricular wedges from swine hearts were used for characterization of epicardial structures and ablation lesions with OCT imaging. Following the onset of general anesthesia, a lateral thoracotomy was performed, and the heart was rapidly excised and placed in ice-cold phosphate-buffered saline (PBS). Eight hearts were used for this study. The right ventricular free wall and left ventricular free wall were dissected and placed in ice-cold PBS, up to half an hour, until the start of imaging. All animal studies were conducted according to protocols approved by the Institutional Animal Care and Use Committee of Case Western Reserve University (Cleveland, Ohio). For characterization of epicardial rf lesions, dissected ventricular wedges were placed in a bath with PBS maintained at with superperfusion flow [Fig. 1 ]. A series of ablative lesions were created with a temperature-controlled protocol with a maximum delivered power of and duration of , using the Maestro 3000 RFA generator (Boston Scientific, Natick, Massachusetts). Epicardial lesions were created using a , tip Blazer II catheter (Boston Scientific). A total of eight lesions were created using this protocol. 2.2.Imaging ProtocolThree-dimensional image sets of swine ventricular epicardium were acquired with a microscope-integrated spectral domain OCT (SDOCT) system with a light source centered at with bandwidth (InPhenix, Livermore California). Spectral interferograms were acquired with a linear-in-wave number spectrometer30 onto a line scan camera (Goodrich, Princeton New Jersey) spectrometer, acquired at a line scan rate. The system has a imaging range, fall-off range, and sensitivity. The measured axial and lateral resolution of the system was 16 and (in air) respectively.31 Each image was in transverse length, 1000 lines per image, and per line. Each volume consisted of 400 images. Assuming an index of refraction of 1.38 for ventricular tissue,32 the dimensions of the volumes were (L, W, H), with a corresponding pixel resolution of 4, 10, and , respectively. Summed voxel projection was used for rapid visualization of the 3-D image sets, and planes parallel to the sample surface were obtained by detecting the surface with an intensity threshold and digitally flattening the tissue surface.22 Imaging of epicardial substrates with a flexible catheter probe was conducted to show the feasibility of OCT imaging of epicardial substrates using a probe suitable for in vivo imaging. The catheter probe has been described elsewhere.33 Briefly, the probe is a contact, forward-imaging probe that provides cone scanning. The probe uses a gradient-index (GRIN) lens for focusing, a Risely prism to deflect the beam off axis, and applying torque on the fiber rotates the entire optical assembly to provide cone scanning (Fig. 2 ). An optical window isolates the probe optics from the environment. The probe sheath and end cap are polymers that are biocompatible and can operate in temperatures experienced in rf therapy, up to . The rigid end length is and the outer diameter is . The scan diameter is , which results in a lateral scanning range. The probe maintains a full-width at half maximum (FWHM) spot size of less than over an entire working range from the optical window. Images with the forward imaging catheter were acquired at line scan rate, 2000 lines per image, and per line. This corresponds to a 6- and pixel size in the axial and lateral dimensions, respectively. A correlation-based method34 was used to correct for nonuniform scanning rates, removing highly correlated axial scans. Fig. 2Optical schematic of forward imaging catheter probe. A GRIN lens is used for focusing, a Risley prism deflects the beam off axis, and optical glass isolates optics from the environment. The beam is focused from the optical glass. Fiber is glued to the GRIN lens-Risley prism unit. Application of torque on fiber creates cone scanning.  2.3.ValidationFor all volumetric images, a microscopic image of the surface of the sample was acquired and registered with the OCT volume. Staining with triphenyltetrazolium chloride (TTC) was used to identify necrotic and viable tissue for samples with ablation lesions. TTC is a vital staining where viable tissue stains red and necrotic tissue stains white. TTC vital staining is a standard procedure for assessing acute necrosis. Immediately after the imaging protocol was completed, the tissue was sliced through the center of the ablation lesion and incubated in 1.0% TTC in PBS for at . 3.ResultsVolumetric OCT images of epicardial structures on the right and left ventricles with correlated microscopic surface imaging were obtained from six swine hearts. A total of 61 volumes were obtained, where 34 volumes were from the right ventricle and 27 were from the left ventricle. An additional two hearts were used for evaluation of catheter-based imaging of epicardial substrates within ex vivo preparations. The myocardium is covered by a thin layer, called the epicardium, which appears highly reflective within OCT images. The normal myocardium had a characteristic birefringence artifact due to the highly organized structure of fibers in the myocardium (Fig. 3 ). Epicardial fat has a heterogeneous appearance within OCT images (Fig. 4 ). Adipose tissue is covered by a layer of epicardial cells and connective tissue that appears as a bright layer within OCT images. Coronary vessels appear as signal poor regions, corresponding to the empty vessel lumens (Fig. 5 ) embedded in a layer superficial to the myocardium. The location of the vessel lumens correlates well to the location of the vessels apparent in the microscope images. The unique characteristics of three tissue types are shown in Fig. 6 , where OCT volumes were recorded in heterogeneous regions with mixed tissue types. Figure 6 represents an area of fat surrounding a coronary blood vessel, and Fig. 6 represents an area with coronaries, fat, and myocardium. The distinct features of the epicardium, myocardium, epicardial fat, and coronaries are visible within slices parallel to the epicardial surface, and correlate to the microscope images of the surface. Within the B-scan images, a thick epicardial layer is observed that covers epicardial fat, which in turn surrounds the coronary vessel [Figs. 6 and 6]. A second volume encompassed an area with epicardial fat, coronary, and untreated myocardium [Fig. 6]. Within the volume, there is a transition of B-scan images encompassing untreated myocardium characterized by polarization artifact and epicardial layer, and a coronary vessel [Fig. 6] to B-scans encompassing epicardial fat, which appears heterogeneous, epicardium, and coronary [Fig. 6]. With the application of rf energy and lesion formation, the contrast between the epicardium and myocardium and the polarization-dependent artifact is lost. This is shown in Fig. 7 , where a volumetric image is obtained of an area encompassing a portion of treated tissue and untreated tissue. Fig. 3Representative images of normal myocardium imaged from epicardial surface of the left ventricle. (a) and (b) are microscope images of an epicardial surface correlating to acquired 3-D OCT image sets. The black square indicates field of view, . (c) Example B-scan image from volume represented in (a). (d) Example B-scan image from volume represented in (b). Epicardium appears as a thin bright layer (green arrow). A dark band (red arrow) within the myocardium results from birefringence properties of the myocardium. Scale box is . (Color online only.)  Fig. 4Representative images of epicardial fat imaged from the right ventricle of two hearts. (a) and (b) are microscope images of an epicardial surface correlating to acquired 3-D OCT image sets. The black square indicates field of view, . (c) Example B-scan image from volume represented in (a). (d) Example B-scan image from volume represented in (b). Beneath the layer of epicardial cells and supporting connective tissue (green arrow) is the epicardial fat (yellow arrow) consisting of adipose tissue that appears heterogeneous within OCT images. Scale box is . (Color online only.)  Fig. 5Representative images of coronary vessels from the left and right ventricle. (a) and (b) are microscope images of an epicardial surface correlating to acquired 3-D OCT image sets. The black square indicates field of view, . (c) Example B-scan image from volume represented in (a). (d) and (e) Example B-scan image of volume represented in (b). Coronary vessels appear as signal-poor regions (black arrows), corresponding to the vessel lumens. Scale box is .  Fig. 6Representative images in heterogeneous tissue regions, including myocardium (red arrow), epicardial fat (yellow arrow), and coronary vessels (black arrow). (a) Microscope image of coronary surrounded by epicardial fat. (b) OCT slice parallel to sample surface, below the surface, corresponds well to the microscope image (a). (c) Microscope image of coronary in fat and myocardium. (d) OCT slice parallel to sample surface, below the surface, corresponds well to microscope image (c). (e) and (g) Example B-scan images from volume represented in (a) and (b). A thick epicardial layer covers epicardial fat, which surrounds coronary vessel. (f) and (h) Example B-scan images from volume represented in (c) and (d). Volume acquired for area encompassing epicardial fat, coronary, and untreated myocardium. (f) B-scan encompasses untreated myocardium characterized by polarization artifact band (red arrow), epicardium (green arrow), and coronary (black arrow). (h) B-scan encompasses epicardial fat (yellow arrow), which appears heterogeneous, epicardium (green arrow), and coronary (black arrow). Scale box is . (Color online only.) 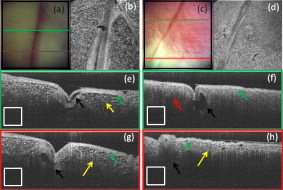 Fig. 7Representative images of epicardial radiofrequency ablation lesion within the right ventricle. (a) Microscopic image of field of view in which volumetric OCT image was obtained (black box ). (b) TTC vital staining confirming necrosis, where a transmural lesion was generated. (c), (d), and (e) are example OCT B-scans encompassing the ablation lesion (white arrow) and adjacent untreated tissue (red arrow). Untreated tissue is characterized by contrast between the epicardial layer (green arrow) and myocardium and polarization dark band artifact. Ablation lesion and necrotic tissue are characterized by absence of contrast between epicardial layer and myocardium, and absence of polarization dark band artifact. Scale box is . (Color online only.) 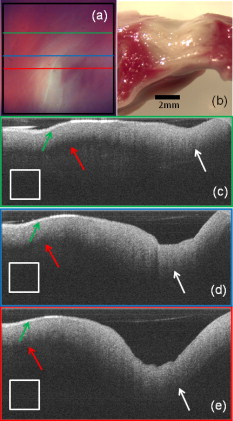 A view of the epicardial surface was obtained with the forward scanning probe in air and in the presence of saline. As shown in Fig. 8 , catheter-based OCT images of epicardial structures show similar image features as those seen in OCT images obtained with the bench-top scanner, but with slightly poorer lateral resolution. The epicardial layer and polarization artifacts due to the birefringent myocardium are visible within catheter-based images. Coronary vessels were also visible within catheter-based images. With a decrease in lateral resolution, there is an observed difference in the textural appearance of epicardial fat within catheter-based images. The texture is still heterogeneous, however, and readily differentiatable from myocardium. Fig. 8Representative images of epicardial substrates with the forward imaging catheter probe: (a) untreated myocardium, catheter in contact, (b) epicardial fat, catheter in contact, (c) epicardial fat, catheter not in contact, and (d) coronary vessel. Red arrow points to the birefringence band within untreated myocardium, green arrow points to epicardial layer, yellow arrow points to epicardial fat, and black arrow points to coronary vessel. Scale box is . (Color online only.)  4.DiscussionCurrently, there is no direct visualization of the epicardium available to electrophysiologists performing epicardial RFA procedures. Here, we demonstrated that OCT has the potential for guidance of epicardial radiofrequency ablation therapy by identification of coronary vessels, epicardial fat, and normal myocardium. 4.1.Substrate CharacterizationPrevious studies have characterized the optical properties of myocardium,35, 36 blood,35 epicardial fat,37 vessel wall of different compositions,35 and myocardial radiofrequency ablation lesions36 and myocardial laser ablation lesions.37 It was shown that epicardial fat has significantly lower absorption than myocardium,37 blood has high absorption,35 and myocardial RFA lesions have an increased scattering coefficient.36, 37 Histological analysis of myocardium exposed to thermal damage showed decrease in birefringence within ablation lesions.38 These varied optical properties are recapitulated at wavelength and provide intrinsic contrast within OCT images of epicardial substrates. In addition to bulk optical properties, each tissue type has a characteristic microstructure that provides contrast within OCT images. The normal myocardium was characterized by a strong birefringence artifact and bright epicardial layer. High contrast between the epicardium and the myocardium was observed within all images of the untreated myocardium. In all cases, there was an absence of a birefringence-dependent artifact within RFA lesions, and a decrease in contrast between the epicardium and myocardium. These result are consistent with our previous results, imaging lesions created on the endocardial surface, where we demonstrated a sensitivity and specificity of 94.5 and 86.7% respectively, for distinguishing ablation lesions from untreated tissue.18 The location in depth of the birefringence-dependent artifact within untreated myocardium varies, and is affected by multiple factors including the orientation of the myofibers and bending of the probe. This variability in the location of the band within images of the untreated myocardium can be seen in Figs. 3 and 3, and in a few cases the band may be difficult to discern [e.g., Fig. 3]. Although the polarization-dependent artifact is strong, future work will explore the use of polarization-sensitive OCT for quantitative assessment of tissue birefringence to more accurately distinguish ablation lesions from untreated tissue. The loss of contrast between the epicardium and myocardium within an ablation lesion may be due to the increase in scattering coefficient of the necrotic myocardium, reducing the scattering mismatch between the epicardium and myocardium. Our experimental samples were freshly excised swine ventricular wedges, without coronary blood flow. We were able to identify vessels as signal-poor regions, correlating to the lumen of the vessel. OCT has been demonstrated to visualize blood vessels in vivo in ophthalmology with the use of the Doppler effect and to observe shadowing created by light absorption by blood.27, 39 In vivo, coronary vessels will obviously be filled with blood, so the lumens will not appear as voids. However, shadows will be apparent due to light absorption and scattering by the blood. In addition, the use of Doppler OCT39 and/or speckle modulation40 can be used to identify blood vessels using blood flow as the contrast mechanism. Therefore, we believe OCT will be able to identify coronary vessels of different sizes by identifying tissue regions with a shadow and exhibiting flow. Epicardial fat has a clear, characteristic heterogeneous appearance within OCT images. These results are consistent with previous applications of low coherence interferometery of adipose tissue from the breast, showing a heterogeneous axial scan profile.28 4.2.Real-Time GuidanceBecause of the severe adverse complications that can arise due to epicardial ablation, preliminary studies have been conducted to evaluate the use of a flexible, steerable endoscope, in diameter, to guide epicardial procedures by identifying coronaries.41 Air was used to expand the pericardial space and provided visualization of critical structures, rf catheter, and ablation lesions. However, image quality was diminished in the presence of saline flushing. As compared to the use of an endoscope for guidance, OCT provides subsurface imaging and can be implemented in small diameter catheter probes. As demonstrated here, even with lateral resolution, catheter-based OCT can be used to identify critical structures. By imaging with a catheter probe, the same heterogeneous pattern was observed with images of epicardial fat, identification of vessel lumens, epicardial layer, and polarization artifact. Due to the fact that there is no convective cooling of the tissue surface during epicardial ablation, as there is during endocardial ablation due to blood flow, the use of saline irrigated rf catheters are becoming increasingly common. Saline irrigated catheters keep the surface of the tissue cool, allowing increased power delivery, resulting in deeper lesions. Real-time viewing with the prototype flexible forward imaging OCT catheter provided a visualization of the epicardial surface (Fig. 8). Maintenance of adequate tissue contact is one of the main parameters ensuring efficient energy delivery. Using the forward imaging probe, tissue contact can be assessed in the presence or absence of saline flushing. OCT has been demonstrated to image in the presence of saline flushes for intravascular imaging25 and within a saline bath with superperfusion flow (Fig. 8). Although the field of view of OCT is limited, real-time imaging with OCT, integrated with rf ablation, can potentially inform the operator when the ablation catheter is in the vicinity of epicardial fat or a coronary vessel. 4.3.Future WorkAll of the current work was conducted using freshly excised swine hearts. We demonstrated that we can observe similar image features in OCT images of epicardial fat, normal myocardium, and coronary vessels using bench-top and catheter-based imaging. Future work is needed to evaluate the ability for OCT to observe these features in large animals in vivo. Due to the millimeter-scale field of view of OCT, for monitoring and guidance of epicardial RFA through a percutaneous approach, the OCT catheter should be integrated with an rf ablation catheter. An integrated catheter will allow OCT imaging of epicardial substrates directly in contact with the RFA catheter. The diameter of the integrated catheter should be small enough to allow percutaneous access to the pericardium through a standard introducer sheath used in the RFA procedure, typically . In vivo experiments are needed to determine whether the texture and architectural features observed during our ex vivo experiments can be observed in the presence of the motion of a beating heart and blood flow within coronary vessels. Other epicardial substrates of interest are myocardial infarction42 for the ablation of ventricular tachycardia, and the pulmonary veins43 during epicardial ablation of atrial fibrillation. 5.ConclusionThis study demonstrates that optical coherence tomography has the potential for guidance of epicardial radiofrequency ablation procedures. Our experimental results show that critical epicardial structures, coronaries, epicardial fat, and myocardium have distinct appearances within OCT images. A direct image by OCT can aid in guiding the application of energy by identifying coronary vessels to determine if energy delivery can be carried out safely. In addition, confirmation of epicardial fat will reduce ambiguity in interpreting electrograms and will allow appropriate titration of rf power dosage or increased energy delivery duration to increase lesion efficacy. Together, guidance by OCT to provide real-time cross sectional imaging for substrate identification can decrease complications and increase success rates. AcknowledgmentsThe authors would like to thank Steve Schomisch and Hui Wang for technical assistance. The project was supported by the Wallace H. Coulter Foundation and by the National Institutes of Health (HL085939, HL083048, and RR1246). The content is solely the responsibility of the authors and does not necessarily represent the official views of the National Heart Lung and Blood Institute or the National Institutes of Health. ReferencesW. Rosamond, K. Flegal, K. Furie, A. Go, K. Greenlund, N. Haase, S. M. Hailpern, M. Ho, V. Howard, B. Kissela, S. Kittner, D. Lloyd-Jones, M. McDermott, J. Meigs, C. Moy, G. Nicho, C. O’Donnell, V. Roger, P. Sorlie, J. Steinberger, T. Thom, M. Wilson, and Y. Hong,
“Heart disease and stroke statistics◻2008 update: a report from the American Heart Association Statistics Committee and Stroke Statistics Subcommittee,”
Circulation, 117 e25
–e146
(2008). https://doi.org/10.1161/CIRCULATIONAHA.107.187998 0009-7322 Google Scholar
S. K. S. Huang and M. A. Wood, Catheter Ablation of Cardiac Arrhythmias, Saunders, New York (2006). Google Scholar
C. Grimard, J. Lacotte, F. Hidden-Lucet, G. Duthoit, Y. Gallais, and R. Frank,
“Percutaneous epicardial radiofrequency ablation of ventricular arrhythmias after failure of endocardial approach: a experience,”
J. Cardiovasc. Electrophysiol., 21 56
–61
(2010). https://doi.org/10.1111/j.1540-8167.2009.01544.x 1045-3873 Google Scholar
E. Sosa and M. Scanavacca,
“Epicardial mapping and ablation techniques to control ventricular tachycardia,”
J. Cardiovasc. Electrophysiol., 16 449
–452
(2005). https://doi.org/10.1046/j.1540-8167.2005.40796.x 1045-3873 Google Scholar
Ventricular Arrhythmias and Sudden Cardiac Death: Mechanism, Ablation, and Defibrillation, Blackwell, Malden, MA(2008). Google Scholar
A. d’Avila, C. Houghtaling, P. Gutierrez, O. Vragovic, J. N. Ruskin, M. E. Josephson, and V. Y. Reddy,
“Catheter ablation of ventricular epicardial tissue: a comparison of standard and cooled-tip radiofrequency energy,”
Circulation, 109 2363
–2369
(2004). https://doi.org/10.1161/01.CIR.0000128039.87485.0B 0009-7322 Google Scholar
A. e. d’Avila, R. Splinter, R. H. Svenson, M. Scanavacca, E. Pruitt, J. Kasell, and E. Sosa,
“New perspectives on catheter-based ablation of ventricular tachycardia complicating Chagas’ disease: experimental evidence of the efficacy of near infrared lasers for catheter ablation of Chagas’ VT,”
J. Interv Card. Electrophysiol., 7 23
–38
(2002). https://doi.org/10.1023/A:1020811915133 1383-875X Google Scholar
S. Dixit, N. Narula, D. J. Callans, and F. Marchlinski,
“Electroanatomic mapping of human heart: epicardial fat can mimic scar,”
J. Cardiovasc. Electrophysiol., 14 1128
(2003). https://doi.org/10.1046/j.1540-8167.2003.03138.x 1045-3873 Google Scholar
A. D’Avila, P. Gutierrez, M. Scanavacca, V. Reddy, D. L. Lustgarten, E. Sosa, and J. A. Ramires,
“Effects of radiofrequency pulses delivered in the vicinity of the coronary arteries: implications for nonsurgical transthoracic epicardial catheter ablation to treat ventricular tachycardia,”
Pacing Clin. Electrophysiol., 25 1488
–1495
(2002). https://doi.org/10.1046/j.1460-9592.2002.01488.x 0147-8389 Google Scholar
A. d’Avila,
“Epicardial catheter ablation of ventricular tachycardia,”
Heart Rhythm, 5 S73
–S75
(2008). https://doi.org/10.1016/j.hrthm.2008.01.035 1547-5271 Google Scholar
H. Ashikaga, T. Sasano, J. Dong, M. M. Zviman, R. Evers, B. Hopenfeld, V. Castro, R. H. Helm, T. Dickfeld, S. Nazarian, J. K. Donahue, R. D. Berger, H. Calkins, M. R. Abraham, E. Marbán, A. C. Lardo, E. R. McVeigh, and H. R. Halperin,
“Magnetic resonance-based anatomical analysis of scar-related ventricular tachycardia: implications for catheter ablation,”
Circ. Res., 101 939
–947
(2007). https://doi.org/10.1161/CIRCRESAHA.107.158980 0009-7330 Google Scholar
B. Desjardins, T. Crawford, E. Good, H. Oral, A. Chugh, F. Pelosi, F. Morady, and F. Bogun,
“Infarct architecture and characteristics on delayed enhanced magnetic resonance imaging and electroanatomic mapping in patients with postinfarction ventricular arrhythmia,”
Heart Rhythm, 6 644
–651
(2009). https://doi.org/10.1016/j.hrthm.2009.02.018 1547-5271 Google Scholar
J. F. Ren and F. E. Marchinski,
“Utility of intracardiac echocardiography in left heart ablation for tachyarrhythmias,”
Echocardiogr., 24 533
–540
(2007). https://doi.org/10.1111/j.1540-8175.2007.00426.x 0742-2822 Google Scholar
S. Abbara, J. C. Desai, R. C. Cury, J. Butler, K. Nieman, and V. Reddy,
“Mapping epicardial fat with multi-detector computed tomography to facilitate percutaneous transepicardial arrhythmia ablation.,”
Eur. J. Radiol., 57 417
–422
(2006). https://doi.org/10.1016/j.ejrad.2005.12.030 0720-048X Google Scholar
S. Sarin, C. Wenger, A. Marwaha, A. Qureshi, B. D. Go, C. A. Woomert, K. Clark, L. A. Nassef, and J. Shirani,
“Clinical significance of epicardial fat measured using cardiac multislice computed tomography.,”
Am. J. Cardiol., 102 767
–771
(2008). https://doi.org/10.1016/j.amjcard.2008.04.058 0002-9149 Google Scholar
Optical Coherence Tomography: Technology and Applications, Springer, New York (2008). Google Scholar
M. W. Jenkins, R. S. Wade, Y. Cheng, A. M. Rollins, and I. R. Efimov,
“Optical coherence tomography imaging of the Purkinje network,”
J. Cardiovasc. Electrophysiol., 16 559
–560
(2005). https://doi.org/10.1046/j.1540-8167.2005.30621.x 1045-3873 Google Scholar
C. P. Fleming, K. J. Quan, H. Wang, G. Amit, and A. M. Rollins,
“In vitro characterization of cardiac radiofrequency ablation lesions using optical coherence tomography,”
Opt. Express, 18 3079
–3092
(2010). https://doi.org/10.1364/OE.18.003079 1094-4087 Google Scholar
K. Schoenenberger, J. Bill W. Colston, D. J. Maitland, L. B. D. Silva, and M. J. Everett,
“Mapping of birefringence and thermal damage in tissue by use of polarization-sensitive optical coherence tomography,”
Appl. Opt., 37 6026
–6036
(1998). https://doi.org/10.1364/AO.37.006026 0003-6935 Google Scholar
J. F. de Boer, S. M. Srinivas, A. Malekafzali, Z. Chen, and J. S. Nelson,
“Imaging thermally damaged tissue by polarization sensitive optical coherence tomography,”
Opt. Express, 3 212
–218
(1998). https://doi.org/10.1364/OE.3.000212 1094-4087 Google Scholar
M. Gupta, A. M. Rollins, J. A. Izatt, and I. R. Efimov,
“Imaging of the atrioventricular node using optical coherence tomography,”
J. Cardiovasc. Electrophysiol., 13 95
(2002). https://doi.org/10.1046/j.1540-8167.2002.00095.x 1045-3873 Google Scholar
W. Hucker, C. Ripplinger, C. P. Fleming, V. Fedorov, A. M. Rollins, and I. R. Efimov,
“Bimodal biophotonic imaging of the structure-function relationship in cardiac tissue,”
J. Biomed. Opt., 13
(5), 054012
(2008). https://doi.org/10.1117/1.2975826 1083-3668 Google Scholar
C. P. Fleming, C. Ripplinger, B. Webb, I. R. Efimov, and A. M. Rollins,
“Quantification of cardiac fiber orientation using optical coherence tomography,”
J. Biomed. Opt., 13
(3), 030505
(2008). https://doi.org/10.1117/1.2937470 1083-3668 Google Scholar
C. M. Ambrosi, N. Moazami, A. M. Rollins, and I. R. Efiomv,
“Virtual histology of the human heart using optical coherence tomography,”
J. Biomed. Opt., 14
(5), 054002
(2009). https://doi.org/10.1117/1.3213604 1083-3668 Google Scholar
G. J. Tearney, S. Waxman, M. Shishkov, B. J. Vakoc, M. J. Suter, M. I. Freilich, A. E. Desjardins, W. Y. Oh, L. A. Bartlett, M. Rosenberg, and B. E. Bouma,
“Three-dimensional coronary artery microscopy by intracoronary optical frequency domain imaging,”
JACC: Cardiovasc. Imag., 1 752
(2008). https://doi.org/10.1016/j.jcmg.2008.06.007 Google Scholar
A. F. Low, G. J. Tearney, B. E. Bouma, and I. K. Jang,
“Technology insight: optical coherence tomography—current status and future development,”
Nature Clinic. Practice Cardiovasc. Med., 3 154
–162
(2006). https://doi.org/10.1038/ncpcardio0482 Google Scholar
T. Fabritius, S. Makita, Y. Hong, R. Myllyla, and Y. Yasuno,
“Automated retinal shadow compensation of optical coherence tomography images,”
J. Biomed. Opt., 14
(1), 010503
(2009). https://doi.org/10.1117/1.3076204 1083-3668 Google Scholar
B. D. Goldberg, N. V. Iftimia, J. E. Bressner, M. B. Pitman, E. Halpern, B. E. Bouma, and G. J. Tearney,
“Automated algorithm for differentiation of human breast tissue using low coherence interferometry for fine needle aspiration biopsy guidance,”
J. Biomed. Opt., 13
(1), 014014
(2008). https://doi.org/10.1117/1.2837433 1083-3668 Google Scholar
K. W. Gossage, T. S. Tkaczyk, J. J. Rodriguez, and J. K. Barton,
“Texture analysis of optical coherence tomography images: feasibility for tissue classification,”
J. Biomed. Opt., 8
(3), 570
–575
(2003). https://doi.org/10.1117/1.1577575 1083-3668 Google Scholar
Z. Hu and A. M. Rollins,
“Fourier domain optical coherence tomography with a linear-in-wavenumber spectrometer,”
Opt. Lett., 32 3525
–3527
(2007). https://doi.org/10.1364/OL.32.003525 0146-9592 Google Scholar
Z. Hu and A. M. Rollins,
“Quasi-telecentric optical design of a microscope-compatible OCT scanner,”
Opt. Express, 13 6407
–6415
(2005). https://doi.org/10.1364/OPEX.13.006407 1094-4087 Google Scholar
G. J. Tearney, M. E. Brezinski, J. F. Southern, B. E. Bouma, M. R. Hee, and J. G. Fujimoto,
“Determination of the refractive index of highly scattering human tissue by optical coherence tomography,”
Opt. Lett., 20 2258
–2260
(1995). https://doi.org/10.1364/OL.20.002258 0146-9592 Google Scholar
C. P. Fleming, H. Wang, K. J. Quan, and A. M. Rollins,
“Real time monitoring of cardiac radiofrequency ablation lesion formation using a forward imaging optical coherence tomography catheter,”
J. Biomed. Opt., 15 030516
(2010). https://doi.org/10.1117/1.3459134 1083-3668 Google Scholar
A. Ahmad, S. G. Adie, E. J. Chaney, U. Sharma, and S. A. Boppart,
“Cross-correlation-based image acquisition technique for manually-scanned optical coherence tomography,”
Opt. Express, 17 8125
–8136
(2009). https://doi.org/10.1364/OE.17.008125 1094-4087 Google Scholar
W. F. Cheong, S. A. Prahl, and A. J. Welch.,
“A review of the optical properties of biological tissues,”
IEEE J. Quantum Electron., 26 2166
–2185
(1990). https://doi.org/10.1109/3.64354 0018-9197 Google Scholar
J. Swartling, S. Palsson, P. Platonov, S. B. Olsson, and S. Andersson-Engels,
“Changes in tissue optical properties due to radio-frequency ablation of myocardium,”
Med. Biol. Eng. Comput., 41 403
–409
(2003). https://doi.org/10.1007/BF02348082 0140-0118 Google Scholar
R. Splinter, R. H. Svenson, L. Littmann, C. H. Chuang, J. R. Tuntelder, M. Thompson, G. P. Tatsis, and M. Keijzer,
“Computer simulated light distributions in myocardial tissue at the Nd-YAG wavelength of 1064,”
Lasers Med. Sci., 8 15
–21
(1993). https://doi.org/10.1007/BF02559750 0268-8921 Google Scholar
P. Whittaker, S. Zheng, M. J. Patterson, R. A. Kloner, K. E. Daly, and R. A. Hartman,
“Histologic signatures of thermal injury: applications in transmyocardial laser revascularization and radiofrequency ablation,”
Lasers Surg. Med., 27 305
–318
(2000). https://doi.org/10.1002/1096-9101(2000)27:4<305::AID-LSM3>3.0.CO;2-W 0196-8092 Google Scholar
Y. K. Tao, K. M. Kennedy, and J. A. Izatt,
“Velocity-resolved 3D retinal microvessel imaging using single-pass flow imaging spectral domain optical coherence tomography,”
Opt. Express, 17 4177
–4188
(2009). https://doi.org/10.1364/OE.17.004177 1094-4087 Google Scholar
A. Mariampillai, B. A. Standish, E. H. Moriyama, M. Khurana, N. R. Munce, M. K. Leung, J. Jiang, A. Cable, B. C. Wilson, I. A. Vitkin, and V. X. Yang,
“Speckle variance detection of microvasculature using swept-source optical coherence tomography,”
Opt. Lett., 33 1530
–1532
(2008). https://doi.org/10.1364/OL.33.001530 0146-9592 Google Scholar
S. Nazarian, S. V. Kantsevoy, M. M. Zviman, F. A. r. Matsen, H. Calkins, R. D. Berger, and H. R. Halperin,
“Feasibility of endoscopic guidance for nonsurgical transthoracic atrial and ventricular epicardial ablation,”
Heart Rhythm, 5 1115
–1119
(2008). https://doi.org/10.1016/j.hrthm.2008.05.004 1547-5271 Google Scholar
A. Codreanu, F. Odille, E. Aliot, P. Y. Marie, I. Magnin-Poull, M. Andronache, D. Mandry, W. Djaballah, D. Régent, J. Felblinger, and C. d. Chillou,
“Electroanatomic characterization of post-infarct scars: comparison with 3-dimensional myocardial scar reconstruction based on magnetic resonance imaging,”
J. Am. Coll. Cardiol., 52 839
–842
(2008). https://doi.org/10.1016/j.jacc.2008.05.038 0735-1097 Google Scholar
H. N. Pak, C. Hwang, H. E. Lim, J. S. Kim, and Y. H. Kim,
“Hybrid epicardial and endocardial ablation of persistent or permanent atrial fibrillation: a new approach for difficult cases,”
J. Cardiovasc. Electrophysiol., 18 917
–923
(2007). https://doi.org/10.1111/j.1540-8167.2007.00882.x 1045-3873 Google Scholar
|


