
|
|
1.IntroductionOptical tomography using diffused near-infrared (NIR) light has demonstrated potential value in distinguishing benign from malignant tumors and in assessing chemotherapy responses in cancer patients.1, 2, 3, 4, 5, 6, 7, 8, 9, 10, 11, 12, 13, 14, 15, 16, 17, 18, 19 We have introduced an ultrasound-guided optical tomography approach that integrates a commercial ultrasound transducer with optical sources and detectors in a hand-held probe. The real-time ultrasound helps to localize the lesion and to improve the light quantification of the lesion by providing the lesion geometry to the optical imaging reconstruction algorithm.19 In our imaging setup, patients are scanned in a supine position, and multiple sets of optical measurements are simultaneously made with pulse-echo ultrasound images at the lesion location and at a contralateral region of the normal breast (reference site). The perturbation between the measurements obtained at the lesion and reference sites is used for imaging reconstruction. Using reflection geometry, the breast-tissue thickness reduces to less than when patients are scanned in a supine position. Therefore, lesions close to the chest wall can be imaged. However, when the chest-wall thickness is less than from the skin surface, the semi-infinite imaging medium is not a valid assumption for optical measurements, and the chest wall underneath the breast tissue affects the measurements obtained from distant source-detector pairs. To reduce the effect of the chest wall on the reconstructed optical images, several approaches have been introduced.11, 20, 21, 22, 23, 24, 25, 26 A simple filtering method has been used to remove distant source-detector measurements.20 However, in many clinical cases, it is difficult to remove the distant source-detector measurements without losing lesion information. To utilize useful information from distant pairs, an analytical method has been introduced to model a breast as a two-layer medium of breast tissue and chest wall.11, 21, 22, 23 However, this method is limited to a subset of patients whose breast tissue and chest-wall layer has a flat interface with respect to the imaging probe. Because numerical algorithms based on finite element methods (FEMs) are suitable for modeling complex boundary conditions,24, 25 a FEM has been adapted to model the breast tissue and chest wall as a two-layer medium with either a flat or titled interface, as typically encountered in clinical studies. In an earlier study,26 FEM-based imaging reconstruction has been implemented in reflection geometry, and the effect of the chest wall on breast lesion reconstruction has been systematically investigated. Results have shown that chest-wall depth, titling angle, and accuracy of estimated optical properties of two layers affect lesion reconstruction differently. In this study, the semi-infinite model-based reconstruction and the two-layer model-based reconstruction are compared by using simulations, phantom experiments, and data from a group of patients. Results have shown that the two-layer model improves the light quantification of the targets. The improvements are attributed to the improved background estimation and the more accurate weight matrix calculation using the two-layer medium compared to the semi-infinite medium. Fitted two-layer background optical properties obtained from a group of ten patients with the chest wall located less than deep are more representative of breast tissue and chest-wall optical properties. 2.Methods and Computational Procedures2.1.Computational AlgorithmsTo estimate two-layer optical properties with an arbitrary breast-tissue and chest-wall interface, the FEM has been used to generate a 3-D mesh consisting of breast tissue and the chest wall. The breast-tissue and chest-wall interface depth and tilting angle are extracted from the coregistered ultrasound images measured at a contralateral reference site. For a semi-infinite model, the depth of the medium is chosen as . The frequency domain diffusion approximation and the Robin-type (type 3) boundary condition are adopted in the forward computation.26 A nonlinear regression algorithm based on the Nelder-Mead method27 has been adopted to estimate the two-layer optical parameters. This algorithm is a multidimensional unconstrained minimization method, and has been used to estimate tissue optical properties from two-layer tissue structures in our earlier studies.21, 23, 26 The convergence rate of the algorithm is in the range of 150 to 230 iterations, which is slow. However, fitted first-layer background optical properties can reach 30% of the true value in simulations and phantom experiments. The fitting error of the second-layer optical properties depends on the depth of the two-layer interface and increases as the depth of the second layer increases. As expected, when the second layer is deeper, it affects closer source-detector pair measurements less and distant source-detector pairs more. In general, distant measurements have lower signal-to-noise ratio. The fitted absorption and reduced scattering coefficients of the first and second layers are used to estimate the forward photon density wave as follows: where , , , and are the estimated absorption and reduced scattering coefficients of the first and second layers, respectively. The objective function is the summation of the error square between the measured and calculated phase and amplitude profiles. In all simulations, 1% Gaussian noise has been added to the forward data for fitting background optical properties.For image reconstruction, the two-layer geometry information of the target (lesion) site obtained from ultrasound images, and the optical properties obtained from the nonlinear regression fitting algorithm, have been used to form a 3-D FEM model of the breast tissue and chest wall. A 3-D Jacobian weight matrix has been formed for image reconstruction, where is the total number of detector readings and is the total number of imaging voxels. To speed up the Jacobian matrix calculation and improve the reconstructed target absorption coefficient, a dual-zone mesh scheme with a region of interest (ROI), indentified by coregistered ultrasound has been used for the weight matrix calculation.19 In the simulation, the imaging voxel size within the ROI is chosen as , and the voxel outside of the ROI as . In phantom and clinical experiments, the imaging voxel size within the ROI is chosen as based on the consideration of system signal-to-noise ratio and the size of ROI, and the voxel outside of the ROI is . A conjugate gradient method has been used for reconstruction of optical absorption properties of targets. A flowchart of the two-layer model-based reconstruction method is given in Fig. 1 .Fig. 1Flow chart of the image reconstruction procedures. The reference data obtained from the reference site were used to fit the background properties of a two-layer medium. The layer depth and tilting angle measured from coregistered ultrasound was used to segment the medium as breast tissue and chest wall. The fitted background optical properties were input into the FEM model to compute the weight matrix for inversion. The depth at the target site was also estimated from ultrasound to segment the medium with different background optical properties obtained from fitting for weight matrix computation.  2.2.Experimental Methods2.2.1.Phantom experimentsThe NIR source system used for experiments consists of two laser diodes of 780 and , which are sequentially switched by optical switches to nine source positions on a hand-held probe. The NIR detection system consists of ten parallel detectors. A commercial ultrasound probe was integrated in the middle of the hand-held probe to measure the tilting angle and the depth of the two-layer interface, and also the size and region of the target. The ultrasound depth resolution depends on the wavelength and is in the range of few hundred microns for the broadband transducer we used. Therefore, the titling angle and depth were measured with reasonable accuracy. After capturing ultrasound images from the target and reference sites, medium geometry information is used by the FEM to generate a 3-D mesh geometry of the breast tissue and chest wall. For phantom experiments, intralipid and solid plastisol phantoms were used to emulate breast-tissue and chest-wall layers, respectively. The two-layer phantom was imaged twice with and without a target. In the following sections, the measurements obtained from the medium with a target are referred to as the target data, and the medium without any target is referred to as the reference data. The reference data were employed to estimate background optical properties; however, both reference and target data have been used in the image reconstruction algorithm. 2.2.2.Clinical studiesAn identical optical system has been used for clinical studies. The study protocol was approved by a local institutional review board. Patients were scanned in a supine position and multiple sets of optical measurements were simultaneously made with ultrasound images obtained at the lesion site and a contralateral location of the normal breast. The data obtained from the normal breast were used to estimate the background optical properties, and the difference or perturbation between the lesion and reference data was used for reconstructing absorption distribution. The total hemoglobin distribution was then computed from absorption maps obtained at 780 and .18 3.Results3.1.Simulations3.1.1.Effects of second-layer location on estimation of background optical properties and target absorptionIn many clinical cases, the chest wall does not have a major effect on the optical measurements, and the background can be considered as a homogeneous and semi-infinite medium. However, for patients who have a small amount of breast tissue, i.e., the chest wall is located or less from the probe, the effect of the chest wall on the measurement data cannot be neglected and should be considered in the image reconstruction model. The following examples show the necessity of adapting a two-layer model for image reconstruction. Figures 2, 2, 2, 2 show the fitted optical properties of the two-layer medium using the two-layer and semi-infinite models, respectively. The different interface depth and tilting angle is presented in the axis. The results show that the error of the fitted optical properties increases when the depth of the two-layer interface is closer to the surface if the semi-infinite model is used. However, the two-layer model can estimate the optical properties of the two-layer medium within 13% of the true value when the chest-wall interface is less than deep. Fig. 2Fitted optical properties of two-layer media with true values of , , , and . Dashed lines show the true values. Blue squares show the fitted values obtained by the two-layer model, and red dots show the fitted values obtained from the semi-infinite model. The axis shows the position and tilting angle of the second layer from the probe surface. (Color online only.) 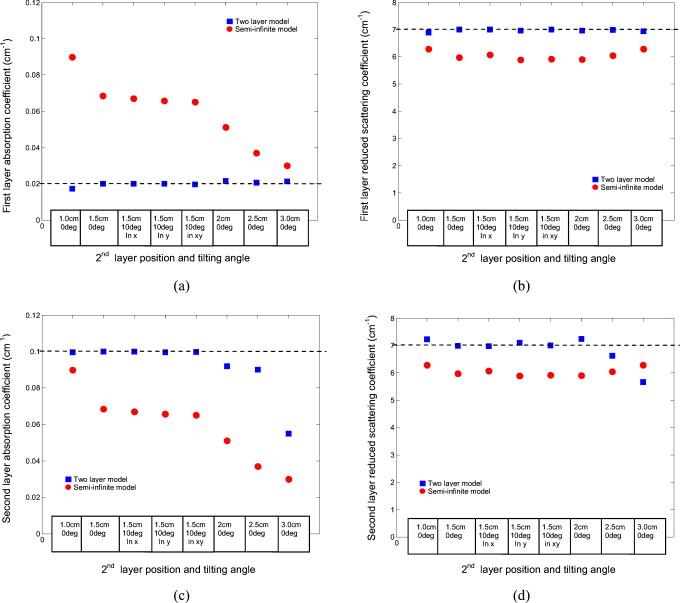 As the depth of the second layer increases, the measurements contain less information from the second layer, as most of the optical paths are confined in the first layer. Therefore, the accuracy of the estimated optical properties of the second layer decreases. Under this condition, the measurement data from the lesion are affected more by the first layer optical properties than by the second layer. Therefore, the performance of the semi-infinite model is similar to that of the two-layer model. Figure 3 shows the reconstructed maximum absorption coefficient of a -diam target when the second layer was located at different depths with different tilting angles from the optical probe. The optical properties of the target were and , and the target center was located at depth. The results show that when the two-layer interface is closer to the surface, the error of the reconstructed maximum absorption coefficient of the target increases from 20 to 200% in the semi-infinite model when the second-layer depth decreases from . This error can cause misclassification of a benign lesion into the malignant category, because the reconstructed absorption is higher than its true value. However, the two-layer model can reconstruct the target absorption coefficient within 10% of the true value. Fig. 3Reconstructed maximum absorption coefficient of a -diam spherical target embedded in the same two-layer medium, as given in Fig. 2. The second layer was located at depth with 0 and angled in difference directions, and 2-, 2.5-, and depth with zero-degree tilting angle from the probe surface. The target was positioned at , , and . Dashed lines show the true value. Red dots and blue squares show the reconstructed maximum absorption coefficients of the target using the semi-infinite and two-layer models, respectively. The axis shows the position and tilting angle of the two-layer interface from the probe surface. (Color online only.) 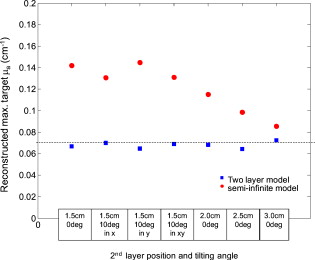 3.1.2.Effect of second-layer optical properties on estimation of background optical properties and target absorptionIn addition to the location of the second layer, the error caused by using the semi-infinite model also depends on the optical properties of the second layer. Figure 4 shows the fitted optical properties of the two-layer medium for different second-layer absorption coefficients, as given in the axis. The results indicate that the error of the fitted values obtained by the semi-infinite model increases when the absorption coefficient of the second layer increases. However, the two-layer model is capable of estimating optical properties of both layers, (except for ) within 10% error. Fig. 4Fitted optical properties of two-layer media with different optical properties. The two-layer interface was located at depth with tilting angle from the probe. Dashed lines show the true optical properties of the two-layer media. Blue squares and red dots show the fitted values obtained from the two-layer and semi-infinite models when the second-layer absorption coefficient increases, as shown in the axis. In each figure, the axis shows the optical properties of the two-layer medium, and the axis shows (a) the fitted first-layer absorption coefficient, (b) first-layer reduced scattering coefficient, (c) second-layer absorption coefficient, and (d) second-layer reduced scattering coefficient. (Color online only.) 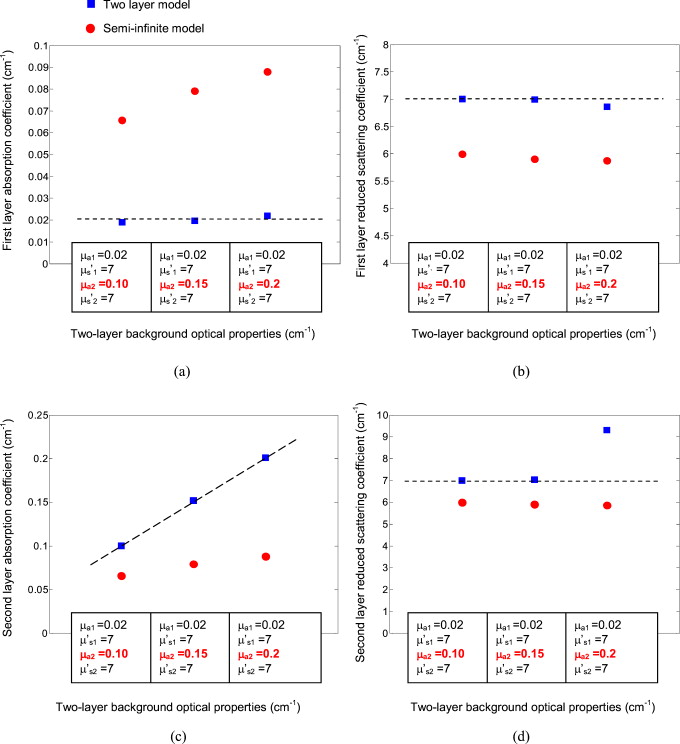 The fitting error of the second layer is larger than that of due to its smaller contribution to the measurement data as compared with . Figure 5 demonstrates the effect of [Figs. 5 and 5] and [Figs. 5 and 5] on measured amplitude (in logarithmic sale) and phase profiles as a function of the source-detector distance. The simulated two-layer medium had an interface located at depth with a tilting angle. Optical properties of the first layer were and . was fixed at in Figs. 5 and 5, and was fixed at in Figs. 5 and 5. The results show that has more influence on the measurement data than that of . As a result, the accuracy of the estimated second-layer absorption coefficient is higher than that of the reduced scattering coefficient. Fig. 5(a) Amplitude (logarithmic scale) and (b) phase profiles of reflectance measurements for different second-layer absorption coefficients from . The other optical properties of the two-layer medium were , , and . (c) Amplitude (logarithmic scale) and (d) phase profiles of reflectance measurements for different second-layer reduced scattering coefficients from . The other optical properties of the medium were , , and . The two-layer interface was located at with a tilting angle from the probe. is the source-detector distance.  Figure 6 shows the reconstructed maximum absorption coefficient of a -diam target embedded in a different second-layer background absorption coefficient. The target was located at depth with optical properties of and . The background optical properties were the same as those used in Fig. 4. The results show that by increasing the absorption coefficient of the second layer, the error of the reconstructed maximum absorption coefficient of the target increases in the semi-infinite model. Again, this error can cause misclassification of a benign lesion into the malignant category. However, the target absorption coefficient can be reconstructed within 10% of the true value when the two-layer model is used. Fig. 6Reconstructed maximum absorption coefficient of a spherical target embedded in a two-layer medium with different second-layer absorption coefficients. The two-layer interface was located at depth with tilting angle from the probe surface. The target was positioned at , , and . The dashed line shows the true values. Red dots and blue squares show the maximum value of the reconstructed absorption coefficient of the target using the semi-infinite and two-layer models, respectively. The axis shows the optical properties of the two-layer media. (Color online only.) 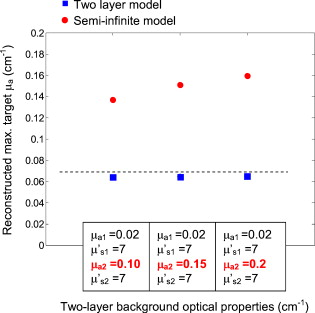 A two-layer model of optical properties of , , and was used to compare the performance of a semi-infinite model when the second-layer reduced scattering coefficient was different than its first layer. Figure 7 shows the fitted optical properties of the two-layer medium as varies from . The second layer was located at with a tilting angle from the probe. At the higher reduced scattering coefficient of , the error of fitted first-layer background absorption is about 1.8 times of the true value, in the semi-infinite model. Fig. 7Fitted optical properties of two-layer media with different second-layer reduced scattering coefficients. The two-layer interface was located at depth with tilting angle from the probe. Dashed lines show the true optical properties of the two-layer media. Blue squares and red dots show the fitted values obtained from the two-layer and semi-infinite models when the second-layer reduced scattering coefficient increases, as shown in the axis. In each figure, the axis shows the optical properties of the two-layer medium, and the axis shows (a) the fitted first-layer absorption coefficient, (b) first-layer reduced scattering coefficient, (c) second-layer absorption coefficient, and (d) second-layer reduced scattering coefficient. (Color online only.)  Figure 8 compares the reconstructed maximum absorption coefficient of the target when the second-layer reduced scattering coefficient varies from . The target location and optical properties were the same as those used in Fig. 6. The optical properties of the two-layer medium were the same as those used in Fig. 7. At the higher scattering coefficient of , the reconstructed maximum absorption coefficient of the target is about 1.5 times the true value, in the semi-infinite model.. Fig. 8Reconstructed maximum absorption coefficient of a spherical target embedded in a two-layer medium with different second-layer reduced scattering coefficients. The two-layer interface was located at depth with tilting angle from the probe surface. The target was positioned at , , and . The dashed line shows the true values. Red dots and blue squares show the maximum value of the reconstructed absorption coefficient of the target using the semi-infinite and two-layer models, respectively. The axis shows the optical properties of the two-layer media. (Color online only.) 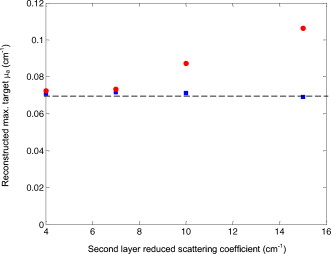 3.2.Phantom ExperimentsTo validate the results of the simulation, phantom experiments with various two-layer interface depths and tilting angles were performed. The top layer of the medium was made of 0.8% intralipid solution of calibrated absorption and reduced scattering coefficients of and . The bottom layer was made of solid plastisol phantom with calibrated optical properties of and at . Figures 9 and 9 show the B-scan ultrasound images of the and cross section of the two-layer medium with and without the target, respectively. The plastisol phantom, which was used as a chest-wall layer, was placed at with a tilting angle from the probe surface. The target was a -diam spherical solid absorber with calibrated optical properties of and at . The target was located at inside the intralipid solution. The fitted absorption and reduced scattering coefficients of the two-layer medium obtained by the two-layer model were , , , and at . The fitted optical properties as estimated by the semi-infinite model were and . Figures 9 and 9 show the reconstructed absorption coefficient of the target obtained by the two-layer and semi-infinite models, respectively. In the absorption map, each slice presents a spatial image of obtained from underneath the probe surface to in depth with increments between slices. Table 1 shows the fitted background optical properties and reconstructed absorption coefficient of a target located at different depths. The results show that the reconstructed maximum absorption coefficient of the target improves from 207% using the semi-infinite model to 114% using the two-layer model. Fig. 9(a) and (b) show the and cross section of ultrasound images of the two-layer medium. The two-layer interface was located at depth with a tilting angle from the probe. The target was located at , , and . The reconstructed target absorption map using the two-layer model is shown in (c), and the semi-infinite model in (d). In the absorption map, each slice presents a spatial image of obtained from underneath the probe surface to in depth with spacing between slices.  Table 1Fitted optical properties of a two-layer media and reconstructed absorption coefficient of a 1-cm -diam sphere target located 0.9cm from the optical probe using two-layer and semi-infinite models.
3.3.Clinical ResultsTwo clinical examples are given here to demonstrate that using the two-layer model can potentially improve the lesion quantification. Figure 10 shows an example of a -old woman who had a suspicious lesion seen by ultrasound. The ultrasound-guided biopsy confirmed that the lesion was a benign fibroadenoma. The center of the breast-tissue and chest-wall interface at the reference site, as shown in Fig. 10, was located at depth. The interface was best modeled as a piece-wise linear curve as shown in the figure. The estimated optical properties of the breast tissue and chest wall were , , , and at , and , , , and at . The fitted background optical properties using the semi-infinite model were and at , and and at . The breast-tissue and chest-wall interface at the lesion site as shown in Fig. 10 was located at depth with tilting angle, and the center of the lesion was located at , , and from the probe. Figures 10, 10, 10 were reconstructed absorption maps obtained at , , and the computed total hemoglobin concentration using the semi-infinite model, while Figs. 10, 10, 10 were corresponding results using the two-layer model. The reconstructed maximum absorption coefficients of the lesion acquired by the two-layer model were at and at . However, the corresponding maximum values obtained by the semi-infinite model were at and at . The computed total hemoglobin concentration showed a decrease from obtained from the semi-infinite model to obtained from the two-layer model. Fig. 10(a) and (b) are ultrasound images of the lesion and reference sites. (c)– through (e) show reconstructed optical absorption maps of a benign fibroadenoma at (c) , (d) , and (e) computed total hemoglobin map using the semi-infinite model. Reconstructed maximum absorption coefficients were , , and maximum total hemoglobin concentration was . (f) through (h) show reconstructed optical absorption maps at (f) , (g) , and (h) computed total hemoglobin map using the two-layer model. Reconstructed maximum absorption coefficients were , , and the computed maximum total hemoglobin concentration was .  Figure 11 shows an example of a -old woman who had a suspicious lesion seen by ultrasound. The ultrasound-guided biopsy confirmed that the lesion was a ductal carcinoma. The breast-tissue and chest-wall interface at the reference site was located at with a zero-degree tilting angle from the probe [Fig. 11]. The estimated optical properties of the breast tissue and chest wall were , , , and at , and , , , and at . The fitted background optical properties using the semi-infinite model were and at , and and at wavelengths. The breast-tissue and chest-wall interface at the lesion site as shown in Fig. 11 was located at depth with tilting angle, and the center of the lesion was located at , , and from the probe. The reconstructed maximum absorption coefficients obtained by the two-layer model were at and at . The reconstructed maximum absorption coefficients obtained by the semi-infinite model were at and at . The computed total hemoglobin concentration obtained from the two-layer and semi-infinite models was 103 and , respectively. In both benign and malignant cases, the lesion total hemoglobin contrast has been reduced; however, the total hemoglobin ratio of malignant over benign lesions was improved from 1.54 obtained from the semi-infinite model, to 1.78 obtained from the two-layer model. Based on the results obtained from simulations and phantoms, the two-layer model should be more accurate in lesion quantification by reducing errors in estimated background optical properties. Currently, we do not have enough benign and malignant cases in this subpopulation to statistically evaluate the improvement of using the two-layer model versus the semi-infinite model in lesion characterization. More patients are being recruited and more cases in this subpopulation will be pooled together to evaluate the performance of the two-layer-model-based reconstruction. Fig. 11(a) and (b) show ultrasound images of the lesion and reference sites. (c) through (e) reconstructed optical absorption maps of a malignant lesion at (c) , (d) , and (e) computed total hemoglobin map using the semi-infinite model. Reconstructed maximum absorption coefficients were , , and maximum total hemoglobin concentration was . (f) through (h) show reconstructed optical absorption maps at (f) , (g) , and (h) computed total hemoglobin map using the two-layer model. Reconstructed maximum absorption coefficients were , and . The computed maximum total hemoglobin concentration was . 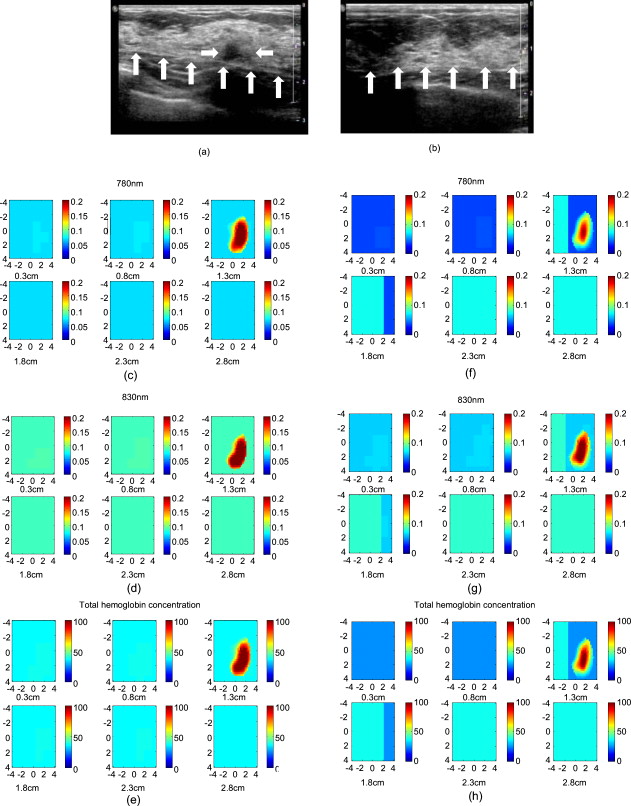 Breast tissue optical properties have been reported by several groups28, 29, 30, 31, 32, 33, 34, 35 and a summary can be found in a recent paper by Mo 36 The reported background absorption coefficient of breast tissue from nine different groups was in the range of measured in the neighborhood of . The reduced scattering coefficient was in the range of . Literature data on optical properties of chest walls are not available. The only available data are optical properties of muscles and bones. Muscle was reported to have large absorption and medium scattering coefficients, with in the range of and in the range of .37, 38, 39 Bone was a highly absorbing and scattering medium, and was reported to have large absorption and scattering coefficients, with in the range of and in the range of .40, 41 To estimate breast-tissue and chest-wall optical properties, we have applied the fitting algorithm to a group of ten patients. The average age of this group of patients is . These cases were selected from about 100 patients’ data from our on-going clinical studies and represented about 10% of the study population. The coregistered B-scan ultrasound images of these cases showed that the patients’ chest walls were less than deep from the surface of skins. Our fitting results (see Fig. 12 ) show the average and at , and the average and at . The average and at , and the average and at . If the semi-infinite model was used, the fitted average background absorptions were at and at . The corresponding reduced scattered coefficients were at and at . The fitted first-layer is lower and the second-layer is higher than the average obtained from the semi-infinite fitting at both 780- and wavelengths. The fitted first-layer is higher and the second-layer is lower than the average obtained from the semi-infinite fitting. The fitted first-layer breast-tissue optical properties reported in this study are in good agreement with the literature data. The fitted second-layer data are within the range of optical properties reported for muscles. 4.Summary and DiscussionsIn this work, a FEM-based two-layer imaging reconstruction algorithm is presented that can account for the tilted breast-tissue and chest-wall interface. Simulations and phantom experiments show that the algorithm is more accurate in estimating background optical properties and in reconstructing lesion optical properties compared to semi-infinite model-based imaging reconstruction. Prior information needed for the two-layer imaging reconstruction algorithm is the chest-wall depth and tilting angle, which is readily available from real-time coregistered ultrasound images. The improved accuracy in target reconstruction obtained by the two-layer algorithm depends on two factors: the estimated background optical properties and the depth of the second layer. The fitted optical properties of the first layer were within 13% of the true values in the simulations and within 30% in phantom experiments when the two-layer model was used. The fitted second-layer optical properties depend on the depth of the second layer interface from the optical probe. The fitted first-layer optical properties are more accurate than those of the second-layer. As the second-layer depth increases, the information of the second layer embedded in measurements diminishes. The accuracy of the reconstructed maximum absorption coefficient of the target in the two-layer model was within 10% of its true value in simulations and 25% in phantom experiments. The quantification of maximum reconstructed absorption coefficient of the target by using the two-layer model compared to the semi-infinite model improves when the second-layer depth reduces or its optical properties increase. The performance of the two-layer fitting algorithm was evaluated from clinical data obtained from ten patients whose chest-wall depths were less than . This group of patients, which was selected from about 100 patients, represents 10% of the study population. The percentage of this subpopulation could be much higher for Asian or other ethnic groups. In clinical cases where the chest wall has significant effect on the measurement data, the estimated background absorption is higher than the average reported for breast tissue when the semi-infinite model is used. Based on simulations and phantom studies, we believe the higher background absorption is partially caused by the chest-wall layer. Because the reconstructed lesion absorption is the summation of background and reconstructed absorption change from the background , a more accurate estimation of background optical properties using the two-layer model can improve the quantification of breast lesions and therefore classification of benign versus malignance. In the fitting program, the Nelder-Mead algorithm was used to estimate tissue optical properties of two-layer structures. The convergence rate of the algorithm was in the range of 150 to 230 iterations. In simulation and phantom studies, the fitted first-layer optical properties were converged to 30% of the true values. The fitting error of second-layer optical properties depends on the depth of the two layer interface and increases as the depth of the second layer increases. Because we use this algorithm with FEM and it is running in COMSOL and MATLAB environments, depending on the number of iterations and the complexity of the FEM mesh geometry (required number of voxels and elements), each fitting process can take about on a core2 PC. Currently, computation methods are being investigated to speed up the fitting process. In summary, a FEM-based imaging reconstruction algorithm that accounts for chest-wall effect in optical tomography is introduced. The algorithm has been shown to improve light quantification accuracy of lesions embedded in a two-layer tissue structure. The robustness of this algorithm is yet to be validated in a larger cohort of patients. AcknowledgmentsThis work has been supported by the National Institutes of Health (R01EB002136) and The Donaghue Medical Research Foundation. ReferencesB. J. Tromberg, A. Cerussi, N. Shah, M. Compton, A. Durkin, D. Hsiang, J. Butler, and R. Mehta,
“Imaging in breast cancer—diffuse optics in breast cancer: detecting tumors in pre-menopausal women and monitoring neoadjuvant chemotherapy,”
Breast Cancer Res., 7
(6), 279
–285
(2005). https://doi.org/10.1186/bcr1358 Google Scholar
D. R. Leff, O. J. Warren, L. C. Enfield, A. Gibson, T. Athanasiou, D. K. Patten, J. Hebden, G. Z. Yang, and A. Darzi,
“Diffuse optical imaging of the healthy and diseased breast: a systematic review,”
Breast Cancer Res. Treat., 108
(1), 9
–22
(2008). https://doi.org/10.1007/s10549-007-9582-z 0167-6806 Google Scholar
B. Chance, S. Nioka, J. Zhang, E. F. Conant, E. Hwang, S. Briest, S. G. Orel, M. D. Schnall, and B. J. Czerniecki,
“Breast cancer detection based on incremental biochemical and physiological properties of breast cancers: a six-year, two-site study,”
Acad. Radiol., 12
(8), 925
–933
(2005). https://doi.org/10.1016/j.acra.2005.04.016 1076-6332 Google Scholar
S. P. Poplack, T. D. Tosteson, W. A. Wells, B. W. Pogue, P. M. Meaney, A. Hartov, C. A. Kogel, S. K. Soho, J. J. Gibson, and K. D. Paulsen,
“Electromagnetic breast imaging: results of a pilot study in women with abnormal mammograms,”
Radiology, 243
(2), 350
–359
(2007). https://doi.org/10.1148/radiol.2432060286 0033-8419 Google Scholar
R. Choe, A. Corlu, K. Lee, T. Durduran, S. D. Konecky, M. Grosicka-Koptyra, S. R. Arridge, B. J. Czerniecki, D. L. Fraker, A. DeMichele, B. Chance, M. A. Rosen, and A. G. Yodh,
“Diffuse optical tomography of breast cancer during neoadjuvant chemotherapy: a case study with comparison to MRI,”
Med. Phys., 32
(4), 1128
–1139
(2005). https://doi.org/10.1118/1.1869612 0094-2405 Google Scholar
E. Heffer, V. Pera, O. Schutz, H. Siebold, and S. Fantini,
“Near-infrared imaging of the human breast: complementing hemoglobin concentration maps with oxygenation images,”
J. Biomed. Opt., 9
(6), 1152
–60
(2004). https://doi.org/10.1117/1.1805552 1083-3668 Google Scholar
X. P. Liang, Q. Z. Zhang, C. Q. Li, S. R. Grobmyer, L. L. Fajardo, and H. B. Jiang,
“Phase-contrast diffuse optical tomography: Pilot results in the breast,”
Acad. Radiol., 15
(7), 859
–866
(2008). https://doi.org/10.1016/j.acra.2008.01.028 1076-6332 Google Scholar
X. Intes,
“Time-domain optical mammography SoftScan: Initial results,”
Acad. Radiol., 12
(8), 934
–947
(2005). https://doi.org/10.1016/j.acra.2005.05.006 1076-6332 Google Scholar
L. Spinelli, A. Torricelli, A. Pifferi, P. Taroni, G. Danesini, and R. Cubeddu,
“Characterization of female breast lesions from multi-wavelength time-resolved optical mammography,”
Phys. Med. Biol., 50
(11), 2489
–2502
(2005). https://doi.org/10.1088/0031-9155/50/11/004 0031-9155 Google Scholar
C. H. Schmitz, D. P. Klemer, R. Hardin, M. S. Katz, Y. L. Pei, H. L. Graber, M. B. Levin, R. D. Levina, N. A. Franco, W. B. Solomon, and R. L. Barbour,
“Design and implementation of dynamic near-infrared optical tomographic imaging instrumentation for simultaneous dual-breast measurements,”
Appl. Opt., 44
(11), 2140
–2153
(2005). https://doi.org/10.1364/AO.44.002140 0003-6935 Google Scholar
G. Alexandrakis, T. J. Farrell, and M. S. Patterson,
“Accuracy of the diffusion approximation in determining the optical properties of a two-layer turbid medium,”
Appl. Opt., 37
(31), 7401
–7409
(1998). https://doi.org/10.1364/AO.37.007401 0003-6935 Google Scholar
D. Floery, T. H. Helbich, C. C. Riedl, S. Jaromi, M. Weber, S. Leodolter, and M. H. Fuchsjaeger,
“Characterization of benign and malignant breast lesions with computed tomographic laser mammography (CTLM),”
Invest. Radiol., 40 328
–335
(2005). https://doi.org/10.1097/01.rli.0000164487.60548.28 0020-9996 Google Scholar
D. Grosenick, K. T. Moesta, M. Moller, J. Mucke, H. Wabnitz, B. Gebauer, C. Stroszczynski, B. Wassermann, P. M. Schlag, and H. Rinneberg,
“Time-domain scanning optical mammography: I. Recording and assessment of mammograms of 154 patients,”
Phys. Med. Biol., 50
(11), 2429
–2449
(2005). https://doi.org/10.1088/0031-9155/50/11/001 0031-9155 Google Scholar
B. Brooksby, B. W. Pogue, S. D. Jiang, H. Dehghani, S. Srinivasan, C. Kogel, T. D. Tosteson, J. Weaver, S. P. Poplack, and K. D. Paulsen,
“Imaging breast adipose and fibroglandular tissue molecular signatures by using hybrid MRI-guided near-infrared spectral tomography,”
Proc. Natl. Acad. Sci. U.S.A., 103
(23), 8828
–8833
(2006). https://doi.org/10.1073/pnas.0509636103 0027-8424 Google Scholar
V. Ntziachristos, A. G. Yodh, M. D. Schnall, and B. Chance,
“MRI-guided diffuse optical spectroscopy of malignant and benign breast lesions,”
Neoplasia, 4
(4), 347
–354
(2002). https://doi.org/10.1038/sj.neo.7900244 1522-8002 Google Scholar
Q. Zhang, T. J. Brukilacchio, A. Li, J. J. Stott, T. Chaves, E. Hillman, T. Wu, M. Chorlton, E. Rafferty, R. H. Moore, D. B. Kopans, and D. A. Boas,
“Coregistered tomographic x-ray and optical breast imaging: initial results,”
J. Biomed. Opt., 10
(2), 024033
(2005). https://doi.org/10.1117/1.1899183 1083-3668 Google Scholar
Q. Zhu, M. M. Huang, N. G. Chen, K. Zarfos, B. Jagjivan, M. Kane, P. Hedge, and S. H. Kurtzman,
“Ultrasound-guided optical tomographic imaging of malignant and benign breast lesions: Initial clinical results of 19 cases,”
Neoplasia, 5
(5), 379
–388
(2003). 1522-8002 Google Scholar
Q. Zhu, E. B. Cronin, A. A. Currier, H. S. Vine, M. M. Huang, N. G. Chen, and C. Xu,
“Benign versus malignant breast masses: optical differentiation with US-guided optical imaging reconstruction,”
Radiology, 237
(1), 57
–66
(2005). https://doi.org/10.1148/radiol.2371041236 0033-8419 Google Scholar
Q. Zhu, C. Xu, P. Guo, A. Aguirre, B. Yuan, F. Huang, D. Castilo, J. Gamelin, S. Tannenbaum, M. Kane, P. Hegde, and S. Kurtzman,
“Optimal probing of optical contrast of breast lesions of different size located at different depths by US localization,”
Technol. Cancer Res. Treat., 5
(4), 365
–380
(2006). 1533-0346 Google Scholar
C. Xu and Q. Zhu,
“Estimation of chest-wall induced diffused wave distortion with the assistance of ultrasound,”
Appl. Opt., 44
(20), 4255
–4264
(2005). https://doi.org/10.1364/AO.44.004255 0003-6935 Google Scholar
C. Xu, M. Das, Y. Ardeshirpour, and Q. Zhu,
“An image reconstruction method for a two-layer tissue structure accounts for chest-wall effects in breast imaging,”
J. Biomed. Opt., 13
(6), 064029
(2008). https://doi.org/10.1117/1.3041497 1083-3668 Google Scholar
A. Kienle, M. S. Patterson, N. Dögnitz, R. Bays, G. Wagnières, and H. Van Den Bergh,
“Noninvasive determination of the optical properties of two-layered turbid media,”
Appl. Opt., 37 779
–91
(1998). https://doi.org/10.1364/AO.37.000779 0003-6935 Google Scholar
M. Das, C. Xu, and Q. Zhu,
“Analytical solution for light propagation in a two-layer tissue structure with a tilted interface for breast imaging,”
Appl. Opt., 45
(20), 5027
–5036
(2006). https://doi.org/10.1364/AO.45.005027 0003-6935 Google Scholar
S. R. Arridge and M. Schweiger,
“Photon-measurement density-functions: finite-element-method calculations,”
Appl. Opt., 34
(34), 8026
–8037
(1995). https://doi.org/10.1364/AO.34.008026 0003-6935 Google Scholar
H. Dehghani, S. Srinivasan, B. W. Pogue, and A. Gibson,
“Numerical modelling and image reconstruction in diffuse optical tomography,”
Philos. Trans. R. Soc. London, Ser. A, 367
(1900), 3073
–3093
(2009). https://doi.org/10.1098/rsta.2009.0090 0962-8428 Google Scholar
Y. Ardeshirpour, M. Huang, and Q. Zhu,
“Effect of the tilted chest-wall on breast lesion reconstruction,”
J. Biomed. Opt., 14
(04), 044005
(2009). https://doi.org/10.1117/1.3160548 1083-3668 Google Scholar
J. C. Lagarias, J. A. Reeds, M. H. Wright, and P. E. Wright,
“Convergence properties of the Nelder-Mead simplex method in low dimensions,”
SIAM J. Optim., 9
(1), 112
–147
(1998). https://doi.org/10.1137/S1052623496303470 1052-6234 Google Scholar
T. Durduran, R. Choe, J. Culver, L. Zubkov, M. Holboke, J. Giammarco, B. Chance, and A. Yodh,
“Bulk optical properties of healthy female breast tissue,”
Phys. Med. Biol., 47 2847
–2861
(2002). https://doi.org/10.1088/0031-9155/47/16/302 0031-9155 Google Scholar
D. Grosenick, K. T. Moesta, H. Wabnitz, J. Mucke, C. Stroszczynski, R. Macdonald, P. M. Schlag, and H. Rinneberg,
“Time-domain optical mammography: initial clinical results on detection and characterization of breast tumors,”
Appl. Opt., 42
(16), 3170
–3186
(2003). https://doi.org/10.1364/AO.42.003170 0003-6935 Google Scholar
B. W. Pogue, S. Jiang, H. Dehghani, C. Kogel, S. Soho, S. Srinivasan, X. Song, T. D. Tosteson, S. P. Poplack, and K. D. Paulsen,
“Characterization of hemoglobin, water, and NIR scattering in breast tissue: analysis of intersubject variability and menstrual cycle changes,”
J. Biomed. Opt., 9
(3), 541
–552
(2004). https://doi.org/10.1117/1.1691028 1083-3668 Google Scholar
S. P. Poplack, K. D. Paulsen, A. Hartov, P. M. Meaney, B. W. Pogue, T. D. Tosteson, M. R. Grove, S. K. Soho, and W. A. Wells,
“Electromagnetic breast imaging: average tissue property values in women with negative clinical findings,”
Radiology, 231 571
–580
(2004). https://doi.org/10.1148/radiol.2312030606 0033-8419 Google Scholar
L. Spinelli, A. Torricelli, A. Pifferi, P. Taroni, G. M. Danesini, and R. Cubeddu,
“Bulk optical properties and tissue components in the female breast from multiwavelength time-resolved optical mammography,”
J. Biomed. Opt., 9 1137
–1142
(2004). https://doi.org/10.1117/1.1803546 1083-3668 Google Scholar
K. Suzuki, Y. Yamashita, K. Ohta, M. Kaneko, M. Yoshida, and B. Chance,
“Quantitative measurement of optical parameters in normal breasts using time-resolved spectroscopy: in vivo results of 30 Japanese women,”
J. Biomed. Opt., 1 330
–334
(1996). https://doi.org/10.1117/12.239902 1083-3668 Google Scholar
P. Taroni, G. Danesini, A. Torricelli, A. Pifferi, L. Spinelli, and R. Cubeddu,
“Clinical trial of time-resolved scanning optical mammography at 4 wavelengths between 683 and ,”
J. Biomed. Opt., 9
(3), 464
–473
(2004). https://doi.org/10.1117/1.1695561 1083-3668 Google Scholar
T. Svensson, J. Swartling, P. Taroni, A. Torricelli, P. Lindblom, C. Ingvar, and S. Andersson-Engels,
“Characterization of normal breast tissue heterogeneity using time-resolved near-infrared spectroscopy,”
Phys. Med. Biol., 50 2559
–2571
(2005). https://doi.org/10.1088/0031-9155/50/11/008 0031-9155 Google Scholar
W. Mo, T. S. S. Chan, L. Chen, and N. Chen,
“Quantitative characterization of optical and physiological parameters in normal breasts using time-resolved spectroscopy: in vivo results of 19 Singapore women,”
J. Biomed. Opt., 14
(6), 064004
(2009). https://doi.org/10.1117/1.3257251 1083-3668 Google Scholar
W. Cheong, S. A. Prahl, and A. J. Welch,
“A review of the optical property of biological tissues,”
IEEE J. Quantum Electron., 26 2166
–2185
(1990). https://doi.org/10.1109/3.64354 0018-9197 Google Scholar
S. J. Matcher, M. Cope, and D. T. Delpy,
“In vivo measurements of the wavelength dependence of tissue-scattering coefficients between 760 and measured with time-resolved spectroscopy,”
Appl. Opt., 36
(1), 386
–396
(1997). https://doi.org/10.1364/AO.36.000386 0003-6935 Google Scholar
Y. Yang, O. Soyemi, M. Landry, and B. Soller,
“Influence of a fat layer on the near infrared spectra of human muscle: quantitative analysis based on two-layered Monte Carlo simulations and phantom experiments,”
Opt. Express, 13
(5), 1570
–1579
(2005). https://doi.org/10.1364/OPEX.13.001570 1094-4087 Google Scholar
P. Taroni, D. Comelli, A. Farina, A. Pifferi, and A. Kienle,
“Time resolved diffuse optical spectroscopy of small tissue samples,”
Opt. Express, 15
(6), 3301
–3311
(2007). https://doi.org/10.1364/OE.15.003301 1094-4087 Google Scholar
Y. Xu, N. Iftimia, H. Jiang, L. L. Key, and M. B. Bolster,
“Imaging of in vitro and in vivo bones and joints with continuous-wave diffuse optical tomography,”
Opt. Express, 8
(7), 447
–451
(2001). https://doi.org/10.1364/OE.8.000447 1094-4087 Google Scholar
|
||||||||||||||||||||||||||||||||||||||||||||||||||||||


